Categories
In the last decade, analytical reporting has become a vital part of business intelligence.
Yes, you read that right.
Rather than making decisions that only seem logical, most businesses are adjusting their strategies based on data-driven insights from analytical report examples.
An analytical report is a data storytelling document you can share with stakeholders to determine the best course of action. For instance, you can easily review an analytical report to identify a potential obstacle before adopting a marketing strategy.
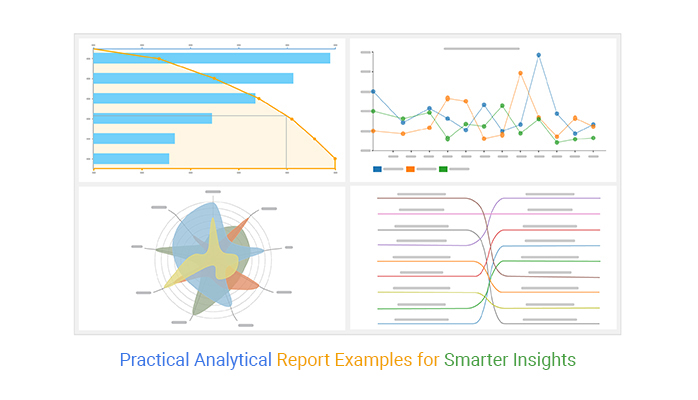
This is where analytical report-based charts, such as Slope Graph and Area Chart, come in.
Excel lacks ready-made and visually stunning a, analytical report-oriented visualization designs.
You can supercharge Excel by installing a particular add-in to access ready-to-go analytical report charts and graphs.
In this blog, you’ll learn,
Before jumping right into the blog’s core, we’ll address the following question: What is an analytical report?
An analytical report uses data visualization charts to display actionable insights.
Businesses create analytical report examples to:
Assume you and your team intend to implement a new strategy. What document can you use to present your findings to the top management or the investors?
Yes, you’re right if your answer is an analytical report.
Analytical report examples, such as Pareto Charts, Area Charts, Slope Charts, and data reporting, represent insights into raw data.
In the coming section, we’ll address the following question: What are the different types of analytical reports?
There are two key types of analytical report examples, namely:
Quantitative data is numerical information you can analyze and visualize using assorted charts and graphs.
On the other hand, qualitative data is mostly textual data that describes a situation or issue in your business or workplace.
This data type is mostly categorical because it can be grouped according to a particular scale or methodology. Qualitative data mostly captures demographics and other subjective data.
You can integrate qualitative and quantitative data types in your analytic report examples.
So, what is the purpose of analytical reports?
Check out the benefits of analytical examples, such as the Slope Chart below:
You can use an analytical report to communicate actionable insights into the target market. After all, tables and spreadsheets are not that friendly to investors and top management.
And this is because they’re monotonous and less emotionally appealing.
Most businesses prepare analytical reports regularly, often monthly, to communicate their present statuses.
These reports mostly show the current financial position versus the strategic goals set. Mostly, the finance team uses analytical reports to pass compelling financial data stories that are easy to understand.
Every business strives to rejuvenate its operational efficiency by:
You can leverage analytical report examples to capture the analysis of your internal operations for the top management or investors.
We’ll take you through analytical report examples for data analysis in the coming section.

Content is the new gold in today’s business landscape.
You’re likely to come to a grinding halt if you don’t provide valuable content that inspires and enlightens your audience. You can capture the state of your business’ SEO with an analytical report. An SEO report summarizes all the key data metrics that matter to your business and are aligned with strategic goals.
This analytical report type will likely have the following:
Some of the analytical report examples you can use are displayed below

This analytical report example displays insights into your financial data. Also, it’s a quick reference material if you want to know your company’s financial position at the macro level.
Some of the key items displayed by this report include:
All these metrics provide you with valuable insights you can easily share with shareholders or top management.
Some of the charts you can leverage to populate your financial report dashboard are displayed below:

In the coming section, we’ll address how to create an analytical report in Excel.
Excel is one of the most used visualization instruments. However, the spreadsheet application lacks ready-to-use analytical report-based charts, such as Mosaic plots, Pareto charts, and Slope Charts.
We’re not advising you to do away with Excel in favor of other expensive tools.
This is because there’s an amazingly affordable visualization tool that comes as an add-in you can easily install in Excel to access insightful and ready-to-use analytical report-based charts. The tool is called ChartExpo.
So, what is ChartExpo?
ChartExpo is an add-in you can easily install in your Excel without needing tutorials.
With many ready-to-go and insightful charts, graphs, and maps, ChartExpo turns your complex, raw data into easy-to-interpret and visually appealing ready-to-use analytical report-based charts that tell data stories in real time.
More benefits
This section will use Slope Graphs to visualize the tabular data below.
| Period | Cities | Sales |
| Previous | Gainesville | 31028 |
| Previous | Wareham | 22350 |
| Previous | Sacramento | 14187 |
| Previous | New Carlisle | 45253 |
| Previous | Houston | 22209 |
| Previous | Decatur | 37722 |
| Previous | Chicago | 48129 |
| Previous | Boise | 34076 |
| Previous | Wilsonville | 51268 |
| Previous | Waldwick | 39288 |
| Previous | Syracuse | 57314 |
| Previous | Harrisburg | 47667 |
| Previous | Glens Falls | 45498 |
| Previous | Baton Rouge | 17795 |
| Current | Gainesville | 41278 |
| Current | Miami | 34903 |
| Current | Chantilly | 20116 |
| Current | Folsom | 40771 |
| Current | Houston | 57017 |
| Current | Decatur | 57355 |
| Current | Chicago | 19094 |
| Current | Boise | 40079 |
| Current | Bridgeport | 44813 |
| Current | Waldwick | 32249 |
| Current | Houma | 20691 |
| Current | Harrisburg | 37080 |
| Current | Glens Falls | 16982 |
| Current | Baton Rouge | 23721 |


The following video will help you create a Slope Chart in Microsoft Excel.
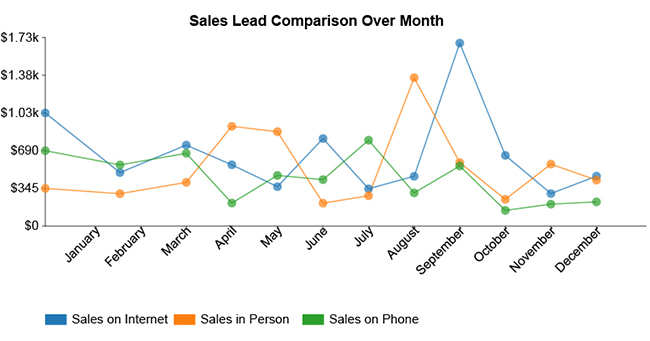
This section will use a Multi Series Line Chart to visualize the data below.
| Year | Sales on Internet | Sales in Person | Sales on Phone |
| January | 1036 | 345 | 691 |
| February | 456 | 263 | 526 |
| March | 741 | 400 | 666 |
| April | 561 | 913 | 211 |
| May | 361 | 864 | 464 |
| June | 801 | 210 | 425 |
| July | 342 | 278 | 786 |
| August | 456 | 1357 | 304 |
| September | 1674 | 581 | 550 |
| October | 647 | 245 | 144 |
| November | 298 | 567 | 201 |
| December | 457 | 421 | 222 |
This section will use the Pareto Diagram to visualize the tabular data below.
| Products | Sales |
| Rouge | 1579 |
| Mascara | 1962 |
| Lipstick | 3654 |
| Foundation | 2578 |
| Powder | 4942 |
| Eyebrow pencil | 5561 |
| Eye shadows | 2961 |
| Nail polish | 4831 |
| Lip gloss | 8961 |

This section will use a Radar Chart to display insights into the tabular data below.
| Products | Months | Sales |
| Lip Gloss | January | 981 |
| Eyebrow Pencil | January | 396 |
| Powder | January | 695 |
| Lip Gloss | February | 448 |
| Eyebrow Pencil | February | 393 |
| Powder | February | 404 |
| Lip Gloss | March | 858 |
| Eyebrow Pencil | March | 570 |
| Powder | March | 379 |
| Lip Gloss | April | 1088 |
| Eyebrow Pencil | April | 228 |
| Powder | April | 369 |
| Lip Gloss | May | 365 |
| Eyebrow Pencil | May | 1096 |
| Powder | May | 228 |
| Lip Gloss | June | 544 |
| Eyebrow Pencil | June | 434 |
| Powder | June | 458 |
| Lip Gloss | July | 881 |
| Eyebrow Pencil | July | 306 |
| Powder | July | 219 |
| Lip Gloss | August | 1407 |
| Eyebrow Pencil | August | 499 |
| Powder | August | 211 |
| Lip Gloss | September | 1385 |
| Eyebrow Pencil | September | 419 |
| Powder | September | 1001 |
| Lip Gloss | October | 357 |
| Eyebrow Pencil | October | 466 |
| Powder | October | 213 |
| Lip Gloss | November | 160 |
| Eyebrow Pencil | November | 427 |
| Powder | November | 479 |
| Lip Gloss | December | 487 |
| Eyebrow Pencil | December | 327 |
| Powder | December | 286 |


Analytical reports can help you gain insights into your business’s current problems. Besides, the insights generated can help you to enhance and streamline operations for more revenue.
You can easily enhance your team’s communication using analytical examples, such as a dashboard with Pareto, Treemap, and Slope Charts.
The report can provide each team member with insights to pursue more opportunities, combat potential pitfalls, and streamline internal operations.
Analytical reports can help you to improve your business’s ability to adapt to emerging tastes and preferences.
An analytical report uses data visualization charts to display actionable insights.
Businesses create analytical report examples to:
Assume you and your team intend to implement a new strategy. The go-to document we recommend is an analytical report.
Financial evaluation: Most businesses prepare analytical reports regularly, often monthly, to communicate their present statuses.
These reports mostly show the current financial position versus the strategic goals set. Mostly, the finance team uses analytical reports to pass compelling financial data stories that are easy to understand.
In the last decade, analytical reporting has become a vital part of business intelligence.
Yes, you read that right.
Rather than making decisions that only seem logical, most businesses are adjusting their strategies based on data-driven insights from analytical report examples.
An analytical report is a data storytelling document you can share with stakeholders to determine the best course of action. For instance, you can easily review an analytical report to identify a potential obstacle before adopting a marketing strategy.
This is where analytical report-based charts, such as Slope Graph, come in.
How much did you enjoy this article?


Calculate accounts receivable turnover ratio to measure credit collection speed, improve cash flow, and strengthen your financial strategy. Read on!

Change Management KPIs are the key to tracking adoption, performance, and ROI during transitions. Find out which metrics matter. Read on!

Data collection methods and techniques determine the quality of every insight you act on. Explore key approaches for gathering reliable data. Read on!


