• Home
  • Tools dropdown img
    • Spreadsheet Charts

      • ChartExpo for Google Sheets
      • ChartExpo for Microsoft Excel
    • Power BI Charts

      • Power BI Custom Visuals by ChartExpo
    • Word Cloud

  • Charts dropdown img
    • Chart Category

      • Bar Charts
      • Circle Graphs
      • Column Charts
      • Combo Charts
      • Comparison Charts
      • Line Graphs
      • PPC Charts
      • Sentiment Analysis Charts
      • Survey Charts
    • Chart Type

      • Box and Whisker Plot
      • Clustered Bar Chart
      • Clustered Column Chart
      • Comparison Bar Chart
      • Control Chart
      • CSAT Survey Bar Chart
      • CSAT Survey Chart
      • Dot Plot Chart
      • Double Bar Graph
      • Funnel Chart
      • Gauge Chart
      • Likert Scale Chart
      • Matrix Chart
      • Multi Axis Line Chart
      • Overlapping Bar Chart
      • Pareto Chart
      • Radar Chart
      • Radial Bar Chart
      • Sankey Diagram
      • Scatter Plot Chart
      • Slope Chart
      • Sunburst Chart
      • Tornado Chart
      • Waterfall Chart
      • Word Cloud
    • Google Sheets
      Microsoft Excel
  • Services
  • Pricing
  • Contact us
  • Blog
  • Support dropdown img
      • Gallery
      • Videos
      • Contact us
      • FAQs
      • Resources
    • Please feel free to contact us

      atsupport@chartexpo.com

Categories
All Data Visualizations Data Analytics Surveys
Add-ons/
  • Google Sheets
  • Microsoft Excel
  • Power BI
All Data Visualizations Data Analytics Surveys
Add-ons
  • Google Sheets
  • Microsoft Excel
  • Power BI

We use cookies

This website uses cookies to provide better user experience and user's session management.
By continuing visiting this website you consent the use of these cookies.

Ok

ChartExpo Survey


Home > Blog > Data Analytics

Market Share for Mobile Phones: A Complete Analysis

Market share for mobile phones is a snapshot of an industry in motion. Stroll down any city street, and you’ll see hands of all shapes and sizes clutching smartphones. Each device is a vote, a consumer’s choice that shifts the scales of market dominance.

Market Share for Mobile Phones

Over 350 million smartphones journeyed into pockets worldwide in the last quarter alone. Among these, brand leaders carved their names with innovation and marketing prowess.

But what do these figures mean? Market share for mobile phones isn’t a mere statistic. It’s a narrative of consumer preference, technological advances, and branding battles on a global stage.

Consider this: a single percentage point in market share for mobile phones can represent millions in revenue. As consumers, our collective choices crown kings and dethrone the lagging competitors.

Yet, understanding these shifts is no small feat. Grasping market share for mobile phones demands peering into data, spotting trends, and predicting futures. The ebb and flow of market share tells a tale of our times’ our needs, desires, and economic tides.

This blog post dives into the arena of mobile phone market share, analyzing how giants stay on top and how underdogs stage their coups. The strategies, the numbers, and the consumer insights all converge here.

Welcome to the crisscrossing paths of innovation, strategy, and consumer choice. A journey through the market share for mobile phones begins now.

Table of Contents:

  1. Understanding Market Share for Mobile Phones
  2. What Factors Affect Smartphone Market Share?
  3. How to Calculate Cell Phone Market Share?
  4. How to Examine the Market Share of Mobile Devices?
  5. Wrap Up

First…

Understanding Market Share for Mobile Phones

Definition: Market share for mobile phones is the portion of total sales or revenue a particular manufacturer/brand controls. Market share is calculated by dividing a company’s sales revenue or unit sales by the total market sales. Then, multiply by 100 to express it as a percentage.

Market share is a key indicator of a company’s competitive position and performance within the industry. Higher market share indicates stronger brand presence, customer loyalty, and competitive advantage. Companies often strive to increase their market share through various strategies, such as product innovation and pricing. Monitoring market share helps to understand a company’s relative position in the market and identify growth opportunities.

Here’s how market share works and why it matters:

  • Calculation: Market share is calculated by dividing a company’s sales revenue or unit sales by the total market sales. The result is then multiplied by 100 to express it as a percentage. This helps a company compare and analyze its performance in the mobile phone industry.
  • Competitive analysis: It also helps companies conduct competitive analysis based on their market share in comparison to other companies. This analysis helps assess the current market, which includes identifying the industry’s strengths, weaknesses, opportunities, and threats. Then, it makes strategic, data-based decisions.
  • Industry trends: A company can learn a lot about industry trends and behavior by monitoring the market share. It helps companies stay updated about consumer preferences and trends, technological innovation, and developing market segments. From this, they can leverage opportunities and innovate.
  • Strategic planning: The data from market share analysis can help to assess and analyze a company’s market standing. Based on this analysis, companies can make informed strategic decisions to improve.
  • Investor confidence: A company’s market share is an important key performance indicator and a significant factor influencing investor confidence. A growing market share and the resultant dominance within the industry indicate the firm’s strong position and leadership. It may also attract potential investors and add value to shareholder equity.

What Factors Affect Smartphone Market Share?

Smartphone market share starts with a solid understanding of the crucial elements in consumer purchasing decisions. These key competitive factors can affect your strategy and, therefore, your market share:

  • Product innovation and differentiation: Leads to competitive advantage and allows for higher market share. A company that leverages technology and differentiates itself through unique designs is likely to increase its market share.
  • Brand reputation and recognition: A good brand reputation is connected with higher customer trust. A brand that’s known to be trustworthy and delivers quality products can increase its market share. More customers will prefer a more expensive device because they consider the product a good investment.
  • Marketing and advertising: Marketing and advertising for smartphones can greatly influence consumer demand. By selecting the right channels, businesses can pinpoint their target audience and influence their consumers’ buying habits.
  • Price and value proposition: Pricing strategy here means creating an attractive price and convincing consumers that they get the best value. Improving the included features at the same price can increase a company’s market share among budget-conscious consumers.
  • Distribution and retail channels: Companies should offer a wide range of distribution options to make their smartphones available to their target customers. They should also work closely with retailers so that the longer distribution cycle does not affect their reputation.
  • Global expansion and market penetration: Expansion into new markets and regions allows companies to tap into additional consumer segments and increase market share. Understanding local preferences and adapting strategies accordingly is crucial for success.
  • Customer experience and support: Providing exceptional customer service, warranties, and after-sales support fosters brand loyalty and positive word-of-mouth, driving market share growth.
  • Regulatory and legal considerations: Compliance with regulatory requirements and legal standards is essential for maintaining market share and reputation. Adhering to industry regulations and addressing legal challenges is crucial for long-term success.

How to Calculate Cell Phone Market Share?

Calculating cell phone market share involves several steps to analyze sales data and determine a company’s position within the industry. Here’s a step-by-step guide:

  1. Define the market scope: Identify the geographical area and specific segment of the cell phone market you want to analyze.
  2. Gather sales data: Obtain sales data from reliable sources such as market research reports, industry associations, or company financial reports.
  3. Identify competitors: Identify the key players and competitors in the cell phone market whose sales data will be analyzed.
  4. Determine total market sales: Aggregate the sales data to calculate the total number of cell phones sold in the defined market scope.
  5. Calculate company/brand sales: Determine the sales figures for the company or brand of interest within the total market sales data.
  6. Compute market share: Divide the company or brand’s sales by the total market sales. Then, multiply by 100 to calculate its market share as a percentage.
  7. Repeat for each company/brand: Repeat the calculation process for each competitor to determine their respective market shares.
  8. Analyze results: Analyze the calculated market shares to understand each company’s relative position and competitive strength.
  9. Consider limitations: Consider limitations such as data accuracy, sample size, and potential biases in the sales data. These limitations may impact the accuracy of the market share calculations.

How to Examine the Market Share of Mobile Devices?

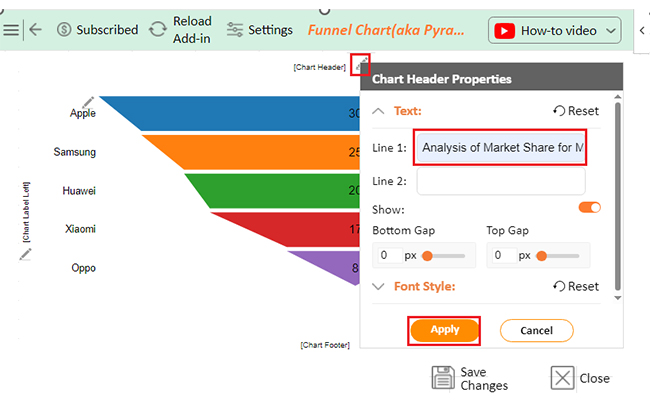
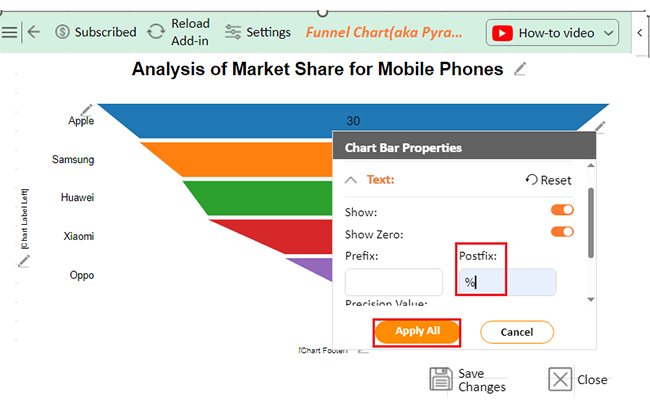
Analyzing mobile device market share using a Funnel Chart is like piecing together a jigsaw puzzle; only the pieces keep shape-shifting. Data visualization is the cheat code in this game, turning abstract numbers into a masterpiece of clarity.

Excel, our old-school puzzle buddy, often leaves us squinting at tiny pieces, struggling to spot patterns. Then there’s ChartExpo, the savvy sidekick that turns Excel’s grayscale into a kaleidoscope of insight. It doesn’t just fill the gaps; it turns data into insightful charts where trends pop and insights sparkle.

With ChartExpo, you’re not just analyzing the market share of mobile devices; you’re painting the Sistine Chapel of statistics.

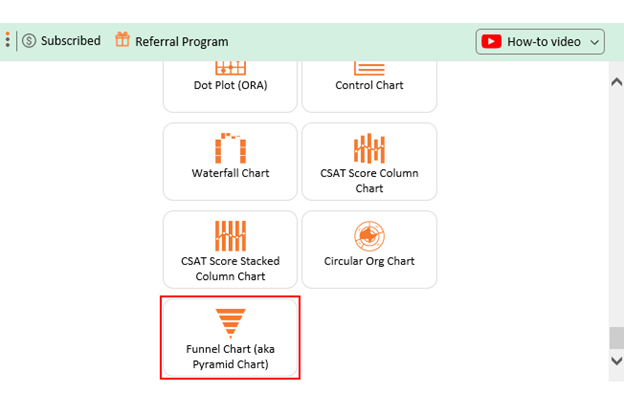
Let’s learn how to install ChartExpo in Excel.

  1. Open your Excel application.
  2. Open the worksheet and click the “Insert” menu.
  3. You’ll see the “My Apps” option.
  4. In the Office Add-ins window, click “Store” and search for ChartExpo on my Apps Store.
  5. Click the “Add” button to install ChartExpo in your Excel.

ChartExpo charts are available both in Google Sheets and Microsoft Excel. Please use the following CTAs to install the tool of your choice and create beautiful visualizations with a few clicks in your favorite tool.

Example

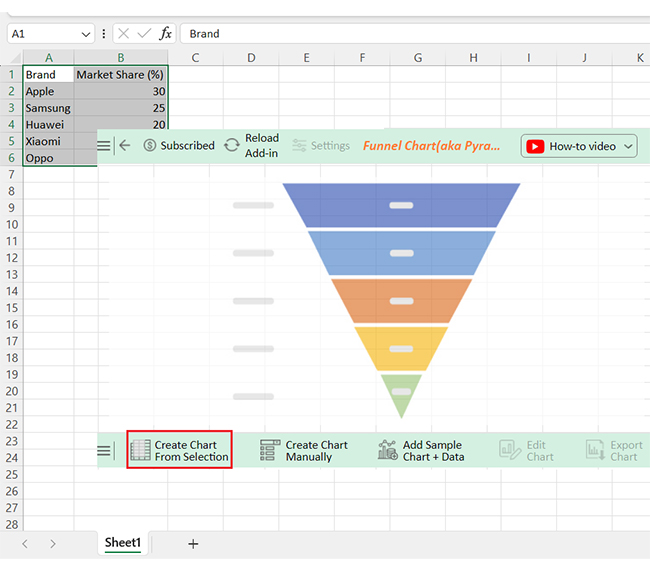
Let’s analyze the market share of mobile device data below using ChartExpo.

Brand Market Share (%)
Apple 30
Samsung 25
Huawei 20
Xiaomi 17
Oppo 8
  • To get started with ChartExpo, install ChartExpo in Excel.
  • Now Click on My Apps from the INSERT menu.
insert chartexpo in excel
  • Choose ChartExpo from My Apps, then click Insert.
open chartexpo in excel
  • Once it loads, scroll through the charts and choose the “Funnel Chart (aka Pyramid Chart)” from the list.
Search Funnel Chart
  • Click the “Create Chart From Selection” button after selecting the data from the sheet, as shown.
Click Create Chart From Selection for Showing Market Share for Mobile Phones
  • ChartExpo will generate the visualization below for you.
Edit Chart for Showing Market Share for Mobile Phones
  • If you want to have the chart’s title, click Edit Chart, as shown in the above image.
  • Click the pencil icon next to the Chart Header to change the title.
  • It will open the properties dialog. Under the Text section, you can add a heading in Line 1 and enable Show.
  • Give the appropriate title of your chart and click the Apply button.
Add Chart Header for Showing Market Share for Mobile Phones
  • You can add a percentage sign with all values:
Add Postfix for Showing Market Share for Mobile Phones
  • Click the Save Changes button to persist the changes.
Save Changes for Showing Market Share for Mobile Phones
  • Your Funnel Chart will appear below.
Final Market Share for Mobile Phones

Insights

  • Apple is at the forefront with a 30% market share, showcasing robust brand loyalty and high-end product placement.
  • Samsung is right behind with a 25% stake, showing its strong presence and competitive products.
  • Even with recent challenges, Huawei maintains a 20% market share, demonstrating its worldwide reach.
  • Xiaomi and Oppo secured smaller portions, demonstrating fierce competition in the mobile device industry.

FAQs

Who has the largest market share in mobile phones?

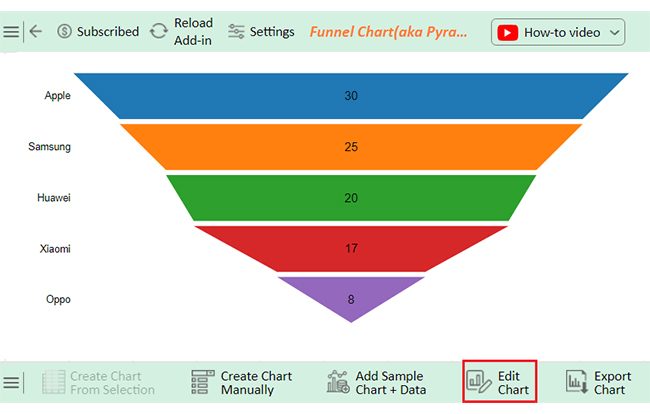
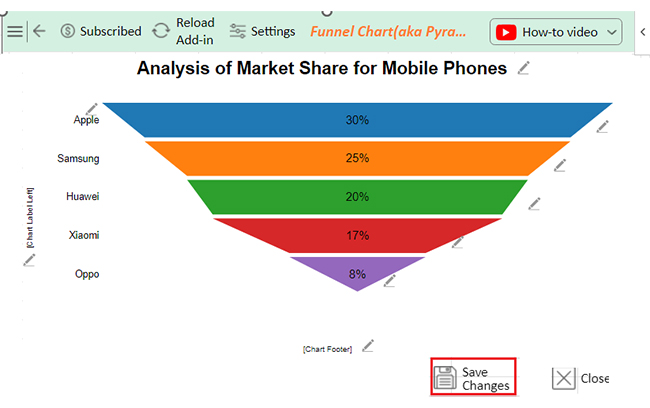
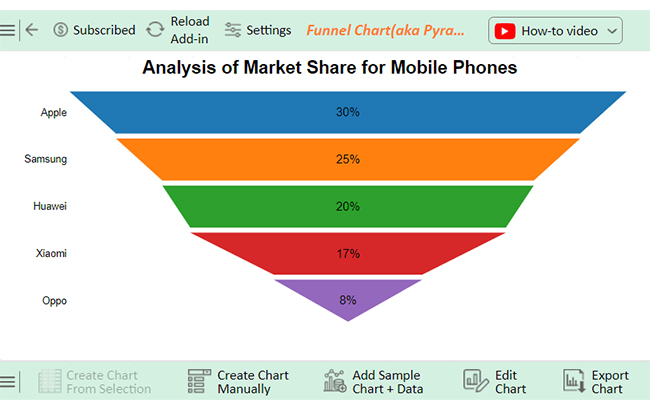
Apple currently holds the largest market share in mobile phones globally. Apple’s iPhones are renowned for their innovative products and strong brand loyalty. They have consistently dominated the premium smartphone segment, contributing to its market leadership.

What is the market share of mobile phones in 2024?

Apple dominates the global market share of mobile phones in 2024, with approximately 30%. Other major players include Samsung, with around 20%, followed by Huawei, Xiaomi, and others. Each brand holds varying shares of the market.

What is the market share of Apple vs. Android?

Apple and Android compete for dominance in the mobile phone market. As of 2024, Apple holds around 30% of the market share, primarily with its iPhones. Meanwhile, Android, as an operating system used by various manufacturers, commands the remaining majority share, approximately 70%.

Wrap Up

Companies operating in the mobile phone industry must know all the players’ market shares. Market share is how much the company has transacted in terms of sales of the entire market. Therefore, when a company has a good market share, its brand will be the most recognized. Competitive advantage will also be realized as more market shares are generated.

The information will assist in understanding a company’s market position. Moreover, such analysis will enable companies to understand the sector from a competitive perspective.

Furthermore, the breakdown of the market will offer companies insight into where their strength lies. And, in turn, implement further strategies to counter the threat. During this analysis, the market share will be the primary performance indicator.

Moreover, market share analysis facilitates strategic decision-making and resource allocation within companies. It helps to prioritize investments, allocate budgets, and allocate resources to areas with the greatest growth potential. This, as a result, ensures optimal returns on investment.

Conclusively, the market share for mobile phones is a game changer. By leveraging market share data effectively, companies can identify opportunities, mitigate risks, and make informed decisions. Consequently, this leads to market leadership and competitive advantage.

How much did you enjoy this article?

PBIAd1
Start Free Trial!
135630

Related articles

next previous
Data Analytics31 min read

Data Analysis Without Nonsense: Fix the Right Problem, Fast

Data analysis can mislead when metrics look right but outcomes fail. Learn how to spot red flags, fix failures, and make better decisions. Read on!

Data Analytics29 min read

Variance Analysis Isn’t a Math Problem, It’s a Trust Problem

Variance analysis helps identify what went wrong, who owns it, and what to do next. Use it to drive decisions, not just reports. Learn more!

Data Analytics10 min read

Supplier Comparison Template: Download It Now

A supplier comparison template streamlines vendor evaluation by comparing cost and quality. Click here to learn its benefits and how to analyze them.

Data Analytics32 min read

Ecommerce Analytics: How to Fix What It Often Gets Wrong

Ecommerce analytics often lead to mixed signals and costly misreads. Fix attribution gaps, align teams, and act on the right data. Get started now!

Data Analytics30 min read

When Sales Funnel Breaks: Failures, Fixes, & Funnel Debt

Is your sales funnel hiding costly gaps? Learn how pipeline stalls, false metrics, and handoff chaos could be draining revenue. Get started now!

ChartExpo logo

Turn Data into Visual
Stories

CHARTEXPO

  • Home
  • Gallery
  • Videos
  • Services
  • Pricing
  • Contact us
  • FAQs
  • Privacy policy
  • Terms of Service
  • Sitemap

TOOLS

  • ChartExpo for Google Sheets
  • ChartExpo for Microsoft Excel
  • Power BI Custom Visuals by ChartExpo
  • Word Cloud

CATEGORIES

  • Bar Charts
  • Circle Graphs
  • Column Charts
  • Combo Charts
  • Comparison Charts
  • Line Graphs
  • PPC Charts
  • Sentiment Analysis Charts
  • Survey Charts

TOP CHARTS

  • Sankey Diagram
  • Likert Scale Chart
  • Comparison Bar Chart
  • Pareto Chart
  • Funnel Chart
  • Gauge Chart
  • Radar Chart
  • Radial Bar Chart
  • Sunburst Chart
  • see more
  • Scatter Plot Chart
  • CSAT Survey Bar Chart
  • CSAT Survey Chart
  • Dot Plot Chart
  • Double Bar Graph
  • Matrix Chart
  • Multi Axis Line Chart
  • Overlapping Bar Chart
  • Control Chart
  • Slope Chart
  • Clustered Bar Chart
  • Clustered Column Chart
  • Box and Whisker Plot
  • Tornado Chart
  • Waterfall Chart
  • Word Cloud
  • see less

RESOURCES

  • Blog
  • Resources
  • YouTube
SIGN UP FOR UPDATES

We wouldn't dream of spamming you or selling your info.

© 2025 ChartExpo, all rights reserved.