Categories
By ChartExpo Content Team
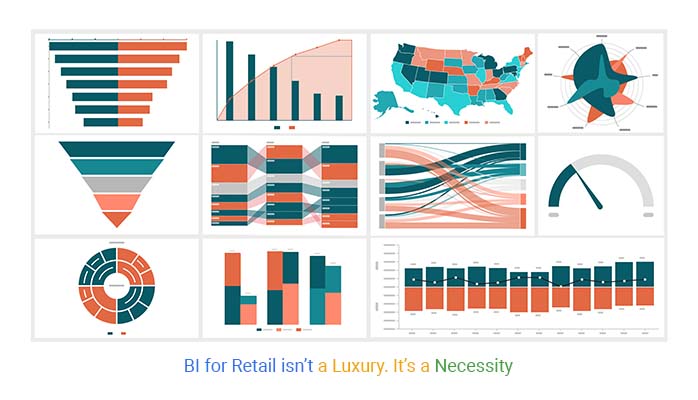
Retail moves fast. Every decision counts. Sales, inventory, and customer behavior shift constantly. How do retailers keep up? BI for retail turns raw data into insights that drive action.
Every transaction, every shopper’s choice, and every inventory move generate data. BI for Retail tracks these patterns, showing what sells, when, and why. It helps retailers set prices, stock the right products, and understand their customers.


Those who use BI for retail don’t guess—they act with precision.
Retailers using BI for retail see what’s working and what’s not. They adjust store layouts, predict demand, and track promotions in real time. Competitors without it? They rely on gut instinct. The difference is clear.
Ready to make data work for you? Keep reading.
First…
BI for retail is the process of using data analytics and business intelligence tools to analyze and manage retail data. This includes sales performance, customer behavior, inventory management, and more.
The aim is to provide retailers with detailed insights that help in making data-driven decisions, enhancing customer experiences, and improving operational efficiencies.
BI tools enable retailers to visualize complex data in an understandable format, helping to identify trends and patterns that may not be evident otherwise.
Retail business intelligence transforms vast amounts of raw data into valuable insights. Retailers collect data at every point of customer interaction, from in-store purchases to online shopping behaviors. By analyzing and interpreting this data, BI tools help retailers understand customer preferences, buying habits, and market trends.
This information is crucial for making strategic decisions such as product placements, promotions, and pricing strategies. Ultimately, retail BI turns data into a strategic asset that drives competitive advantage and business growth.
The evolution of BI in the retail industry marks a significant shift from intuition-based decisions to data-driven strategies.
In the past, retail decisions were often based on experience and gut feelings. However, with the advent of BI technologies, retailers now rely on data and analytics to guide their decisions.
This shift has led to more accurate forecasting, personalized marketing, and efficient supply chain management. As a result, retailers can better meet consumer demands and adapt quickly to market changes, ensuring sustained business success.
BI tools revolutionize product management in retail. These tools analyze sales data deeply, highlighting top-selling products. Retail managers can then prioritize these items in marketing and store placement.
Conversely, BI identifies underperforming products. This allows stores to reduce prices or discontinue items, freeing up valuable shelf space. Effective use of BI in merchandising ensures stores adapt quickly to buying trends, maximizing profits and reducing losses.
Capturing seasonal trends effectively can make or break a retail season. BI tools excel in forecasting demand based on historical sales data and market trends. They predict what products will be popular in the upcoming season.
Retailers can stock up accordingly, ensuring they meet customer demand without overstocking. This strategic stocking driven by BI minimizes unsold inventory and boosts sales during peak seasons, optimizing both customer satisfaction and profitability.
Sales per square foot is a crucial metric in retail analytics. It measures the efficiency of the retail space in generating revenue. BI tools help retailers track this metric across different store sections. This data informs layout changes and product placements, aiming to maximize sales space efficiency.
By analyzing performance variations across the store, retailers can replicate successful strategies in underperforming areas, enhancing overall store performance.
A Pareto Chart is a powerful BI tool that applies the 80-20 rule to retail inventory. This data visualization helps retailers identify the 20% of products that generate 80% of sales. Focusing on these key products can significantly improve inventory management and profitability.
Retailers can ensure these high-impact items are always in stock and optimally placed. This targeted approach to inventory management helps in allocating resources efficiently, boosting sales, and improving customer satisfaction.
Retailers can significantly boost sales by strategically arranging shelves. This strategy involves placing high-demand items at eye level. It also requires grouping related products together to increase convenience for shoppers.
Through careful placement, stores can guide customer movement and purchasing habits. This method aligns with BI insights derived from sales data, ensuring that every product is placed to maximize visibility and accessibility.
Heat maps are valuable tools in retail BI, showing where customers spend the most time. These visual representations help retailers identify hotspots within the store. By analyzing this data, stores can adjust layouts to distribute customer flow more evenly.
This reduces overcrowding and improves the shopping experience. Heat maps also reveal less trafficked areas, offering opportunities to test new product placements or promotions.
Effective product placement can trigger impulse buys and encourage cross-selling. By positioning related items near best-sellers, stores can increase the chances of additional purchases.
For instance, placing batteries next to electronic gadgets or socks near shoes can spur on-the-spot buying decisions. This strategy leverages shopper psychology, enhancing sales through convenience and suggestion.
Sankey diagrams provide a detailed look at how customers move through a store. These flow diagrams illustrate the path from entry to checkout, highlighting common routes and bottlenecks. Retailers can use this information to smooth out the shopping journey.
Strategic changes might include rearranging displays or changing signage to direct flow more efficiently. This ensures a smoother experience for customers and can lead to increased sales and customer satisfaction.
The following video will help you create a Sankey Chart in Microsoft Excel.
The following video will help you to create a Sankey Chart in Google Sheets.
The following video will help you create a Sankey Chart in Microsoft Power BI.
Personalization is key in retail. BI helps stores figure out what customers prefer and dislike. This information allows for tailored shopping experiences.
Retailers analyze purchase history and browsing data to understand preferences. If a customer frequently buys sports gear, BI tools can highlight these products for them. This makes the shopping experience smoother and more enjoyable.
Additionally, knowing what customers ignore helps retailers avoid wasted inventory. If data shows a product isn’t selling, it can be phased out. This strategy ensures that stores offer products that are likely to sell.
Customer retention is vital for retail success. High retention rates mean customers keep coming back. BI tools play a crucial role in improving these rates.
By analyzing purchase patterns and customer feedback, retailers can identify what keeps customers returning. They can also spot potential issues that might cause customers to leave.
For instance, if several customers complain about slow delivery, the retailer can work to speed up shipping times. Addressing these issues promptly helps maintain a loyal customer base.
Loyalty programs encourage repeat business. BI helps tailor these programs to match customer preferences. This customization makes the programs more effective.
For example, BI can identify a segment of customers who frequently purchase beauty products. The retailer can then offer these customers a loyalty program that rewards them for purchases in this category.
Targeted promotions are another tactic. By analyzing shopping patterns, retailers can offer promotions on products that individual customers are likely to buy. This strategy not only boosts sales but also enhances customer satisfaction.
A tree map is a visual tool used in BI to segment customers based on their behavior and purchasing patterns. This segmentation helps retailers develop focused marketing strategies.
Each segment can be targeted with specific communications and offers. For example, one segment might consist of frequent buyers who are price-sensitive. These customers might be targeted with discount offers.
Another segment might include customers who prefer premium products. For them, the retailer might focus on highlighting new arrivals or exclusive items. This approach ensures that marketing efforts are relevant and effective.
Retail BI tools are transforming how businesses evaluate their marketing strategies. By analyzing promotional data in real-time, these tools offer insights that are not just fresh but extremely actionable.
Imagine launching a promo and, within hours, evaluating its impact on sales and customer behavior. This immediate feedback allows marketers to tweak or pivot strategies quickly, maximizing promotional success.
With BI, marketers track various metrics such as customer engagement rates, conversion rates, and ROI from each campaign. This data helps identify which promotions resonate with consumers and which don’t, allowing for optimized resource allocation in future campaigns. Retailers can also detect emerging trends, adapting faster to market demands.
This method fosters a dynamic marketing environment where decisions are data-driven rather than based on hunches. The agility provided by real-time BI analysis gives retailers a significant edge in a competitive market.
The shift towards digital promotions has been significant, and BI tools are critical in optimizing ad spend in this landscape. By analyzing data across different platforms, retailers can see which channels deliver the best returns. This isn’t just about cutting costs but investing wisely to boost overall profitability.
Retail BI evaluates performance metrics such as click-through rates, engagement levels, and conversion statistics from various advertising platforms. By correlating this data with sales figures, retailers can adjust their ad spend to favor the most lucrative channels.
Furthermore, BI tools predict future trends, allowing preemptive adjustments to ad strategies.
This strategic approach to ad spending means that every dollar is used effectively, enhancing the potential for higher returns on investment.
Monitoring changes in average basket size can reveal a lot about the effectiveness of promotions. An increase in this metric often indicates that promotional strategies are compelling customers to buy more per transaction.
Retail BI tools dissect these trends, providing insights into customer purchasing behavior and the direct impact of specific promotions.
By tracking this data, retailers understand which promotions encourage higher spending and adjust their strategies to capitalize on these insights. For instance, if bundling products leads to a higher basket size, a retailer might consider increasing such offers.
This targeted approach not only boosts sales but also enhances customer satisfaction as buyers perceive they are getting better value for their money.
A multi-axis line chart is a powerful BI tool used for comparing the performance of different marketing channels over time. It illustrates how each channel contributes to overall marketing goals and helps in pinpointing the periods of high or low engagement.
By plotting data points on multiple axes, retailers view correlations and causations between different variables, such as ad spend versus sales outcomes, across various channels. This visual comparison aids in identifying the most effective channels and the best times for customer engagement.
This analytical approach ensures that marketing efforts are not just scattered but strategically aligned with observed customer behavior patterns, leading to more successful marketing outcomes.
In retail, managing inventory is paramount. BI tools track product levels in real-time. They alert managers before stockouts or overstocks occur. Imagine never facing an empty shelf or a surplus stock again. That’s the power of BI for Retail.
These tools analyze sales data, predicting how fast products will sell. They adjust inventory needs based on these predictions. This means stores can maintain ideal stock levels. It’s not magic; it’s smart data use.
Retailers using BI reduce waste and improve cash flow. They align inventory with demand, ensuring they have just what they need. This precision saves money and space. It’s like having a crystal ball for your stockroom.
Seasonal trends can make or break a retail business. BI tools use historical sales data to forecast future demand. This helps stores prepare for seasonal peaks. They can stock up on what sells and avoid what doesn’t.
Predictive analytics also identifies upcoming trends. Retailers can capitalize on these insights early on. This proactive approach keeps them ahead of the competition. It’s like having a sneak peek at the future market trends.
BI tools also adjust forecasts in real-time. They respond to sudden market changes or consumer behavior shifts. This agility ensures retailers remain relevant and competitive. It’s smart, strategic planning at its best.
Understanding Cost of Goods Sold (COGS) is vital for retail success. It represents the direct costs tied to the products sold. This metric helps retailers price their items profitably. It affects everything from pricing strategies to profit margins.
BI tools provide detailed breakdowns of COGS. They highlight areas where costs can be cut without sacrificing quality. This insight is invaluable for maintaining competitive prices.
Tracking COGS also helps in budget planning. Retailers can forecast future expenses more accurately. They make smarter financial decisions. It’s essential for a healthy bottom line.
A waterfall chart is a powerful visual in retail BI. It shows the journey of inventory from supplier to shelf. Each step’s impact on stock levels is clear. This visualization helps managers identify bottlenecks or inefficiencies in the supply chain.
Seeing inventory flow in this format simplifies complex data. Managers can spot trends and patterns quickly. They make informed decisions to streamline operations.
Improved inventory flow means better customer satisfaction. Products are available when and where they are needed. It’s an efficient, customer-focused approach to stock management.
Imagine a shopper’s journey that starts on a smartphone and ends in a shopping mall. This is where omnichannel retailing shines. It’s about creating a seamless shopping experience, regardless of the channel.
By linking in-store systems with e-commerce platforms, BI tools analyze behaviors across different touchpoints. Retailers adjust strategies in real-time, ensuring stock levels meet demand wherever the customer chooses to shop. This connection boosts customer satisfaction and sales, proving that a unified approach is essential.
Foot traffic and web traffic are two sides of the same coin. Each provides unique insights into consumer habits. BI tools track patterns in both, revealing how online campaigns influence in-store visits and vice versa.
For instance, a spike in website views after a local store event might indicate effective cross-channel marketing. Retailers use these insights to optimize both physical and digital marketing efforts, ensuring they complement rather than compete with each other.
Comparing digital sales to in-store sales offers a goldmine of insights. BI systems integrate data from both channels to give a complete picture of sales performance. This data analysis helps retailers identify trends, like which products are popular online but not selling well in physical locations. Adjustments are made quickly, aligning stock with consumer demand across all sales channels.
This unified data approach ensures no opportunity is missed, enhancing overall sales strategy.
An overlapping bar chart is more than just a visual tool; it’s a window into consumer behavior. By displaying online and offline purchases side-by-side, retailers spot patterns and anomalies.
Perhaps certain products sell well online but rarely in stores. This might suggest different customer preferences across channels. Retailers tweak marketing and stocking strategies based on these insights, tailoring approaches to fit the unique demands of online and offline customers.
This strategic use of data visualization tools helps retailers stay agile and responsive to ever-changing consumer preferences.
The conversion rate is a key metric in retail, indicating the percentage of visitors who make a purchase. BI tools shed light on factors influencing this rate. They track customer interactions from entry to exit, highlighting where customers disengage.
For example, if many customers leave after product viewing, the issue may be pricing or product information.
BI also analyzes checkout process effectiveness. A complicated checkout can deter purchases. Simplifying this process can thus boost conversion rates. Additionally, BI examines how customer service interactions affect conversions. Prompt, helpful service can convert hesitant visitors into buyers.
Understanding these factors allows retailers to refine strategies, enhancing customer experience and boosting sales.
Dynamic pricing uses BI to adjust prices based on various factors, such as demand, competition, and inventory levels. This strategy ensures prices are optimal for both sales volume and profit margins.
For instance, if a product is selling fast, prices might increase slightly to maximize profit. Conversely, if a product isn’t selling, reducing the price can prevent excess inventory.
This pricing strategy considers competitor prices, ensuring a business remains competitive. It also accounts for customer purchase patterns, adjusting prices for times when customers are more likely to buy.
This strategic pricing significantly boosts revenue by selling the right product at the right price at the right time.
Cross-selling and upselling are strategies that increase the average transaction value. BI tools identify which products are frequently bought together. This information suggests relevant products to customers during their shopping experience.
For example, if customers often buy cameras and tripods together, suggesting a tripod when a customer adds a camera to their cart can boost sales.
Upselling involves suggesting a higher-end product than what the customer is viewing. BI identifies trends in customer upgrades and can prompt sales staff to suggest pricier alternatives that meet customer needs.
These strategies not only increase revenue but also enhance customer satisfaction by making shopping more personalized and efficient.
A slope chart is a visual tool used in BI to compare sales data between two points in time. This is particularly useful in retail for assessing how sales of various products change across seasons. For example, a slope chart can display the increase in coat sales from summer to winter.
This visual analysis helps retailers identify which products perform well during certain times of the year, guiding inventory decisions. It also highlights unexpected changes in sales, prompting analysis to understand these shifts.
This could be due to external factors like economic changes or internal factors such as changes in marketing strategy.
Demand forecasting is vital in retail BI. It predicts customer demand, helping retailers stock appropriately. Accurate forecasting ensures retailers meet customer needs without overstocking. BI tools analyze historical sales data and market conditions to forecast demand.
This analysis helps retailers plan their inventory and promotions effectively. As a result, it minimizes waste and maximizes sales opportunities. Retailers who master demand forecasting can maintain the right stock levels, enhancing profitability.
Warehouse optimization is crucial for managing stock in multiple locations. BI tools provide insights into inventory levels and product movement. This data helps retailers make informed decisions about where to store goods.
Optimizing warehouse operations reduces storage costs and improves delivery times. It ensures products are available where and when customers need them. Effective warehouse management supported by BI can lead to significant savings and higher customer satisfaction.
The Supplier Scorecard is a strategic tool in retail BI. It evaluates vendors based on performance data. This scorecard helps retailers select reliable suppliers and foster strong partnerships. Criteria include delivery times, quality, cost, and reliability.
Retailers can use this data to negotiate better terms and reduce supply chain risks. Choosing the right vendors is essential for maintaining product quality and ensuring timely availability.
A Stacked Area Chart is useful for visualizing supply chain bottlenecks and inventory trends. This chart shows various data layers in a cumulative format, highlighting areas of concern.
Retailers can see which products are moving and which are stagnant. It helps identify bottlenecks that might delay delivery and affect sales. By addressing these issues, retailers can improve their supply chain efficiency. This visualization tool is a powerful part of retail BI, aiding in decision-making and strategic planning.
Abandoned carts pose a significant challenge in retail. However, BI provides a critical solution. By analyzing customer behavior data, retailers can identify the common drop-off points.
Are customers abandoning carts after seeing shipping costs? BI tools can spot these trends. Retailers can then test different strategies, like free shipping thresholds or discount codes, to see which reduces cart abandonment most effectively.
Additionally, BI can help tailor the checkout experience to different customer segments, making the process feel more personalized and less overwhelming.
Streamlining payment processes is crucial for retaining customers. BI tools analyze the steps where customers typically hesitate or abandon their purchases. This data enables retailers to simplify these processes.
For example, if data shows that customers drop off when they have to enter extensive information, retailers might introduce more straightforward payment options like digital wallets or one-click purchasing.
Also, BI can help test different payment flow designs to see which ones lead to faster and more satisfying customer experiences.
The journey doesn’t end at checkout. Post-purchase customer service is vital for customer retention. BI tools analyze customer feedback and return data to highlight areas needing improvement. If many customers complain about a particular issue, BI can help pinpoint the problem.
Retailers can then address these issues directly, improving the overall customer experience. Furthermore, BI can track the effectiveness of different customer service strategies, helping retailers refine their approach over time.
A funnel chart is an effective tool for visualizing where potential sales fall through. Each stage of the checkout process is represented, showing where the most significant drop-offs occur.
Using BI, retailers can analyze data collected at each funnel stage to understand why customers might be leaving. Is there a technical issue at the payment gateway? Or do customers feel they don’t have enough payment options?
Identifying these issues allows for targeted improvements, smoothing out the checkout process and keeping more customers on the path to purchase.
Deciding where and when to open new retail outlets is pivotal. BI tools play a crucial role in these decisions by providing data-driven insights into consumer demographics and regional sales patterns. Retailers can pinpoint lucrative markets and optimal locations for expansion.
BI analyses population density, consumer spending habits, and competitor presence to recommend the best spots for new stores. This strategic approach minimizes risks and maximizes the potential for success in new markets.
BI significantly contributes to sustainability and cost management in retail. It analyzes energy consumption, waste management, and logistic efficiencies. Retailers use these insights to adopt greener practices and reduce operational costs.
BI helps in identifying less obvious areas of waste and proposes measures to mitigate them. This not only supports sustainability but also boosts the bottom line by lowering expenses.
Using a tree map, BI tools categorize growth opportunities across different business segments. This visual representation helps retailers identify high-performing areas and potential growth sectors. It breaks down sales data by categories such as apparel, electronics, and groceries.
Retailers can see which segments are thriving and which require more attention. This targeted approach helps in allocating resources effectively, fostering growth in key areas.
Retail moves fast. Decisions shape success. Without data, choices rely on guesswork.
Every transaction, customer interaction, and inventory move generate valuable data. Without a system to track and analyze it, businesses make guesses instead of decisions.
The right tools reveal sales trends, predict demand, and show what’s working. They help retailers avoid overstocking, price products effectively, and adjust marketing strategies in real time.
Those who use BI for retail don’t react to changes—they see them coming.
Every transaction tells a story. The only question is: Are you listening?
How much did you enjoy this article?


Calculate accounts receivable turnover ratio to measure credit collection speed, improve cash flow, and strengthen your financial strategy. Read on!

Change Management KPIs are the key to tracking adoption, performance, and ROI during transitions. Find out which metrics matter. Read on!

Data collection methods and techniques determine the quality of every insight you act on. Explore key approaches for gathering reliable data. Read on!


