Categories
Comparing COGS (Cost of Goods Sold) and operating expenses, commonly referred to as ‘COGS vs operating expenses,’ is akin to comparing apples and oranges. They’re both important aspects of a business’s financials but serve different purposes.


COGS represents the direct costs of producing or acquiring the goods sold.
Operating expenses encompass all the other costs incurred in running the business.
Think of COGS as the ingredients that go into making a delicious pizza. You need the dough, the sauce, the cheese, and all the toppings. These are the direct costs that can be directly attributed to the final product.
Conversely, operating expenses cover utilities, rent, salaries, marketing expenses, and more. They keep the lights on, the employees pay, and the customers come back for more.
Which one is more important?
Well, it depends on the context. If you’re a manufacturing company, COGS takes center stage, stealing the spotlight. But if you’re a service-based business, operating expenses will be the star of the show.
Now, let’s get up close and personal with the intricate comparison of COGS vs Operating Expenses. In this detailed exploration, we’ll break down the differences between COGS (Cost of Goods Sold) and Operating Expenses, shedding light on how they stack against each other in the realm of business finances.
Here are the definitions for ‘COGS vs Operating Expenses.’
Definition: The Cost of Goods Sold (COGS) encapsulates the direct expenses of producing goods or services. Calculating COGS is fundamental for determining gross profit, as it subtracts the direct costs from total revenue.
COGS encompasses expenses like raw materials, labor, and production-related overhead, omitting indirect costs such as administrative expenses. It serves as a financial compass, guiding businesses in understanding the costs associated with their core operations. Therefore, it is crucial to assess operational efficiency and profitability and make informed pricing decisions.
Definition: Operating expenses (OPEX) are the ongoing, day-to-day costs a business incurs to maintain its regular operations. These expenses are distinct from the COGS and encompass various elements crucial for sustaining business activities. Examples of operating expenses include rent, utilities, salaries, insurance, and marketing expenses.
Monitoring operating expenses is vital for businesses to gauge operational efficiency and overall financial health. Moreover, managing operating expenses efficiently maximizes net profit and ensures sustainable business growth.
Let’s delve into the key distinctions that set apart these two essential financial metrics, exploring the nuanced aspects of COGS vs Operating Expenses. Recognizing these differences is crucial for making informed financial decisions and strategically managing business costs:
COGS represents the direct costs associated with the production or acquisition of goods/services sold by a company. It includes expenses like raw materials, labor, and production-related overhead.
Operating expenses encompass the day-to-day costs of running a business, excluding direct production costs. These include rent, utilities, salaries, insurance, and marketing expenses.
COGS is directly tied to the production of goods sold and is subtracted from revenue to calculate gross profit. It reflects the direct costs necessary to generate revenue.
Operating expenses, including considerations of marginal revenue vs marginal cost, are deducted from the gross profit to calculate operating income. These expenses represent the ongoing costs necessary to maintain regular business operations.
COGS is prominently featured in a company’s income statement. It provides a clear breakdown of the costs directly associated with producing goods or services.
Operating expenses, distinct from COGS, are also detailed in the income statement. They offer a comprehensive view of the costs incurred in day-to-day business activities.
Costs included in COGS are recognized when the goods are sold. They are directly linked to the production and sale of tangible products.
Operating expenses are recognized during the period they are incurred, irrespective of the sale of goods. They cover ongoing operational activities.
COGS directly impacts gross profit. Therefore, efficient management of COGS is crucial for maximizing gross profit margins.
On the other hand, operating expenses affect operating income. Therefore, controlling OPEX through efficient management of ongoing business costs is vital for optimizing overall profitability.
Analyzing your financial statements is a crucial step in calculating COGS (Cost of Goods Sold) and operating expenses, providing a comprehensive understanding of your business’s financial health. Here’s a step-by-step guide to navigating the complexities of COGS vs operating expenses:
Figuring out the Cost of Goods Sold (COGS) involves using the formula below;
COGS = Opening Inventory + Purchases or Production Costs – Closing Inventory
Follow these steps;
The first step is to identify all direct costs associated with producing goods or services. This includes expenses such as raw materials, direct labor, and production-related overhead.
Sum up all the direct costs identified in the first step. This total represents the overall cost of producing the goods sold during a specific period.
Add the opening inventory of finished goods from the total direct costs. This adjustment accounts for any goods that were already in inventory from the previous period.
Deduct the closing inventory of finished goods to the adjusted total from Step 3. This adjustment reflects any goods produced but not yet sold during the period.
Follow these steps to calculate your business’s operating expenses.
Identify and compile all administrative expenses accrued within a defined timeframe. Administrative expenses encompass costs associated with the management and administration of the business. Examples include salaries for administrative staff, office rent, utilities, office supplies, and other general operational expenditures.
Separate and list all selling expenses associated with the sales and marketing activities of your business. This includes costs like advertising, sales commissions, and marketing materials. It also includes any other expenses directly tied to promoting and selling products or services.
Take into account additional overhead costs that don’t fall into the categories above. This could encompass expenditures associated with research and development, depreciation, and legal fees. It also includes other miscellaneous costs essential for the business’s daily operations.
Add the expenses identified in each category to get the total operating expenses.
Operating Expenses = Administrative Expenses + Selling Expenses + Other Overhead Costs
Comparing COGS vs operating expenses involves a multifaceted examination of a company’s cost dynamics.
Cost of Goods Sold (COGS) and operating expenses (OPEX) represent distinct facets of a company’s financial structure. COGS embodies the direct costs of production, covering raw materials, labor, and production-related overhead. Conversely, OPEX encapsulates ongoing business operations costs, including rent, utilities, salaries, and marketing expenses. Understanding this distinction is foundational for evaluating a company’s cost structure.
Analyzing trends over time provides valuable insights into a company’s financial health. For COGS, trends indicate the efficiency of production cost management. Consistent increases may signal higher costs for materials or labor, impacting profit margins. Similarly, monitoring trends in OPEX unveils the overall efficiency of business operations. Sustained increases may necessitate a closer examination of operational expenditures for optimization.
Comparing COGS to industry benchmarks helps gauge a company’s efficiency in managing production costs. A lower COGS relative to industry norms can confer a competitive advantage. Likewise, benchmarking OPEX against industry standards aids in understanding how efficiently resources are utilized in non-production aspects. Variances from benchmarks highlight areas for improvement or commendable cost management practices.
Efficient management of COGS directly influences gross profit margins; lower COGS allows for a higher gross profit. On the other hand, managing OPEX effectively contributes to net profit. Striking a balance ensures that non-production costs and enhancing overall profitability do not excessively erode revenue generated. The interplay between these elements shapes the financial landscape and influences a company’s bottom line.
Budgeting is a strategic exercise integral to financial planning, especially when practicing performance-based budgeting. For COGS, accurate budgeting involves forecasting production costs, ensuring they align with profit margins and product pricing.
On the OPEX front, budgeting entails forecasting ongoing business costs such as rent, salaries, and operational expenses. A strategic budgeting approach is essential for maintaining financial stability and sustainability and aligning resources with business objectives.
Data analysis, as we all know, can be as tricky as trying to untangle a slinky. It requires a keen eye for patterns, a knack for numbers, and a lot of patience.
But fear not, for there is a shining knight in this realm of data analysis. It goes by the name of data visualization.
Yes, my friend, data visualization is the secret weapon that brings clarity to the chaos. It helps us make sense of the numbers and uncover hidden insights.
Unfortunately, while a trusty sidekick in data analysis, Excel falls short in the data visualization department. So, let me introduce you to ChartExpo. This magical tool will help you unravel the mysteries of COGS vs Operating Expenses with finesse and flair.
Let’s learn how to install ChartExpo in Excel.
ChartExpo charts are available both in Google Sheets and Microsoft Excel. Please use the following CTAs to install the tool of your choice and create beautiful visualizations with a few clicks in your favorite tool.
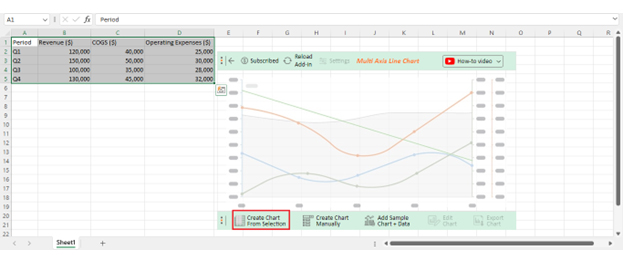
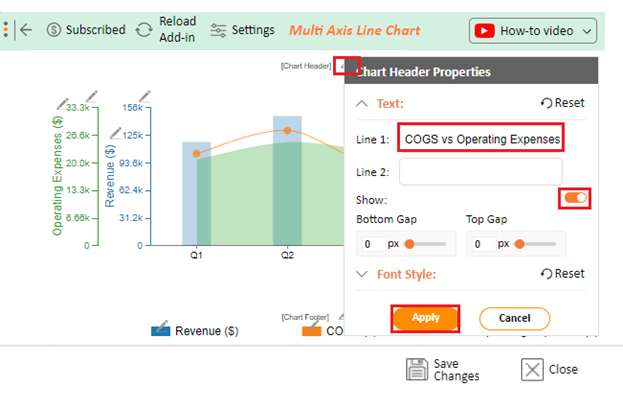
Let’s say you have the data below on Revenue, COGS vs Operating Expenses.
| Period | Revenue ($) | COGS ($) | Operating Expenses ($) |
| Q1 | 120,000 | 40,000 | 25,000 |
| Q2 | 150,000 | 50,000 | 30,000 |
| Q3 | 100,000 | 35,000 | 28,000 |
| Q4 | 130,000 | 45,000 | 32,000 |
Follow these steps to visualize this data with ChartExpo and glean COGS vs Operating Expenses insights.


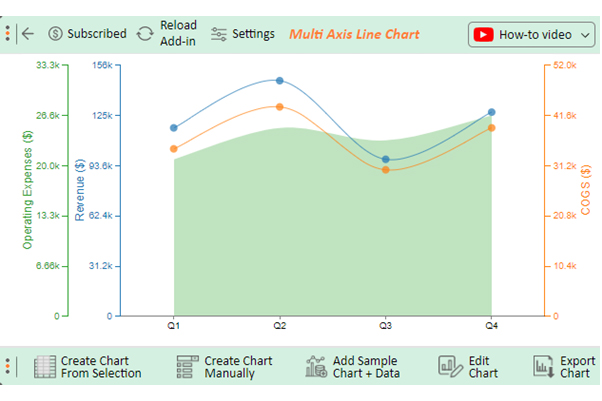


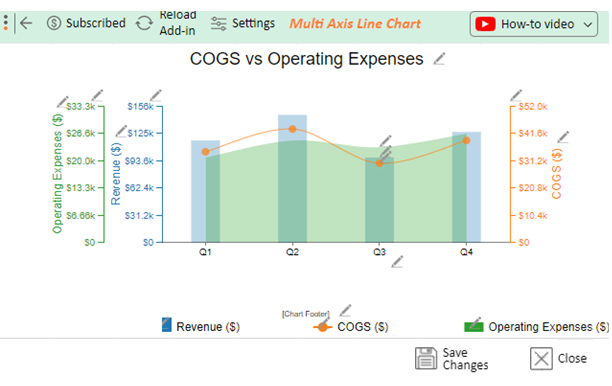
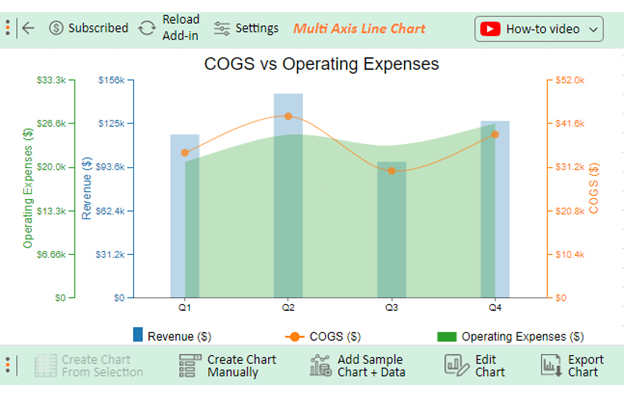
Over the year, revenue reached its zenith in Q2, totaling $150,000. Nevertheless, an increase in operating expenses had a consequential effect on profitability. Q3 displayed a decline in revenue and expenses, hinting at potential seasonality. Adept cost management is imperative to ensure sustained profitability.
No, COGS (Cost of Goods Sold) and operating income differ. COGS represents direct production costs, whereas operating income is the difference between gross profit and operating expenses. Moreover, COGS influences gross profit, while operating income reflects overall profitability after considering all operational costs.
The formula for COGS with operating expenses is Total Operating Costs = COGS + Operating Expenses. This formula encompasses all direct and indirect costs of a company’s operations.
COGS (Cost of Goods Sold) represents direct production costs, including materials and labor. On the other hand, operating expenses cover ongoing business costs such as rent and salaries. The key distinction lies in COGS’s direct link to production while operating expenses encompass broader operational expenditures.
Understanding the intricacies of Cost of Goods Sold (COGS) and operating expenses is fundamental for comprehensive financial analysis. Focusing on direct production costs, COGS serves as a barometer for operational efficiency in goods creation. Conversely, operating expenses cast a wider net, encapsulating the broader operational facets of a business.
Examining trends over time unveils the financial health of these components, providing a roadmap for adaptability and optimization.
Moreover, benchmarking against industry standards helps gauge production and broader operational competitiveness. The impact on profitability underscores the significance of managing COGS for gross profit margins. And operating expenses for net profitability.
Strategic budgeting and planning are crucial in aligning resources with business objectives. It doesn’t matter whether you want to forecast production costs with precision or manage ongoing operational expenditures. A thoughtful approach ensures financial stability and sustainability.
This holistic comparison empowers you to make informed financial decisions, optimize resource allocation, and enhance financial performance.
ChartExpo emerges as a valuable ally in comparing COGS vs operating expenses. Its diverse visualizations offer a dynamic lens to scrutinize these critical components.
Do not hesitate
Embrace ChartExpo today to get into the heart of financial analysis and illuminate the path to business success.
How much did you enjoy this article?


Calculate accounts receivable turnover ratio to measure credit collection speed, improve cash flow, and strengthen your financial strategy. Read on!

Change Management KPIs are the key to tracking adoption, performance, and ROI during transitions. Find out which metrics matter. Read on!

Data collection methods and techniques determine the quality of every insight you act on. Explore key approaches for gathering reliable data. Read on!


