• Home
  • Tools dropdown img
    • Spreadsheet Charts

      • ChartExpo for Google Sheets
      • ChartExpo for Microsoft Excel
    • Power BI Charts

      • Power BI Custom Visuals by ChartExpo
    • Word Cloud

  • Charts dropdown img
    • Chart Category

      • Bar Charts
      • Circle Graphs
      • Column Charts
      • Combo Charts
      • Comparison Charts
      • Line Graphs
      • PPC Charts
      • Sentiment Analysis Charts
      • Survey Charts
    • Chart Type

      • Box and Whisker Plot
      • Clustered Bar Chart
      • Clustered Column Chart
      • Comparison Bar Chart
      • Control Chart
      • CSAT Survey Bar Chart
      • CSAT Survey Chart
      • Dot Plot Chart
      • Double Bar Graph
      • Funnel Chart
      • Gauge Chart
      • Likert Scale Chart
      • Matrix Chart
      • Multi Axis Line Chart
      • Overlapping Bar Chart
      • Pareto Chart
      • Radar Chart
      • Radial Bar Chart
      • Sankey Diagram
      • Scatter Plot Chart
      • Slope Chart
      • Sunburst Chart
      • Tornado Chart
      • Waterfall Chart
      • Word Cloud
    • Google Sheets
      Microsoft Excel
  • Services
  • Pricing
  • Contact us
  • Blog
  • Support dropdown img
      • Gallery
      • Videos
      • Contact us
      • FAQs
      • Resources
    • Please feel free to contact us

      atsupport@chartexpo.com

Categories
All Data Visualizations Data Analytics Surveys
Add-ons/
  • Google Sheets
  • Microsoft Excel
  • Power BI
All Data Visualizations Data Analytics Surveys
Add-ons
  • Google Sheets
  • Microsoft Excel
  • Power BI

We use cookies

This website uses cookies to provide better user experience and user's session management.
By continuing visiting this website you consent the use of these cookies.

Ok

ChartExpo Survey


Home > Blog > Microsoft Excel

Gross Profit vs. Net Income Definition, Difference, & Uses

Gross profit vs net income encapsulates the financial dichotomy crucial for evaluating a company’s economic health.

Gross profit and net income are common terms in the world of finance. They may sound similar, but they have some hidden truths within.

Gross Profit vs. Net Income

Comparing them is like comparing apples and oranges – fruits with distinct flavors. So, let’s peel back the layers and take a closer look.

Gross profit is like the money you make before Uncle Sam takes his hefty cut. It’s the revenue generated from sales minus the cost of goods sold. Think of it as the raw, unfiltered cash flow that you can flaunt before deductions come knocking.

Net income is the final number after all the expenses have had their way with your profits. It’s the money left in your pocket after taxes, operating expenses, and other financial obligations.

Gross profit gives you a rough estimate of how well your business is performing. In contrast, net income shows you the true picture after all the expenses have been accounted for.

This is just the tip of the iceberg. Join me – let’s unravel this mystery together.

Table of Contents:

  1. Gross Profit vs. Net Income: Overview
    1. What is Gross Profit?
    2. What is Net Income?
  2. Users of Gross Profit vs. Net Income
  3. How to Calculate: Gross Profit vs. Net Income
  4. Difference Between Gross Profit And Net Income
  5. Gross Profit vs. Net Income Example
  6. How to Evaluate Gross Profit vs Net Income Data?
  7. How to Use Gross Profit and Net Income to Make Business Decisions?
  8. Limitations of Gross Profit and Net Income
  9. Wrap Up

Gross Profit vs. Net Income: Overview

What is Gross Profit?

Definition: Gross profit is the profit a company makes after deducting the costs of making and selling its products. It’s like the first slice of a delicious cake – the initial reward for a successful sale. It is calculated by subtracting the cost of goods sold from the revenue or sales. It does not include fixed costs and should not be confused with net profit or net income.

What is Net Income?

Definition: Net income, also known as net profit or net earnings, is the revenue that exceeds expenses. It’s like the cherry on top of your company’s financial cake, indicating the true profitability of its operations. This metric allows investors and business owners to gauge the success and viability of a venture. It is the ultimate measure of financial success, the golden nugget that signifies a job well done.

Users of Gross Profit vs. Net Income

Users of Gross Profit:

  1. Management: To assess the efficiency of production and pricing strategies.
  2. Investors: To understand the company’s ability to produce goods profitably, excluding other expenses.
  3. Creditors: To evaluate the company’s ability to manage direct costs and potentially repay loans.
  4. Analysts: To compare the profitability of companies within the same industry by focusing on core operations.
  5. Operations Team: To identify areas for cost reduction and improvement in production processes.

Users of Net Income:

  1. Shareholders/Investors: To assess the overall profitability and return on their investment.
  2. Management: To gauge the company’s financial health and overall performance, including non-operating aspects.
  3. Creditors/Lenders: To determine the company’s ability to meet all financial obligations and service debt.
  4. Analysts: To evaluate the company’s financial stability and profitability in the context of its complete financial performance.

How to Calculate: Gross Profit vs. Net Income

How to Calculate Net Income?

To calculate net income, follow these steps:

  1. Start with Total Revenue: This includes all income earned from sales, services, and other sources.
  2. Subtract Cost of Goods Sold (COGS): Deduct the costs directly associated with producing the goods or services sold.
  3. Subtract Operating Expenses: Deduct expenses related to running the business, such as salaries, rent, and utilities.
  4. Subtract Interest Expenses: Deduct any interest paid on loans or other debt.
  5. Subtract Taxes: Deduct income taxes owed based on the company’s taxable income.
  6. Add Other Income (if applicable): Include any additional income not part of the core business operations.

Net Income Formula:

Net Income=Total Revenue-COGS-Operating Expenses-Interest Expenses-Taxes+Other Income

How to Calculate Gross Profit?

To calculate gross profit, follow these steps:

  1. Determine Total Revenue: This is the total amount earned from sales of goods or services.
  2. Subtract Cost of Goods Sold (COGS): This includes all direct costs associated with producing the goods or services sold.

Gross Profit Formula:

Gross Profit=Total Revenue-COGS

Difference Between Gross Profit And Net Income

Let’s dive into the depths of profitability analysis with the net income vs. gross profit showdown.

  • Understand the Definitions

To kick things off, let’s unravel the meanings behind these intriguing terms. Gross profit is the profit left over after deducting production costs from revenue. On the other hand, net income represents the profit remaining after subtracting all expenses from revenue.

  • Calculate Both Figures

Now that we know the basics – let’s crunch some numbers. To calculate gross profit, subtract the cost of goods sold from revenue. For net income, deduct all expenses from the revenue.

  • Analyze Gross Profit

Gross profit provides insights into the company’s profit from producing and selling goods. It focuses on variable costs and helps investors gauge the effectiveness of a company’s production processes. A high gross profit indicates effective cost management and pricing strategies and vice versa.

  • Examine Net Income

This metric reflects overall profitability and the company’s ability to manage expenses. It encompasses all costs and expenses, painting a comprehensive picture of a company’s financial health.

  • Assess Variations

Now, let’s dig deeper and explore any variations between gross profit vs net income. Discrepancies between these figures can reveal the impact of fixed costs, such as rent and salaries, on profitability. Understanding the nuances of gross profit vs net income is akin to discovering hidden plot twists in the financial narrative. These variations provide valuable insights for investors, stakeholders, and financial analysts, offering a closer look at how fixed costs influence the overall financial health of a company.

  • Consider Factors Impacting the Difference

The plot thickens when delving into the intricacies of gross profit vs net income, as various factors can significantly influence the difference between these financial metrics. Considerations such as inventory valuation methods, depreciation, and even changes in tax laws add complexity to the narrative, shaping the financial landscape of a company. Understanding how these elements interplay is crucial for investors, stakeholders, and financial analysts navigating the complexities of financial data.

  • Compare Industry and Peer Benchmarks

Every story needs a benchmark, right? Compare your company’s gross profit and net income with industry and peer standards. This will reveal if your company is a financial superstar or a mere supporting character.

  • Assess Investment and Financial Health

Gross profit vs. net income is a pivotal comparison that aids in assessing the investment potential and financial health of a company. Investors, stakeholders, and financial analysts rely on the insights provided by these key metrics to make informed decisions regarding investments, acquisitions, or partnerships.

By analyzing the return on investment capital alongside gross profit, they can gain a deeper understanding of how efficiently a company utilizes its resources to generate profits. Gross profit, indicative of operational efficiency, reveals revenue left after subtracting the cost of goods sold.

  • Understand Tax Implications

Gross profit vs net income introduces an additional layer of complexity when considering the tax implications for your company. It’s essential to understand how tax laws and regulations can significantly impact these financial metrics, potentially altering your company’s overall financial outlook. Navigating the intricate landscape of taxation with confidence requires a keen understanding of how gross profit and net income interact with regulatory frameworks.

Gross Profit vs. Net Income Example

Company A:

  • Total Revenue: $500,000
  • Cost of Goods Sold (COGS): $200,000
  • Operating Expenses: $150,000
  • Interest Expenses: $20,000
  • Taxes: $30,000

Gross Profit:

Gross Profit=Total Revenue-COGS

Gross Profit=$500,000-$200,000=$300,000

Net Income:

Net Income=Gross Profit-Operating Expenses-Interest Expenses-Taxes

Net Income=$300,000-$150,000-$20,000-$30,000=$100,000

How to Evaluate Gross Profit vs Net Income Data?

Data visualization is the superhero of data analysis, allowing us to unravel complex information with a single glance. But alas, even Excel, the mighty spreadsheet warrior, falls short in its visualization prowess.

Fear not, for there is a savior in the form of ChartExpo. ChartExpo’s visualizations and ease of use make analyzing gross profit vs net income data in Excel a breeze. It transforms it into a visual feast that even the most number-phobic can appreciate.

Benefits of Using ChartExpo

  • ChartExpo serves up a buffet of visualizations, ensuring you pick the perfect dish for your data. Say goodbye to data drudgery; with ChartExpo, analysis, and presentation become a symphony of effectiveness.
  • Wave goodbye to the days of data visualization sorcery. ChartExpo’s user-friendly interface lets you whip up captivating charts effortlessly. No coding skills are required – it’s data magic made simple.
  • ChartExpo isn’t just a one-size-fits-all outfit; it’s your data couturier. You can customize your visuals with colors, fonts, and styles to make them uniquely yours.
  • When it comes to bang for your buck, ChartExpo’s got it. It has a free 7-day trial and a $10 monthly plan. It’s like getting the Mona Lisa for the price of a latte.

How to Install ChartExpo in Excel?

  1. Open your Excel application.
  2. Open the worksheet and click the “Insert” menu.
  3. You’ll see the “My Apps” option.
  4. In the office Add-ins window, click “Store” and search for ChartExpo on my Apps Store.
  5. Click the “Add” button to install ChartExpo in your Excel.

ChartExpo charts are available both in Google Sheets and Microsoft Excel. Please use the following CTA’s to install the tool of your choice and create beautiful visualizations in a few clicks in your favorite tool.

Example

The data below is on month-over-month metrics for Total Revenue, Gross Profit, Expenses, and Net Income.

Month Total revenue ($) Gross Profit ($) Expenses ($) Net income ($)
Jan 50,000 20,000              8,000                12,000
Feb 52,000 22,000              9,800                12,200
Mar 55,000 24,000           12,000                12,000
Apr 53,000 21,000           11,500                   9,500
May 57,000 26,000           11,000                15,000
Jun 60,000 28,000           12,000                16,000
Jul 58,000 27,000           15,000                12,000
Aug 61,000 29,000           13,000                16,000
Sep 63,000 30,000           13,500                16,500
Oct 65,000 32,000           14,000                18,000
Nov 67,000 34,000           15,000                19,000
Dec 70,000 36,000           16,500                19,500

Let’s create a visualization of this data with ChartExpo to help us glean insights.

  • To get started with ChartExpo, install ChartExpo in Excel.
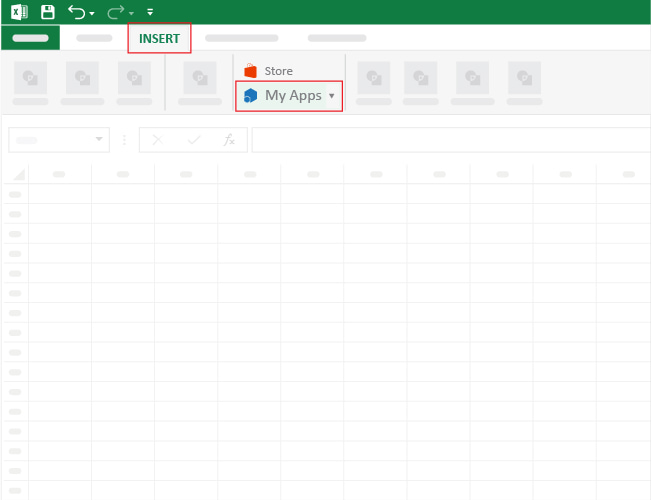
  • Now Click on My Apps from the INSERT menu.
insert chartexpo in excel
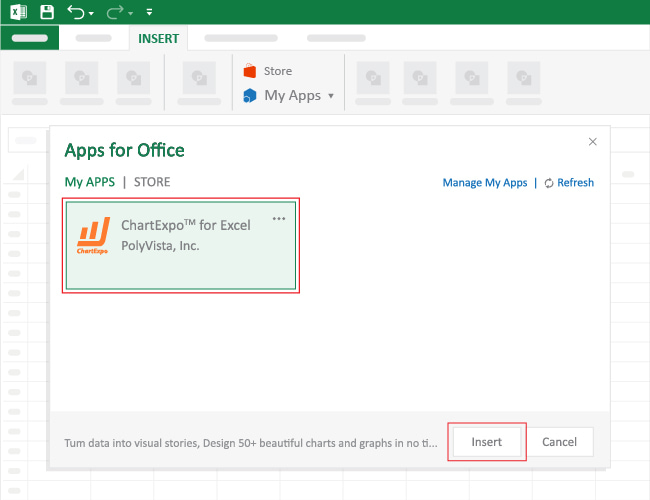
  • Choose ChartExpo from My Apps, then click Insert.
open chartexpo in excel
  • Once it loads, scroll through the charts list to locate and choose the “Multi-Axis Line Chart”.
search multi axis line chart in excel
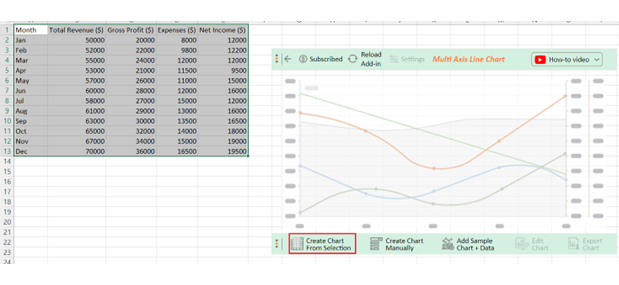
  • Click the “Create Chart From Selection” button after selecting the data from the sheet, as shown.
Create Chart From Selection ce466
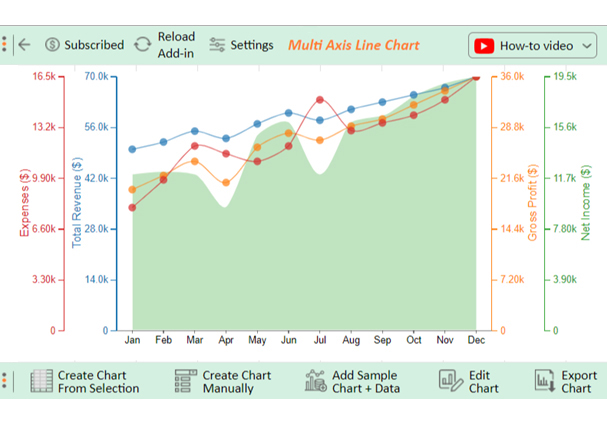
  • ChartExpo will generate the visualization below for you.
Gross Profit vs. Net Income Design Template
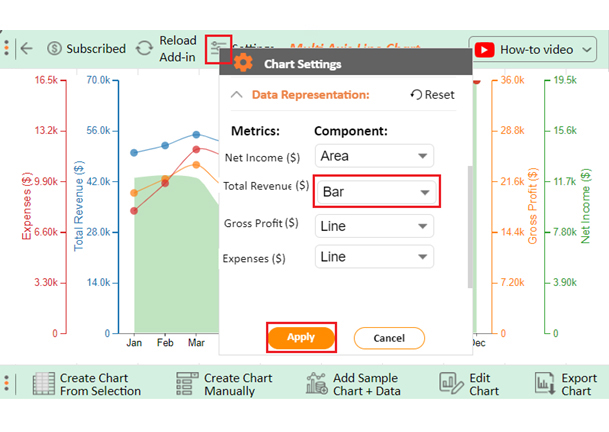
  • Click on Settings and change the “Data Representation” of Total Revenue into Bar as follows.
Apply bar on Chart ce466
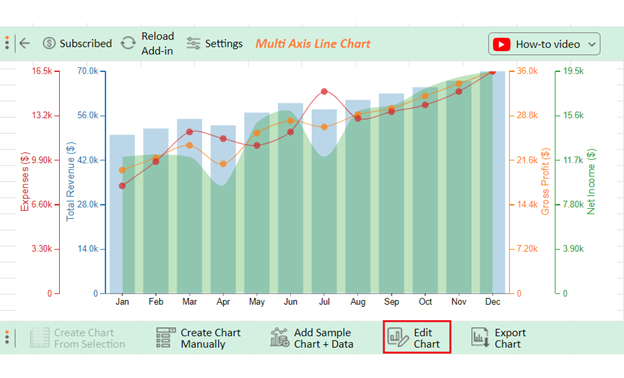
  • If you want to have the chart’s title, click Edit Chart, as shown in the image below.
Edit Chart For Title ce466
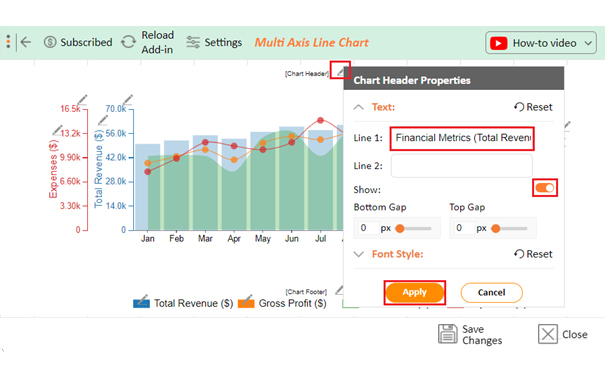
  • Click the pencil icon next to the Chart Header to change the title.
  • It will open the properties dialog. Under the Text section, you can add a heading in Line 1 and enable Show.
  • Give the appropriate title of your chart and click the Apply button.
Apply Tittle on Chart ce466
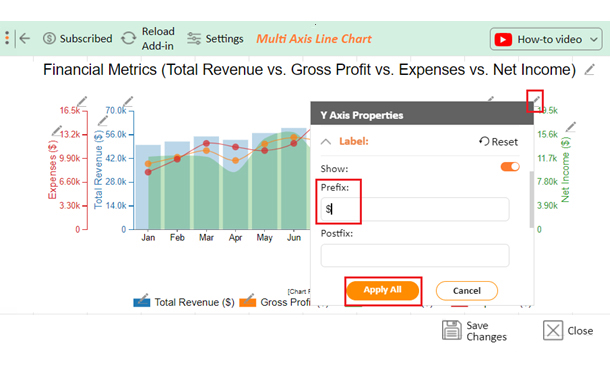
  • Let’s add the Prefix (e.g., $ sign) with the “Net Income”.
  • Click the highlighted pencil icon. Expand the “Label” properties to add the Prefix value (e.g., $ sign).
Add Prefix Value With Net Incom ce466
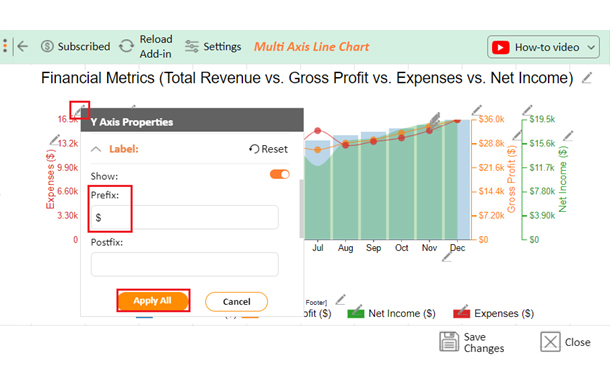
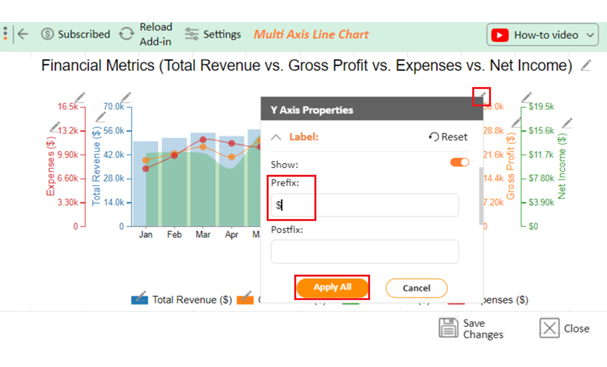
  • Let’s add the $ sign with the “Gross Profit” values.
  • Click the highlighted pencil icon. Expand the “Label” properties to add the Prefix value ($ sign).
Add Prefix Value With Gross Profit ce466
  • Let’s dd the Dollar ($) sign with “Expenses” values.
  • Click the highlighted pencil icon. Expand the “Label” properties to add the Prefix value ($ sign).
Add Prefix Value With Expenses ce466
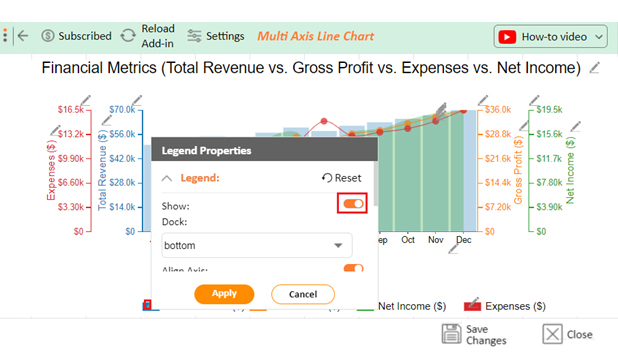
  • Enable the show button of Legend.
Enable Show Button of Lengend ce466
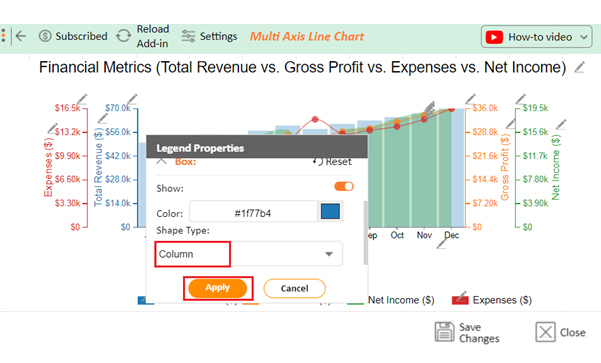
  • Change the Legend shape of Total Revenue into a column and click the “Apply” button.
Apply The Lengend Shape ce466
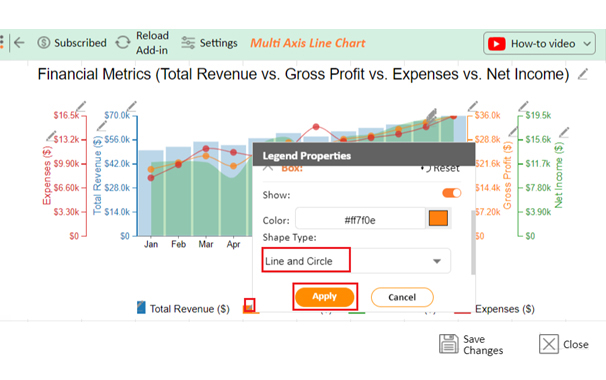
  • Change the Legend shape of Gross Profit to Line and Circle and click the “Apply” button.
Change The Legend Shape ce466
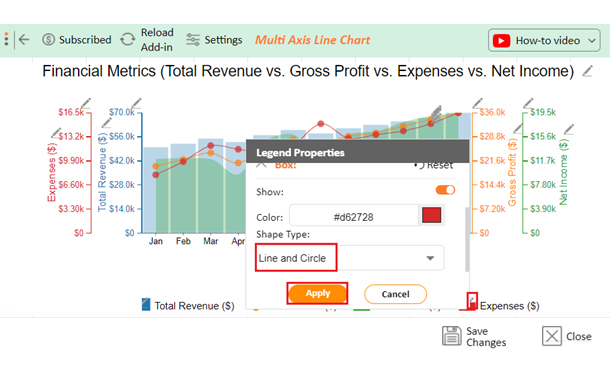
  • Change the Legend shape of Expenses into Line and Circle and click the “Apply” button.
Apply Change The Legend Shape ce466
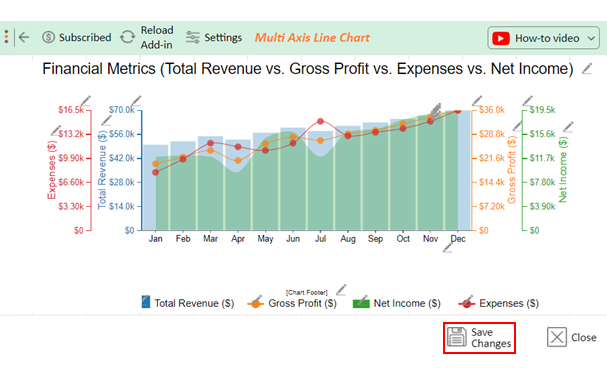
  • Click the “Save Changes” button to persist the changes made to the chart.
Save Changes on Chart ce466
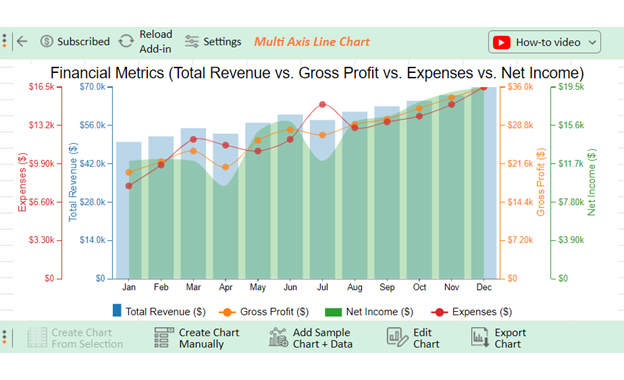
  • Your final chart will look like the one below.
Final Gross Profit vs. Net Income

Insights

  • The company witnessed steady growth in its revenue throughout the past year. The total revenue was $70,000 in December, signifying a $20,000 upswing from January.
  • The gross profit shows an upward trajectory, albeit at a slower pace compared to the total revenue. This suggests an uptick in the company’s expenses.
  • The expenses increased from $8,000 to $16,500.
  • Although net income has been rising, it hasn’t matched the pace of gross profit growth. This suggests a decline in the company’s profit margin.

How to Use Gross Profit and Net Income to Make Business Decisions?

How can these mystical figures aid us in our quest for business success?

Let’s find out:

  • Assessing cost efficiency: Analyzing your gross profit and net income, you can identify areas where costs are eating away at your profits. This empowers you to take action and optimize your operations, ensuring every penny counts.
  • Pricing strategies: Pricing your products or services can feel like a high-stakes poker game. Luckily, gross profit vs net income is your aces up your sleeve. They help find that sweet spot where prices maximize revenue while leaving you with a handsome profit. Understanding the dynamics between gross profit and net income is akin to holding a winning hand in the business strategy game.
  • Identifying profit centers: Ever wondered which of your business units is the MVP? Gross profit vs net income can reveal the profit-generating superstars and those underperforming duds. This dynamic comparison serves as a powerful tool for identifying the financial champions within your organization, guiding strategic decisions like allocating resources and focusing on high-return areas.
  • Operational efficiency: Efficiency isn’t just a buzzword; it’s the key to financial success. Are you squeezing every last drop of value out of your resources? Or are they slipping through your fingers like sand? Gross profit will reveal it all.
  • Investment decisions: Gross profit vs net income can guide your decisions. They’ll help you figure out if you can afford that new equipment. Or if it’s time to tighten the purse strings. Understanding the interplay between gross profit vs net income is instrumental in making sound financial decisions for your business. These metrics act as financial compasses, providing insights into your company’s profitability and overall financial health.
  • Budgeting and financial planning: Budgeting and financial planning become a breeze with gross profit vs. net income at your disposal. These figures serve as your guiding light, helping you set realistic financial goals and allocate resources effectively. Understanding the interplay between gross profit and net income is paramount for creating a robust budget that aligns with your business objectives. For instance, planning a monthly budget in Excel can greatly enhance your ability to manage expenses and track financial performance. These metrics provide clarity on revenue generation, expense management, and overall financial health, enabling you to make informed decisions in resource allocation.
  • Tax planning: Net income is your secret weapon for outsmarting the taxman. Knowing how expenses affect your taxable income will help to optimize your tax strategy. Consequently, keep Uncle Sam’s hand out of your cookie jar.
  • Debt management: Debt management becomes less daunting with gross profit and net income data. You can assess your ability to service debt and make informed decisions about borrowing and repayment.
  • Dividend distribution: Shareholders love dividends, but can your business afford to pay them? Gross profit and net income will tell you if it’s time to make it rain on your investors. Or if you need to tighten the purse strings once more.
  • Performance evaluation: Gross profit vs net income serves as the mirror that reveals your company’s financial reflection. Use them to judge how well your business is performing and make the necessary adjustments. These financial metrics offer a clear reflection of your company’s profitability and financial health. Assessing the dynamic interplay between gross profit and net income allows you to gauge the effectiveness of your business operations.
  • Cost control: Nobody likes a runaway expense train. To keep those costs in check, seek the help of gross profit and net income. They’ll show you where you’re hemorrhaging money and help you plug the leaks.
  • Strategic planning: Gross profit vs net income figures provide valuable insights into your business’s financial landscape. Use them to chart a course for growth, identify new opportunities, and navigate the competitive waters with confidence. The comparison between gross profit and net income is instrumental in understanding the nuances of your business’s revenue generation and overall profitability. These metrics act as navigational tools, guiding strategic decisions for expansion or optimization.
  • Mergers and acquisitions: Net income determines the value of your ship in the market. It influences pricing, negotiations, and the grand strategy behind the scenes.

Limitations of Gross Profit and Net Income

Limitations of Gross Profit:

  1. Does Not Account for Operating Expenses: Gross profit excludes operating expenses such as salaries, rent, and utilities, which can be substantial and impact overall profitability.
  2. Ignores Non-Operating Costs: It does not consider interest expenses, taxes, or other non-operating costs that affect the bottom line.
  3. Limited Insight into Financial Health: Gross profit focuses solely on production efficiency and cost of goods sold, offering a partial view of financial health.
  4. Does Not Reflect Profitability Trends: It does not account for changes in operating expenses or revenue trends over time.
  5. Not Useful for Comparative Analysis: Gross profit alone may not be sufficient for comparing companies with different expense structures or financing arrangements.

Limitations of Net Income:

  1. Can Be Affected by Non-Recurring Items: Net income can be influenced by one-time gains or losses, which may not reflect the company’s ongoing performance.
  2. Includes Non-Operating Costs: It accounts for all expenses, including interest and taxes, which might obscure the performance of core business operations.
  3. Subject to Accounting Methods: Variations in accounting methods and estimates (e.g., depreciation, amortization) can affect net income comparability.
  4. Does Not Reflect Cash Flow: Net income does not account for cash flow variations, such as changes in working capital or capital expenditures, which can impact liquidity.
  5. Limited Insight into Operational Efficiency: It includes all expenses, making it harder to assess how efficiently the company is managing its core operations.

FAQs

How do you calculate gross profit from net income?

To calculate gross profit from net income, reverse the process. Add all expenses, including taxes, interest, and operating costs, to the net income figure. This leaves you with gross profit, the initial revenue before deductions.

What is the difference between gross profit vs. net profit?

Gross profit is revenue minus the cost of goods sold (COGS), reflecting core operational profitability. Net profit accounts for all expenses, including taxes, interest, and operating costs, revealing a company’s ultimate financial success.

Wrap Up

We’ve journeyed through the financial wonderland, unraveling the enchanting gross profit vs net income tale.

Gross profit, like the first rays of sunlight, unveils a company’s raw, untamed earning power. It exposes the profits left after the dust settles on the cost of production. It’s the foundation, the bedrock, the essential core of a company’s financial story.

On the other hand, Net income is the final chapter, the climax, the heart-pounding crescendo. It considers the full range of financial sorcery, including taxes, interest, operating expenses, etc. As a result, it showcases the company’s ultimate financial success or woe.

These variations, whether due to operating expenses, interest payments, or taxes, provide valuable insights for decision-making. Net income, in particular, plays a pivotal role in investment decision-making, assessing financial health, and guiding tax planning.

But the adventure doesn’t stop there. These metrics are essential navigational tools for budgeting, cost control, strategic planning, and even influencing M&A deals. They are the beacons of financial direction, offering guidance in a world filled with fiscal mysteries.

Use this knowledge wisely and leverage the prowess of ChartExpo in data visualization. Ultimately, your quest for financial success will be filled with confidence and flair.

How much did you enjoy this article?

ExcelAd1
Start Free Trial!
130833

Related articles

next previous
Microsoft Excel8 min read

Excel Task Tracker Template for Smarter Task Insights

Task tracker template in Excel organizes tasks, tracks deadlines, and boosts efficiency. Learn its benefits, and explore expert tips to simplify task management.

Microsoft Excel10 min read

Invoice Tracker Template in Excel for Better Insights

An invoice tracker Excel template helps track invoices, due dates, and payments. Learn how to use this template for better financial management.

Microsoft Excel12 min read

Key Performance Indicators in Healthcare for Better Insights

Key Performance Indicators in healthcare track patient care and efficiency. Learn about these KPIs, top examples, and how to use them to improve outcomes.

Microsoft Excel10 min read

BMI Calculation Formula in Excel for Better Fitness Insights

The BMI calculation formula in Excel helps track and analyze body mass index. Explore step-by-step instructions and tips to simplify BMI tracking in Excel.

Microsoft Excel29 min read

How to Create a Tornado Chart in Excel? A Complete Guide

Click to learn how to plot a Tornado Chart in Excel using easy-to-follow steps. Also, we’ll address the following question: what is a Tornado Diagram?

ChartExpo logo

Turn Data into Visual
Stories

CHARTEXPO

  • Home
  • Gallery
  • Videos
  • Services
  • Pricing
  • Contact us
  • FAQs
  • Privacy policy
  • Terms of Service
  • Sitemap

TOOLS

  • ChartExpo for Google Sheets
  • ChartExpo for Microsoft Excel
  • Power BI Custom Visuals by ChartExpo
  • Word Cloud

CATEGORIES

  • Bar Charts
  • Circle Graphs
  • Column Charts
  • Combo Charts
  • Comparison Charts
  • Line Graphs
  • PPC Charts
  • Sentiment Analysis Charts
  • Survey Charts

TOP CHARTS

  • Sankey Diagram
  • Likert Scale Chart
  • Comparison Bar Chart
  • Pareto Chart
  • Funnel Chart
  • Gauge Chart
  • Radar Chart
  • Radial Bar Chart
  • Sunburst Chart
  • see more
  • Scatter Plot Chart
  • CSAT Survey Bar Chart
  • CSAT Survey Chart
  • Dot Plot Chart
  • Double Bar Graph
  • Matrix Chart
  • Multi Axis Line Chart
  • Overlapping Bar Chart
  • Control Chart
  • Slope Chart
  • Clustered Bar Chart
  • Clustered Column Chart
  • Box and Whisker Plot
  • Tornado Chart
  • Waterfall Chart
  • Word Cloud
  • see less

RESOURCES

  • Blog
  • Resources
  • YouTube
SIGN UP FOR UPDATES

We wouldn't dream of spamming you or selling your info.

© 2025 ChartExpo, all rights reserved.