• Home
  • Tools dropdown img
    • Spreadsheet Charts

      • ChartExpo for Google Sheets
      • ChartExpo for Microsoft Excel
    • Power BI Charts

      • Power BI Custom Visuals by ChartExpo
    • Word Cloud

  • Charts dropdown img
    • Chart Category

      • Bar Charts
      • Circle Graphs
      • Column Charts
      • Combo Charts
      • Comparison Charts
      • Line Graphs
      • PPC Charts
      • Sentiment Analysis Charts
      • Survey Charts
    • Chart Type

      • Box and Whisker Plot
      • Clustered Bar Chart
      • Clustered Column Chart
      • Comparison Bar Chart
      • Control Chart
      • CSAT Survey Bar Chart
      • CSAT Survey Chart
      • Dot Plot Chart
      • Double Bar Graph
      • Funnel Chart
      • Gauge Chart
      • Likert Scale Chart
      • Matrix Chart
      • Multi Axis Line Chart
      • Overlapping Bar Chart
      • Pareto Chart
      • Radar Chart
      • Radial Bar Chart
      • Sankey Diagram
      • Scatter Plot Chart
      • Slope Chart
      • Sunburst Chart
      • Tornado Chart
      • Waterfall Chart
      • Word Cloud
    • Google Sheets
      Microsoft Excel
  • Services
  • Pricing
  • Contact us
  • Blog
  • Support dropdown img
      • Gallery
      • Videos
      • Contact us
      • FAQs
      • Resources
    • Please feel free to contact us

      atsupport@chartexpo.com

Categories
All Data Visualizations Data Analytics Surveys
Add-ons/
  • Google Sheets
  • Microsoft Excel
  • Power BI
All Data Visualizations Data Analytics Surveys
Add-ons
  • Google Sheets
  • Microsoft Excel
  • Power BI

We use cookies

This website uses cookies to provide better user experience and user's session management.
By continuing visiting this website you consent the use of these cookies.

Ok

ChartExpo Survey


Home > Blog > Data Analytics

Operating Income vs. Net Income : Analysis & Differences

Are you tired of scratching your head over operating income vs. net income?

Spreadsheet is here to your rescue. Its powerful formulas, functions, and visualization capabilities will help you analyze these financial figures effortlessly.

Operating Income vs Net Income

But before we dive into the spreadsheets, let me summarize it in simple terms.

Operating income signifies a company’s earnings from its fundamental operations. It’s like the star of the show, highlighting the company’s revenue generation and expense management prowess.

In contrast, net income represents what remains after deducting all expenses, including taxes, interest, and non-operating elements. It’s like the cherry on top, offering insight into the company’s overall profitability.

Now, here comes the fun part. Comparing operating vs. net income will uncover valuable insights about a company’s financial health. You can identify trends, assess profitability, and make informed decisions.

Table of Contents:

  1. What is Operating Income?
  2. Operating Income Example
  3. Operating Income Formula
  4. How to Calculate Operating Income?
  5. What is Net Income?
  6. Net Income Example
  7. Net Income Formula
  8. How to Calculate Net Income?
  9. Operating Income vs. Net Income: Key Differences
  10. Operating Income vs. Net Income: Comparison
  11. How to Evaluate the Results of Operating Income vs. Net Income?
  12. How To Manage Operating Income And Net Income?
  13. Wrap Up

So, let’s crunch those numbers and unravel the mysteries of operating income vs. net income.

Video Tutorials:

Operating Income vs. Net Income in Excel

Operating Income vs. Net Income in Google Sheets

What is Operating Income?

Definition: Operating income, also known as operating profit, mirrors a company’s earnings from core business activities. It is calculated by deducting operating expenses like wages and rent from gross income.

It excludes interest and taxes, focusing solely on operational efficiency. This metric aids in assessing a company’s ability to generate profit through its fundamental operations. Thus, it is a pivotal indicator of financial health and efficiency.

Operating Income Example

Company XYZ reports the following figures for the fiscal year:

  • Total Sales Revenue: $850,000
  • Cost of Goods Sold (COGS): $500,000
  • Operating Expenses: $150,000 (includes costs like marketing, salaries, and utilities)

Operating Income Formula

Operating Income=Total Revenueˆ’Cost of Goods Sold (COGS)ˆ’Operating Expenses

Where:

  • Total Revenue is the total amount earned from sales.
  • Cost of Goods Sold (COGS) is the direct cost of producing goods or services sold.
  • Operating Expenses include costs related to running the business, such as salaries, rent, and utilities.

How to Calculate Operating Income?

Determine Gross Profit

Formula:

Gross Profit=Total Revenue – Cost of Goods Sold (COGS)

Example: If Total Revenue is $500,000 and COGS is $300,000:

Gross Profit=$500,000-$300,000=$200,000

Subtract Operating Expenses

Formula:

Operating Income=Gross Profit-Operating Expenses

Example: If Operating Expenses are $100,000:

Operating Income=$200,000-$100,000=$100,000

Summary

  • Operating Income: The resulting figure represents the profit earned from core business operations before interest, taxes, and non-operating items.

What is Net Income?

Definition: Net income, the bottom line of a company’s income statement, represents total profits after all expenses. Calculated by subtracting all costs, taxes, and interest from total revenue, net income reflects the company’s overall profitability.

It’s a crucial indicator for investors, indicating the actual earnings available to shareholders after all obligations. Net income serves as a key measure of a company’s financial success and sustainability in the long run.

Net Income Example

ABC Corp reports the following financial figures for the year:

  • Total Revenue: $1,200,000
  • Cost of Goods Sold (COGS): $700,000
  • Operating Expenses: $250,000
  • Interest Expense: $50,000
  • Taxes: $70,000

Net Income Formula

Net Income=Total Revenue-Cost of Goods Sold (COGS)-Operating Expenses-Interest Expense-Taxes

Where:

  • Total Revenue is the total income from sales.
  • Cost of Goods Sold (COGS) is the direct cost of producing goods or services sold.
  • Operating Expenses include costs like salaries, rent, and utilities.
  • Interest Expense is the cost of interest on borrowed funds.
  • Taxes are the income taxes owed.

How to Calculate Net Income?

Calculate Gross Profit:

Gross Profit=Total Revenue–COGS

Gross Profit=$1,200,000-$700,000=$500,000

Calculate Operating Income:

Operating Income=Gross Profit-Operating Expenses

Operating Income=$500,000-$250,000=$250,000

Subtract Interest Expense:

Income Before Taxes=Operating Income-Interest Expense

Income Before Taxes=$250,000-$50,000=$200,000

Subtract Taxes:

Net Income=Income Before Taxes-Taxes

Net Income=$200,000-$70,000=$130,000

Result:

  • Net Income: $130,000

Operating Income vs. Net Income: Key Differences

These metrics may sound similar, but they have some differences that can make or break your company’s success. So, what sets them apart?

  • Scope

Operating income delves deep into the company’s core operations, excluding non-operational factors. On the other hand, net income paints a broader financial canvas, encapsulating all revenues and expenses. As a result, it offers a comprehensive overview beyond mere operations.

  • Components

Operating income comprises the difference between operating revenue and operating expenses, focusing on the financial intricacies directly tied to a company’s day-to-day business operations. This concept is closely related to the analysis of marginal revenue vs marginal cost, where understanding the incremental benefits and costs is crucial for decision-making.

In contrast, net income encompasses a wider array of components, extending beyond operating realms to include taxes, interest, and other non-operational factors.

  • Inclusiveness

The key differentiator lies in inclusiveness. Operating income deliberately excludes non-operational elements, providing a purer assessment of a company’s operational prowess. Meanwhile, net income embraces all aspects, presenting a more holistic view of the company’s financial health.

  • Financial Assessment

While operating income zeros in on profitability from core operations, net income casts a wider net. Net income reflects the overall profitability, considering all revenues and expenses, whether from operations or non-operational facets.

  • Place on the Income Statement

Operating income takes a prominent position above net income on the income statement. Acting as a precursor, it showcases a company’s operational performance. Net income, situated at the bottom line, summarizes the overall profitability, encapsulating all financial elements.

  • Use in Financial Analysis

Operating income proves invaluable for analysts assessing a company’s operational efficiency and profitability, especially when using tools like Power BI for income statement analysis. It allows a deep dive into the core of a business. Conversely, net income is a pivotal metric for a broader financial analysis. It is handy for investors to evaluate a company’s overall financial performance analysis and attractiveness.

Operating Income vs. Net Income: Comparison

Understanding the distinction between these financial metrics is like deciphering the secret language of profitability. It enables us to grasp the true essence of a company’s financial performance.

  1. Understand the definitions: Begin by grasping the operating income and net income definitions. Operating income focuses on core operations, while net income encompasses all revenues and expenses.
  2. Review the income statement: Examine the company’s income statement. Operating income is a precursor to net income, providing insight into operational performance before broader financial considerations.
  3. Assess operational efficiency: Evaluate operational efficiency using operating income. This metric isolates the profitability derived exclusively from day-to-day business activities, providing insights into the company’s operational health.
  4. Consider non-operating items: Factor in non-operating items when looking at net income. Understand how interest, taxes, and other non-operational elements influence the company’s overall profitability.
  5. Evaluate overall profitability: While operating income sheds light on operational success, net income gives a broader perspective on overall profitability. Assess both metrics to understand the company’s holistic financial standing.
  6. Analyze trends over time: Study trends over time. Analyzing operating and net income trends unveils patterns and offers insights into a company’s financial trajectory.
  7. Assess non-operating impact: Distinguish between the impact of operating and non-operating factors. Identify areas where non-operating items significantly contribute or detract from the overall financial performance.
  8. Consider industry benchmarks: Benchmark your company’s operating and net income against industry standards. This comparative analysis provides context, indicating how the company fares within its sector.
  9. Evaluate profit margins: Calculate profit margins using both metrics. Operating margin gauges operational efficiency, while net margin reflects overall profitability, aiding in a comprehensive assessment.
  10. Understand the context: Lastly, understand the broader context. Consider the company’s strategic goals, market conditions, and industry nuances to interpret the significance of these metrics. This contextual understanding is crucial for a comprehensive comparison.

How to Evaluate the Results of Operating Income vs. Net Income?

Data visualization is the superhero of data analysis, saving us from drowning in a sea of numbers. Charts and graphs help to spot trends and outliers in data, making it accessible and understandable.

But alas, the trusty sidekick, Excel, falls short when visualizing complex data relationships.

So, how can we analyze net income vs operating income in Excel?

ChartExpo.

ChartExpo creates stunning, insightful data visualizations that make data come alive. Consequently, you can easily analyze operating income vs. net income in Excel.

Let’s learn how to install ChartExpo in Excel

  1. Open your Excel application.
  2. Open the worksheet and click the “Insert” menu.
  3. You’ll see the “My Apps” option.
  4. In the office Add-ins window, click “Store” and search for ChartExpo on my Apps Store.
  5. Click the “Add” button to install ChartExpo in your Excel.

ChartExpo charts are available both in Google Sheets and Microsoft Excel. Please use the following CTA’s to install the tool of your choice and create beautiful visualizations in a few clicks in your favorite tool.

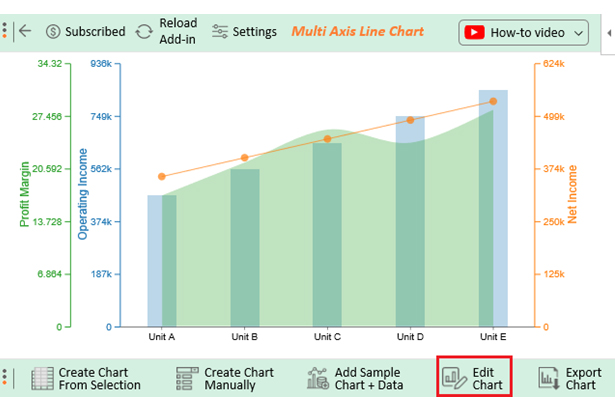
Assume you have the financial data table below.

Business Unit Operating Income Net Income Profit Margin
Unit A 500000 400000 20
Unit B 600000 450000 25
Unit C 700000 500000 30
Unit D 800000 550000 28
Unit E 900000 600000 33

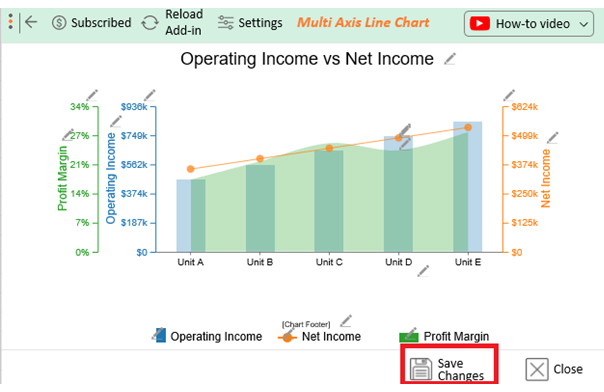
Follow these steps to visualize this data with ChartExpo and glean the operating income vs. net income insights.

  • To get started with ChartExpo, install ChartExpo in Excel.
  • Now Click on My Apps from the INSERT menu.
insert chartexpo in excel
  • Choose ChartExpo from My Apps, then click Insert.
open chartexpo in excel
  • Once it loads, scroll through the charts list to locate and choose the “Multi-Axis Line Chart”.
search multi axis line chart in excel
  • Click the “Create Chart From Selection” button after selecting the data from the sheet, as shown.
Create Chart From Selection ce480
  • ChartExpo will generate the visualization below for you.
Operating Income vs Net Income Design Template
  • Click on Settings and change the “Data Representation” of Operating Income into Bar as follows.
Data Representation ce480
  • If you want to add anything to the chart, click the Edit Chart button:
Edit Chart ce480
  • Click the pencil icon next to the Chart Header to change the title.
  • It will open the properties dialog. Under the Text section, you can add a heading in Line 1 and enable Show.
  • Give the appropriate title of your chart and click the Apply button.
Apply Tittle on Chart ce480
  • Let’s add the Prefix (e.g., $ sign) with the “Net Income” values.
  • Click the highlighted pencil icon. Expand the “Label” properties to add the Prefix value (e.g., $ sign).
Add Prefix Value To Net Income ce480
  • Let’s add the $ sign with the “Operating Income” values.
  • Click the highlighted pencil icon. Expand the “Label” properties to add the Prefix value ($ sign).
Add Prefix Value To Operating Income ce480
  • You can change the precision value of the Profit Margin to zero:
Change Precision Value of Profit Margin ce480
  • Let’s add the % sign with the “Profit Margin” values.
  • Click the highlighted pencil icon. Expand the “Label” properties to add the Prefix value ($ sign).
  • Click on Save Changes and again click on Edit for more changes as follows:
Add Prefix Value To Profit Margin ce480
  • Change the Legend shape of Operating Income into a column and click the “Apply” button.
Change The Legend Shape of Operating Income ce480
  • Change the Legend shape of Net Income to Line and Circle and click the “Apply” button.
Change The Legend Shape of Net Income ce480
  • Click the “Save Changes” button to persist the changes made to the chart.
Save All Changes ce480
  • Your final chart will look like the one below.
Final Operating Income vs Net Income

Insights

  • Unit E is the most lucrative, boasting a 33% profit margin.
  • Unit C follows with a 30% margin, while Unit A, B, and D trail with 20%, 25%, and 28% margins, respectively.
  • Despite variations, all units contribute to the company’s financial success. Unit E is the top performer, closely followed by Unit C.

How To Manage Operating Income And Net Income?

Monitor Revenue and Expenses

  • Operating Income: Focus on increasing revenue while controlling costs of goods sold (COGS) and operating expenses.
  • Net Income: Track all expenses, including interest and taxes, to ensure they don’t disproportionately impact your profit.

Optimize Costs

  • Operating Income: Regularly review and optimize operational costs such as labor, materials, and overhead.
  • Net Income: Look for ways to reduce interest expenses and tax liabilities through effective financial management and tax planning.

Improve Efficiency

  • Operating Income: Enhance business processes and productivity to increase efficiency and reduce waste.
  • Net Income: Implement cost-control measures and streamline operations to improve overall profitability.

Forecast and Budget

  • Operating Income: Create accurate forecasts and budgets to plan for expected revenues and expenses.
  • Net Income: Include all financial aspects in your budget, such as debt service and tax obligations, to prevent unexpected financial shortfalls.

Regular Financial Review

  • Operating Income: Conduct periodic reviews of income statements to assess the performance of core operations.
  • Net Income: Analyze the impact of all financial activities, including interest and taxes, on the overall profitability.

Adjust Pricing Strategies

  • Operating Income: Reevaluate pricing strategies to ensure they cover costs and align with market conditions.
  • Net Income: Ensure pricing adjustments also account for changes in cost structure and tax implications.

Strategic Investments

  • Operating Income: Invest in growth opportunities that enhance core operations and generate additional revenue.
  • Net Income: Make strategic investments that provide long-term benefits and optimize returns after accounting for all financial obligations.

Operating Income vs. Net Income FAQ

Is net income and operating income the same?

No, they differ. Operating income focuses on the core financial operations of a business, excluding non-operational elements. Conversely, net income encompasses all aspects, offering a comprehensive financial overview.

Why is operating income better than net income?

Operating income hones in on core operations, providing a purer measure of operational efficiency. Net income includes non-operational elements, offering a broader but sometimes muddled financial picture.

What is operating income vs. net income?

Operating income reflects a company’s profitability before taxes and interest, isolating core operational efficiency. Conversely, net income encompasses all revenue and expenses, providing a comprehensive financial snapshot, including non-operational elements.

Wrap Up

Operating income vs. net income serves distinct roles in financial analysis. Operating income reflects a company’s core profitability, excluding interest and taxes. Net income, encompassing all costs, provides a comprehensive overview of overall financial performance.

Analyzing both metrics in a spreadsheet aids in dissecting a company’s financial health and facilitates strategic decision-making. Moreover, understanding the differences clarifies the impact of financial activities on the company’s bottom line.

The spreadsheet’s versatility allows for detailed analysis, providing insights into income components and profitability drivers. Accurate analysis facilitates better-informed decisions and strategic planning for sustainable financial growth. Incorporating visualizations enhances data interpretation, making financial insights more accessible.

While spreadsheet offers robust number-crunching capabilities, it falters in the visualization department. Enter ChartExpo, the visual maestro that transforms this numerical dance into a vibrant spectacle. ChartExpo gives life to your financial data, unlocking new dimensions of comprehension and empowering informed decision-making.

Do not hesitate.

Let the numbers groove and the insights flow with ChartExpo as your guide in the financial analysis arena.

How much did you enjoy this article?

ExcelAd1
Start Free Trial!
131574

Related articles

next previous
Data Analytics12 min read

Business Intelligence in Healthcare Industry: A Visual Approach

Business Intelligence in the healthcare industry improves patient care and streamlines operations. Learn how BI works and benefits healthcare providers.

Data Analytics10 min read

Analytics in Telecom Industry for Better Insights

Analytics in the telecom industry optimizes networks, enhances customer experience, and detect fraud. Learn its key benefits, challenges, and use cases.

Data Analytics7 min read

Financial Forecasting for Startups: A Complete Guide

This guide dives deep into financial forecasting for startups. You'll also discover elements of a financial projection for a startup, and tips for creating one.

Data Analytics32 min read

Data Reporting: Making Your Reports Irresistible

Data reporting turns numbers into insights that guide decisions. Learn how to simplify complex data and make confident choices. Read on for key strategies!

Data Analytics10 min read

Employee Performance KPIs: Insights That Drive Action

Employee performance KPIs track productivity and success. Learn the key metrics, measurement methods, and analysis techniques to boost performance.

ChartExpo logo

Turn Data into Visual
Stories

CHARTEXPO

  • Home
  • Gallery
  • Videos
  • Services
  • Pricing
  • Contact us
  • FAQs
  • Privacy policy
  • Terms of Service
  • Sitemap

TOOLS

  • ChartExpo for Google Sheets
  • ChartExpo for Microsoft Excel
  • Power BI Custom Visuals by ChartExpo
  • Word Cloud

CATEGORIES

  • Bar Charts
  • Circle Graphs
  • Column Charts
  • Combo Charts
  • Comparison Charts
  • Line Graphs
  • PPC Charts
  • Sentiment Analysis Charts
  • Survey Charts

TOP CHARTS

  • Sankey Diagram
  • Likert Scale Chart
  • Comparison Bar Chart
  • Pareto Chart
  • Funnel Chart
  • Gauge Chart
  • Radar Chart
  • Radial Bar Chart
  • Sunburst Chart
  • see more
  • Scatter Plot Chart
  • CSAT Survey Bar Chart
  • CSAT Survey Chart
  • Dot Plot Chart
  • Double Bar Graph
  • Matrix Chart
  • Multi Axis Line Chart
  • Overlapping Bar Chart
  • Control Chart
  • Slope Chart
  • Clustered Bar Chart
  • Clustered Column Chart
  • Box and Whisker Plot
  • Tornado Chart
  • Waterfall Chart
  • Word Cloud
  • see less

RESOURCES

  • Blog
  • Resources
  • YouTube
SIGN UP FOR UPDATES

We wouldn't dream of spamming you or selling your info.

© 2025 ChartExpo, all rights reserved.