Categories
By ChartExpo Content Team
The 80-20 rule is a tool. Don’t let it become a blindfold.
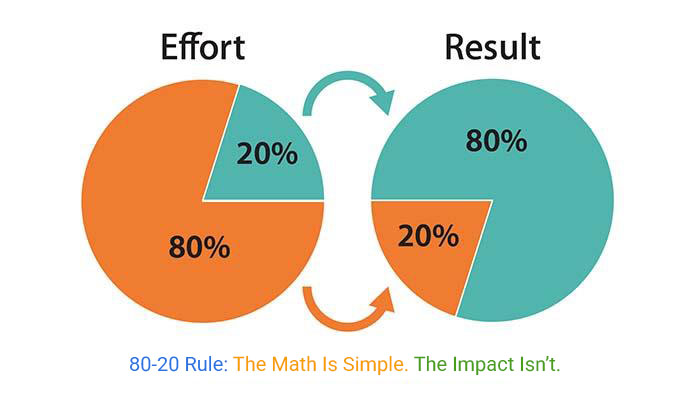
The 80-20 rule says 80% of results come from 20% of effort. It’s simple. It feels smart. So smart that teams, leaders, and companies use it everywhere. Cut the noise. Double down on what’s working. Easy win, right?
Not always. The 80-20 rule can backfire. It can trap teams in short-term thinking. It can divide departments. It can blind you to what actually drives long-term growth. When the 80-20 rule gets rigid, it becomes a wall, not a lens. You stop looking around. You stop asking why. You cut parts that seem small but carry a big impact.
The 80-20 rule is not wrong. But it’s often misused. What worked last quarter might sink you this one. Your most loyal customers might not be who you think. The support team you trimmed might have been holding everything together. If you’re applying the 80-20 rule without asking what you’re really measuring, you might be scaling the wrong things.
The rule itself is solid. It’s a tool that has helped countless people and businesses achieve more with less effort. But like any tool, its effectiveness depends on how it’s used. If a carpenter uses a hammer for everything, even screws, they won’t get far. Similarly, clinging to this rule without flexibility can lead to missed chances.
Consider the way some businesses apply this rule. They might focus only on their top clients or products, thinking this will always yield the best returns. But markets are fickle. What’s your top today might not be tomorrow. The key lies in knowing when to stick to the rule and when to step back and reassess. This balance keeps businesses adaptable and ready for change.
| Reasons to Rethink the 80-20 Rule in Dynamic Environments | ||
| Reason | Explanation | Better Alternative or Condition |
| Market conditions change | Yesterday’s top 20 percent may not be relevant today | Re-evaluate regularly based on updated data |
| Customer behavior evolves | Loyalty and value can shift unexpectedly | Monitor behavior trends over time |
| Overlooks strategic enablers | Support functions may not show immediate ROI | Map indirect contributors before deprioritizing |
| Data quality issues | Inaccurate or incomplete data misguides the focus | Audit and improve data systems before applying the rule |
| Seasonal or cyclical effects | Temporary trends may mislead decisions | Use multi-period analysis instead of snapshots |
| Competitive actions shift leverage | Competitor moves can reshape value distribution | Benchmark against external forces |
| Operational constraints | Teams may not have the capacity to reallocate | Evaluate bandwidth before shifting priorities |
| Innovation is often buried | New or low-visibility areas may carry future potential | Protect exploration and early-stage projects |
The allure of quick wins can be tempting. The principal often pushes us to concentrate on immediate gains. Who doesn’t love a quick victory? But this focus can trap us in short-term thinking. We might neglect long-term strategy and growth in favor of immediate results.
Think of it like dieting to lose weight fast. You might drop pounds quickly, but without a sustainable plan, the weight creeps back. Businesses face a similar risk. Concentrating solely on the here and now can lead to a lack of preparation for future challenges. It’s vital to balance immediate goals with long-term vision.
Focusing intently today can make us vulnerable tomorrow. While honing in on the most productive areas seems smart, it can create fragility. Consider a bridge built only to withstand today’s traffic. If tomorrow brings heavier loads, the bridge might crumble. Similarly, businesses that rely too heavily on current successes might struggle with future demands.
This focus can also lead to overdependence on a few key areas. If those areas falter, the entire structure can become unstable. Diversification remains crucial. By spreading attention across different areas, companies can build a more resilient foundation. This approach prepares them for changes and challenges that lie ahead.
| Common Problems with the 80-20 Rule in Business Strategy | ||
| Problem | Description | Suggested Fix |
| Focuses too heavily on short-term wins | Leads to neglect of long-term resilience | Add future-weighted evaluation in decision-making |
| Neglects margin and cost structure | High-performing areas might be unprofitable | Pair volume data with margin and CAC analysis |
| Creates internal division | Departments may disagree on what the ‘top 20 percent’ | Facilitate cross-functional prioritization workshops |
| Assumes uniformity across contexts | What works in sales may not work in operations | Customize the application by department or function |
| Lacks flexibility over time | The top 20 percent can shift rapidly with market changes | Review and recalibrate regularly |
| Oversimplifies causality | Ignores support roles and interdependencies | Map the full value chain before applying cuts |
| Incentivizes silo behavior | Teams compete over being prioritized | Use shared success metrics across departments |
| Leads to over-reliance on visible outputs | Low-visibility functions like support may get cut | Incorporate qualitative insights into prioritization |
Last quarter’s success doesn’t guarantee this quarter’s victory. The same strategy that brought in profits might now lead to losses. Why? Because conditions change. Customer preferences evolve, and competitors adjust. Sticking rigidly to past methods can be dangerous.
Consider a store that sells snow gear in winter. It thrived, but sticking with the same goods in summer could spell trouble. Recognizing when to pivot is key. Businesses must stay vigilant, ready to switch tactics when necessary. Old habits can become liabilities.
| Misuses of the 80-20 Rule and How to Correct Them | ||
| Misuse Type | Description | Corrective Action |
| Treating the rule as static | Assuming the top 20 percent never changes | Set a cadence for quarterly review |
| Applying it without context | Cutting people, teams, or products too quickly | Require impact verification before deprioritizing |
| Using revenue as the only metric | Overlooks support, quality, or loyalty | Use composite scoring (margin, churn, NPS, etc.) |
| Focusing only on direct outcomes | Ignores upstream or enabling work | Trace contributions across the value chain |
| Overgeneralizing across departments | Misalignment between sales, ops, and product priorities | Customize rule usage by team function |
| Ignoring emerging opportunities | New ideas may not yet appear in the top 20 percent | Balance focus with experimentation zones |
| Applying it as a cutting tool | Used to justify layoffs or budget cuts only | Use it to reallocate, not just reduce |
| Failing to revalidate metrics | Relying on outdated or irrelevant KPIs | Continuously update success criteria |
The rule often highlights the most productive 20%, but it ignores profit margins. Not all high-performing segments are profitable. Some might bring in significant revenue, but at a low margin. This rule doesn’t account for these nuances.
Imagine focusing on a product line that sells well but costs a lot to produce. Profits may be slim. Businesses might chase high-volume sales without realizing the impact on their bottom line. Understanding the difference between revenue and profit is crucial.
The rule suggests that a small group of customers drives most sales. However, identifying this group can be tricky. It’s not always the loudest or most frequent buyers. Sometimes, it’s the quiet ones making significant purchases over time.
Take a bookstore, for example. Regular customers might buy small items often. Meanwhile, less frequent visitors might make bulk purchases. These infrequent buyers can drive substantial revenue. Recognizing them requires careful analysis of purchase patterns and data.
| Pitfalls of the 80-20 Rule and How to Avoid Them | ||
| Pitfall | Description | Avoidance Strategy |
| Confusing activity with value | Most frequent users might not be the most valuable | Prioritize by LTV, not volume alone |
| Undervaluing indirect contributors | Overlooks infrastructure or support teams | Recognize enablers as value amplifiers |
| Overreliance on efficiency | Risks of creating brittle systems | Balance with strategic redundancy |
| Ignoring customer lifetime potential | Low-frequency buyers may have high retention or upsell value | Analyze long-term behavior trends |
| Cutting experimental or new initiatives | Early-stage projects may not yet show ROI | Protect innovation zones with separate KPIs |
| Assuming past performance predicts future success | The top 20 percent performers may decline unexpectedly | Incorporate trend and volatility analysis |
| Overlooking emotional or brand value | Soft factors like trust and loyalty do not show in raw numbers | Include qualitative inputs in evaluations |
| Centralizing decision-making too tightly | May stifle team autonomy and frontline insight | Decentralized priority reviews with team feedback |
Imagine a family planning a vacation. Everyone has a different destination in mind. Sales wants to hit the sunny beaches of increased revenue, operations prefers the peaceful mountains of efficiency, and product development dreams of the bustling city of innovation. The result? Chaos in planning and execution.
When departments don’t see eye to eye on priorities, the organization’s momentum stalls. Each team pulls in its own direction, leading to conflict and inefficiency. It’s crucial to create a shared vision that aligns everyone’s efforts. This common understanding can help the company move forward together, rather than in opposite directions.
Think of a sports team where only the striker gets attention. The rest of the players feel neglected and undervalued. Prioritizing one function over others can hurt team morale. Sales might get the spotlight, while operations and product teams work tirelessly behind the scenes without recognition.
When one department consistently takes precedence, others may feel their contributions are overlooked. This can lead to disengagement and a sense of futility. It’s important to celebrate all achievements and ensure every team feels valued. Recognizing and supporting each function helps maintain high morale and a sense of belonging.
| Consequences of Ineffective 80-20 Rule Execution | ||
| Consequence | How It Manifests | Preventative Measure |
| Loss of morale | Non-prioritized teams feel overlooked | Communicate the why behind decisions transparently |
| Reduced innovation | Cutting low-volume ideas eliminates future potential | Preserve exploration budgets and resources |
| Operational breakdowns | Removing low-impact functions disrupts workflows | Cross-check with interdependency maps |
| Customer churn | Over-focusing on top segments neglects broader needs | Balance support across segments based on value, not just volume |
| Missed growth opportunities | Emerging areas get cut before they mature | Establish a growth track independent of the current ROI |
| Unbalanced workload | Prioritized teams face burnout while others idle | Distribute workload and reward contributions fairly |
| Siloed thinking | Teams optimize for their metrics over shared goals | Use cross-functional KPIs and collaboration rituals |
| Strategic drift | Short-term focus disconnects from long-term vision | Use a dual-horizon framework to anchor both timeframes |
Picture a relay race where one runner doesn’t pass the baton. The whole team suffers. When prioritization favors one function, cross-functional collaboration can stall. This disrupts the momentum needed to achieve shared goals. Departments need to work together, not in silos.
Teams must understand their interdependence. Operations need sales to bring in customers, and sales rely on product teams to offer innovations. Without collaboration, the organization may struggle to progress. Encouraging open communication and joint planning can restore this cross-functional energy.
Recency bias is sneaky. It makes us focus on recent events, forgetting the past. Imagine a company seeing a sudden increase in customer sign-ups. They might assume it’s due to their latest campaign. But maybe it’s a seasonal trend. Jumping to conclusions can risk losing sight of long-term value.
We’ve all seen it. A brand shifts focus based on recent trends, ignoring years of data. They might chase a fleeting fad, only to find it fades fast. A broader view helps. Balancing recent data with historical trends provides a clearer picture. It’s like watching the whole movie instead of just the last scene.
Chasing Average Order Value (AOV) can be tempting. Higher numbers look great. But focusing solely on AOV can blindside a business. Why? Because Customer Acquisition Cost (CAC) matters too. If CAC is high, profits might not follow.
Picture this: a company celebrates a high AOV. They think they’re winning. But their CAC has skyrocketed. In the end, they might be losing money on each customer. Balancing AOV with CAC is key. It’s like baking a cake, too much sugar, and it might not taste as sweet.
Leaderboards are flashy. They show who’s on top. But they don’t tell the whole story. Composite metrics, on the other hand, offer a fuller picture. They combine different data points to give better insights.
Imagine a leaderboard showing top salespeople. It might highlight big sellers but ignore customer satisfaction. Composite metrics can reveal who’s selling well while keeping customers happy. It’s like reading the book instead of just judging the cover.
| When Not to Use the 80-20 Rule in Decision-Making | ||
| Scenario | Why It’s a Bad Fit | What to Use Instead |
| During early-stage experimentation | Premature optimization limits learning | Use broad exploration and feedback loops |
| In crisis situations | Cutting might worsen instability | Focus on risk containment, not productivity |
| When system knowledge is incomplete | Misjudging inputs leads to wrong cuts | Invest in discovery and stakeholder interviews |
| In innovation labs or R&D | Ideas often need time and support to show value | Use stage-based resource allocation instead |
| With new customer segments | Early signals may be noisy or misleading | Wait for trend validation before prioritizing |
| When team morale is fragile | Deprioritization can appear punitive or arbitrary | Pair prioritization with transparent rationale |
| In cross-functional process redesign | Cutting one area may break others | Model process dependencies first |
| Where brand or trust is critical | Soft value drivers may not register in the top 20 percent | Weigh reputational and relational metrics |
Think of the early days of a startup. The founder’s energy is infectious. It’s like a contagious enthusiasm that drives the team. But as the company grows, those wins get harder to maintain. More people join, and the founder’s energy doesn’t reach everyone like before. The startup vibe fades as layers of management come in.
The 80-20 rule might highlight key wins, but it doesn’t keep that energy alive. New systems and culture need to evolve. The founder’s spark can’t sustain everyone forever. It’s crucial to build a culture that captures that initial excitement and keeps it alive through growth.
Picture a water glass filled to the brim. If you try to add more water, it spills over. The 80-20 rule assumes you’re not overflowing. It works best when there’s room to shift focus or resources. But if your team is maxed out, there’s no space to make those changes.
In such cases, the rule’s benefits are limited. You need to create capacity first. Maybe that means cutting down on less important tasks. Or it could involve hiring more staff. It’s about finding room to breathe before you can apply the rule effectively.
| What Can Go Wrong with the 80-20 Rule in Practice | ||
| Issue | Trigger | Early Warning Signal |
| Strategic drift | Overfocusing on top performers leads to stagnation | Track the diversity of initiatives to ensure innovation |
| Cultural erosion | Some teams feel excluded or unsupported | Ensure recognition across all functional areas |
| Revenue-risk exposure | Overdependence on a few segments | Monitor customer or product concentration ratios |
| Support system collapse | Cut functions that quietly hold infrastructure together | Map dependencies before reducing scope |
| Loss of agility | Optimized areas may resist necessary change | Build flexibility into even high-performing systems |
| Burnout in top-tier roles | Overloading top contributors leads to attrition | Balance load and invest in backup capacity |
| Misleading metrics | Short-term wins mask long-term vulnerabilities | Use composite and time-lagged KPIs |
| Siloed resource allocation | Departments hoard resources instead of collaborating | Tie resource use to cross-team outcomes |
Lean operations focus on cutting out waste. It’s like trimming the fat to make things run smoother. But lean doesn’t automatically mean scalable. Scaling requires building something that can grow without losing quality. It’s more than just being efficient.
Think of a small car. It’s efficient and quick, but you can’t just add more seats to turn it into a bus. Lean and scalable have their own goals. While lean is about efficiency, scaling involves growth strategies and structures. Both are important but serve different purposes.
Think of a jigsaw puzzle. Every piece matters, even the ones in the corners. That’s how ecosystems work, too. While stars grab attention, the gaps in between hold everything together. Filling these gaps adds value and stability to your ecosystem.
Consider the bees in a garden. Flowers are the stars, but bees fertilize them, enabling growth. In your business, relationships and networks that fill the gaps are like these bees. They connect the dots, making the whole system more resilient and effective. So, don’t just focus on the stars, look at what’s in between them.
Ever heard of the saying, “It takes a village”? Your top 20% can’t shine without the village behind them. Indirect contributors play a pivotal role in holding up the stars. They provide the support, knowledge, and groundwork needed for success.
Think of a successful restaurant. The chef might be the rockstar, but it’s the kitchen staff, the suppliers, and even the dishwashers who keep it running smoothly. They’re the backbone, ensuring that everything functions seamlessly. Recognizing their value can lead to greater efficiency and innovation.
Sometimes, having a backup plan is smarter than cutting corners. Strategic redundancy means having extra resources to step in when things go awry. It’s like having an extra tire in your car trunk, just in case. This approach can save the day when unexpected challenges arise.
In technology, servers often have backups. This isn’t wasteful; it’s smart. Being prepared for hiccups ensures that operations continue smoothly. Embracing redundancy means you’re ready for anything, reducing downtime and safeguarding productivity.
| Common Myths About the 80-20 Rule and the Reality | ||
| Myth | Why It Misleads | Truth |
| The top 20 percent always stays the same | Market conditions evolve constantly | Performance is dynamic, not static |
| Cutting the 80 percent leads to automatic growth | Removes vital, hidden value | Low-visibility areas may carry long-term payoff |
| The 80-20 rule applies universally | Not all domains follow this ratio | It’s a heuristic, not a natural law |
| Revenue equals value | High revenue areas may have poor margins | Profitability depends on cost and margin structure |
| More focus always improves results | Overfocus can blind teams to risk | Balance attention between core and exploratory areas |
| The rule simplifies strategy | It can oversimplify complex systems | Use it as a lens, not a decision-making engine |
| You can apply it once and forget it | Priorities shift as the business evolves | Review and recalibrate usage regularly |
| Only the top 20 percent matters | Other segments often support or enable success | Value exists throughout the system |
Your calendar should be a tool, not a tyrant. If it’s packed with back-to-back meetings, it might show panic rather than priorities. A chaotic schedule can lead to stress and burnout. Prioritizing tasks is key. Not every meeting needs to happen now.
Imagine your calendar as a canvas. Each appointment should serve a purpose. If your day is filled with low-impact tasks, it’s time to reassess. Consider carving out blocks for deep work, where you can focus without interruptions. This approach can enhance clarity and productivity.
High-impact tasks don’t always shine in the spotlight. These are the behind-the-scenes actions driving success. A quiet decision or a small change can yield significant results. Visibility doesn’t always equate to importance.
Consider the unsung projects that keep things running smoothly. They might not get applause, but they’re essential. Prioritize tasks based on impact, not just visibility. This shift in focus can lead to greater gains.
Just as you review your profits and losses, auditing your time can uncover insights. Track where your hours go to spot inefficiencies. This practice can reveal how much time is spent on low-value tasks.
Picture your schedule as a financial statement. Each task is a line item. Evaluate its worth and necessity. This approach can help you eliminate waste and focus on activities that truly matter.
Businesses love to follow the money. They chase after high returns, ignoring weaker spots. But those weak areas can hold hidden potential. It’s like a leaky pipe in a house. Fixing it can prevent bigger problems down the line and save money.
Sometimes, a little attention can turn a weak link into a strength. For example, improving a struggling team can boost overall efficiency. Fixing small problems can lead to big improvements. This approach keeps your entire operation running smoothly, not just the profitable parts.
Imagine pulling out one block from a Jenga tower. What happens? That’s reverse stress-testing in action. It helps you see what’s really holding things up. By testing what happens when you remove “low-impact” elements, you discover their true value.
Sometimes, the parts we think are minor are actually crucial. Removing a small cog can stop a whole machine. Reverse stress-testing lets you identify these hidden gems. It’s a way to find strength in the unexpected and appreciate the small parts that make the whole work.
| Reverse Stress Testing for the 80-20 Rule | ||
| Element | Current Perceived Impact | Risk if Removed |
| Legacy Support Team | Low direct revenue impact | High disruption to customer retention if removed |
| Internal QA Process | Not visible to end users | Increased error rates and rework post-removal |
| Customer Education Content | Low click volume | Spike in support tickets without it |
| Regional Sales Office | Below-average quota attainment | Loss of strategic clients in niche areas |
| Analytics Reporting Team | No direct output tied to revenue | Decision quality degrades without data insights |
| Onboarding Program | Low participation rates | Longer ramp time and churn for new users |
| Internal IT Admins | Viewed as a cost center | System downtime and reduced productivity |
| Compliance Reviews | No customer-facing outcome | Legal and regulatory exposure is removed |
Focus isn’t about cutting corners. It’s about clarity and direction. Think of a flashlight in the dark. It doesn’t blind you; it guides you. Focus helps you see the path clearly and follow it without distraction.
Using focus as a guiding principle transforms how you work. It’s about seeing the forest and the trees. By concentrating on key areas, you create more value. It’s not about doing less, but about doing what matters more.
Scoring involves more than just numbers. It’s about understanding the landscape. Fit means aligning your resources with your goals. Momentum is the pace at which your business can grow. Margin looks at profitability. Long-term moats assess your competitive edge. Each factor is crucial in its own right.
Operators need to assess these factors regularly. Changes in the market can shift priorities. A product that fits today might not tomorrow. Momentum can wane. Margins can shrink. Moats can erode. Scoring helps you stay ahead of these shifts. It ensures you focus on what brings the most value.
The old days of annual strategy meetings are gone. Businesses must recalibrate plans more often. The market changes too fast for yearly reviews. Regular adjustments keep you agile. They help you respond to trends and challenges swiftly.
Dynamic recalibration allows operators to pivot. It’s like steering a ship through changing seas. You adjust the course as needed. This approach keeps your business aligned with current realities. It ensures resources are always directed toward the most promising paths.
This principle isn’t just about finding gold mines. It’s also about spotting the hidden dangers. Blind spots can drag a business down without notice. Ignoring them can mean missed chances or unexpected challenges. This principle helps operators spot these areas early.
Identifying blind spots involves looking where others might not. It means questioning assumptions and probing deeper. Doing so prevents issues from growing into bigger problems. It turns potential pitfalls into areas of growth and improvement.
The 80-20 rule isn’t the problem. The way it’s used is.
It’s easy to point to top performers and shift focus there. That works, until it doesn’t. Teams stretch. Margins drop. Systems break under the weight they weren’t built to hold.
The 80-20 rule can help you find what’s working. But don’t stop there. Ask what’s keeping it working. Look at what happens if you remove the “low-value” parts. Some of them might be holding the whole thing together.
It’s not about cutting. It’s about shifting. Strengthening the weak links. Fixing the leaks. Supporting the quiet parts that carry more than you think.
The 80-20 rule can show you the path. You still have to choose how to walk it.
How much did you enjoy this article?


Calculate accounts receivable turnover ratio to measure credit collection speed, improve cash flow, and strengthen your financial strategy. Read on!

Change Management KPIs are the key to tracking adoption, performance, and ROI during transitions. Find out which metrics matter. Read on!

Data collection methods and techniques determine the quality of every insight you act on. Explore key approaches for gathering reliable data. Read on!


