Categories
By ChartExpo Content Team
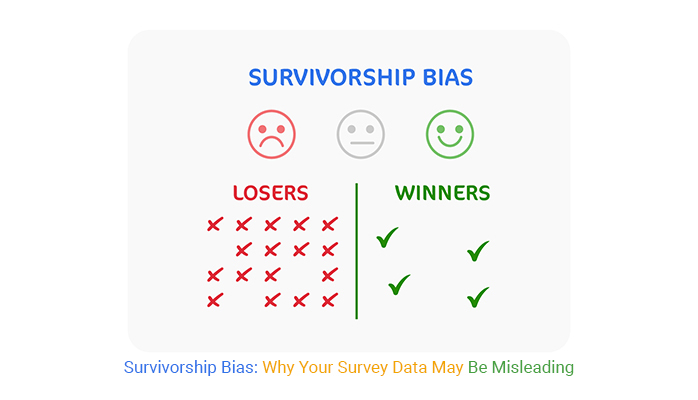
Ever wonder why some ideas seem foolproof until they’re not? Survivorship bias might be to blame. It’s what happens when we focus on the winners—businesses, strategies, or ideas that survived—while ignoring the countless others that didn’t. This creates a false picture of success, leading to risky assumptions and flawed decisions.
Survivorship bias skews how we interpret data. Think about startups. Headlines highlight the rare success stories, but the failures? Those go unnoticed. The result? Aspiring entrepreneurs believe success is easier than it is, setting themselves up for disappointment. Missing the stories of failure means missing valuable lessons.


In surveys, survivorship bias is everywhere. Only the most engaged participants respond, leaving behind silent voices with crucial insights. Ignoring these non-respondents can lead to decisions that don’t reflect reality.
Understanding survivorship bias isn’t optional—it’s the first step to making better choices based on the full story.
First…
Survivorship bias skews our understanding by highlighting winners and ignoring losers. It tricks us into thinking success is more common than it actually is because we’re only looking at those who made it past a certain point, not those who didn’t.
During World War II, statistician Abraham Wald made a groundbreaking observation. Military officials only examined bullet holes in returning planes, not those shot down.
Wald argued that the areas without damage on the returning planes were the most vulnerable, as those hit there did not survive. His insight shifted focus to reinforcing these parts, drastically improving aircraft survival rates.
Survivorship bias appears in everyday life more than we might notice.
Consider mutual funds. Often, we only see the performance of existing funds, not those that failed and closed, potentially misguiding investors about the average returns.
Similarly, online product reviews mainly come from users who keep their products, not from those who returned them, which can skew perceived product effectiveness.
Imagine starting a business and only listening to success stories. Sounds motivating, right?
But here’s the rub: ignoring the many that failed gives a skewed picture. It’s like thinking you can fly after seeing a bird do it—misleading, to say the least.
This bias in survey data collection overlooks the failures, painting an overly rosy scenario. It’s crucial for anyone looking at data to consider what’s missing, not just what’s in front of them.
Ever found yourself excited by a good review while ignoring the bad ones? That’s a classic case of survivorship bias at play. It messes with data-driven decision-making by highlighting successes while the failures lurk silently.
This bias tricks your brain into thinking success is more common than it actually is, leading to potentially risky or poor decisions based on incomplete data.
Let’s say you’re plotting your next big marketing move based on successful case studies using a marketing analytics platform.
You see the hits and miss the misses. Sounds like a plan, right? Wrong.
What you don’t see can hurt you. Basing strategies on incomplete data is like driving with a foggy windshield. You’re missing out on the full picture—like hidden costs and risks that could turn a seemingly brilliant strategy into a disaster.
Always look for what’s not shown in the data to steer clear of these hidden pitfalls.
In entrepreneurship, stories of successful startups often dominate headlines, creating a skewed perspective. Much like misleading charts, this narrative can falsely suggest that success is the norm.
However, many startups fail, and their lessons are frequently overlooked, leading to a distorted perception of the entrepreneurial landscape.
Researchers often encounter survivorship bias by only analyzing survey results that have been completed. This oversight can result in skewed data, as the opinions and reasons for non-completion from a significant portion of the sample are not considered.
It’s like hosting a party and only listening to the customer feedback from those who decided to show up.
In healthcare analytics, survivorship bias can arise when survival rates are calculated based only on patients available for follow-up. Excluding those who drop out due to severe health issues or death can inflate survival statistics, distorting the data analysis.
This can give a rosier picture of treatment effectiveness or disease prognosis than is accurate.
When we sift through data, it’s easy to get caught up in the glow of success stories. But here’s a heads-up: sometimes what shines isn’t gold—it’s survivorship bias in disguise.
This bias occurs when we focus solely on the winners, ignoring those who didn’t make it. It’s like celebrating those who won the lottery without mentioning the millions who didn’t even get their money back.
To spot these tricky patterns, look for outcomes that seem too good to be true. Are all your case studies wildly successful? Does every example in your dataset end in triumph? If so, you might be staring straight at survivorship bias.
It’s not just about the successes; it’s about what’s missing—the silent stories of those not represented in your glowing data reports.
Now, let’s talk about the ghosts in the machine—missing data. This isn’t about the data you have; it’s about what you don’t have.
Missing data can skew results and give a lopsided view of reality. Imagine you’re trying to evaluate a new drug. If you only follow up with those who return to the clinic, you miss out on those who didn’t because they were too sick—or worse. That’s a textbook case of survivorship bias.
To fight this, you need to actively look for what’s not there. Are there gaps in your dataset where the non-survivors should be? This isn’t just a numbers game; it’s a detective hunt for the truth, ensuring every part of the story is told, not just the convenient parts.
Cultural narratives often celebrate the victors while glossing over those who didn’t cross the finish line. This can reinforce survivorship bias. We hear about startups that turned into tech giants but less about the many that didn’t make it past year one.
This narrative can skew our understanding of success and risk, making the entrepreneurial landscape seem far more forgiving than it truly is.
To counteract this, we need to shine a light on the failures as much as the successes. They hold lessons too—often deeper and more instructive than the tales of those who hit it big. By balancing our stories, we provide a fuller, more accurate map of the terrain, helping others navigate with a clearer view of the risks and realities.
Survivorship bias occurs in surveys when we only consider the responses we receive. By ignoring those who didn’t respond, we miss a wealth of insights. It’s like planning a party based only on who RSVPs ‘yes’—we don’t consider the needs or reasons of those who might not show up.
Think about it this way: if you only listen to your friends who love horror movies, you might think everyone loves them!
Similarly, if we only analyze responses from people who complete our surveys, we might think their opinions represent everyone’s. This can lead to skewed results because we’re not getting the full picture.
Missing out on non-responder data is like trying to solve a puzzle with half the pieces missing; you can’t see the whole picture.
Non-responders may hold unique perspectives or reasons for not participating that offer valuable insights into the survey topic. Ignoring these views can contribute to information overload, leading to decisions based on incomplete or skewed data.
Businesses often fall into the trap of focusing solely on positive feedback received through customer surveys. This can lead to a skewed understanding of customer satisfaction, as dissatisfied customers might have stopped responding to surveys or moved to another service.
Without their input, companies might falsely assume that all or most remaining customers are satisfied, potentially ignoring underlying issues that could affect future customer retention and customer acquisition.
When companies conduct employee satisfaction surveys, they usually target current employees. This method can lead to survivorship bias as it overlooks those who have left the company, potentially due to dissatisfaction or better opportunities elsewhere.
By not considering why employees leave, businesses miss out on critical insights that could help improve workplace culture and reduce turnover rates.
In product development, companies might give undue weight to positive feedback from product testing surveys while disregarding negative feedback. This approach can result in survivorship bias, where only the products that receive positive early reviews are advanced.
Such a scenario might lead to market failures later on, as the products might not actually meet the broader needs and expectations of the general public.
The following video will help you create a Likert Scale Chart in Microsoft Excel.
The following video will help you to create a Likert Scale Chart in Google Sheets.
The following video will help you create a Likert Scale Chart in Microsoft Power BI.
When you look at survey data, do you ever feel like something’s a bit too good to be true? That’s your cue to sniff out survivorship bias. One glaring sign is when the results tilt heavily towards the positive, more than you’d typically expect.
This could mean you’re only hearing from the happy campers while those who had a not-so-great experience might have bowed out or weren’t even asked to participate. It’s like throwing a party and only your cheerful friends show up because they know there’s cake!
Now, imagine starting your survey with a bang and a bunch of enthusiastic respondents. But as time ticks by, you notice fewer and fewer folks stick around to hit that ‘submit’ button. This dropout dilemma can skew your data big time.
You end up with responses mostly from those who stayed, potentially those with a stronger opinion or better experience, sidelining the silent voices who might have dipped out early from dissatisfaction or disinterest.
Picture this: you’re looking at your survey responses, and everyone seems to be from the same background or demographic slice. It’s like hearing the same story from different mouths!
This homogeneity is a classic hallmark of survivorship bias, where you’re only catching echoes from a specific segments of your audience, missing out on the rich, varied perspectives that could have painted a more comprehensive picture of the landscape.
Survivorship bias can skew the results of surveys by only including responses from a subset of the original sample, typically those who complete the survey fully. Here’s how some popular tools can help address and mitigate this bias:
Google Forms is a user-friendly tool that can enhance the reliability of survey data. It includes features that allow survey creators to track who has not completed the survey. By sending reminders to those who started but didn’t finish, you can increase survey response rates and reduce survivorship bias, ensuring a more representative sample.
Microsoft Forms provides robust options for managing survey responses. It allows you to send follow-up emails automatically to respondents who haven’t completed the survey.
Additionally, customer segmentation features enable you to analyze the characteristics of respondents who drop out versus those who complete the survey, offering insights into why certain groups may not be finishing, allowing for targeted strategies to boost completion rates.
Mixed-mode surveys, which combine digital and manual data collection methods, can significantly reduce survivorship bias by reaching a broader audience.
For instance, combining online surveys with telephone or paper questionnaires ensures those without internet access or prefer traditional methods can participate. This approach not only increases the diversity of the response pool but also enhances the completeness and accuracy of the data collected, making the findings more robust and less prone to bias.
To prevent survivorship bias, expanding sampling methods is key. Broadening the reach ensures that all segments of a target group are included, not just those that are more visible or accessible.
For instance, instead of relying solely on online surveys, consider incorporating face-to-face interviews, phone surveys, and postal questionnaires. This mixed-method approach helps capture data from those who might not have internet access or prefer other communication modes.
Designing surveys with inclusivity in mind is crucial for avoiding survivorship bias. This means creating surveys that are easy to understand and complete by people with varying levels of education, language skills, and cultural backgrounds. Utilize clear, simple language and consider translations to accommodate non-native speakers.
Additionally, ensure that the survey design is accessible to people with disabilities, such as providing screen reader compatibility or alternative formats for those with visual impairments.
Balancing the accessibility of surveys with attractive incentives can significantly enhance participation rates across diverse demographics. Make sure the survey is easy to access, whether it’s through mobile-friendly designs or providing physical locations for survey completion.
Complementing accessibility with incentives, like small payments, coupons, or entry into a draw, can motivate a broader range of participants to take part. This strategy not only boosts overall response rates but also helps in gathering a more comprehensive dataset, reducing the risk of survivorship bias.
When you’re scratching your head wondering why some folks didn’t take your survey, it’s not just about “who didn’t,” but “why they didn’t.” Getting into the shoes of non-responders can shed light on hidden barriers.
Did they feel the survey was too long? Were the questions too intrusive? Or maybe the timing was off? Tapping into these insights isn’t just good to know; it’s gold for tweaking future surveys.
Think of follow-ups as your second chance to dance at the data party. They’re not about nagging but more about nudging. A well-crafted follow-up can gently remind those who missed the survey to weigh in. It’s like saying, “Hey, your voice matters, let’s hear it!” This approach not only boosts your response rates but also patches up those data gaps, making your results more robust.
Here’s a nifty trick: dangle a carrot, but keep it fair. Incentives are great for getting folks to hop on board your survey train, but the key is balance. You want to sweeten the deal enough to entice participation without making it the only reason they show up.
It’s like hosting a party where the company is just as good as the snacks; both matter to get guests through the door and ensure they have a good time.
In the tech sector, software development teams often rely on user feedback to improve products and services. However, the data can be skewed by survivorship bias. Mostly, feedback comes from users who continue to engage with the product long-term.
This excludes insights from users who may have stopped using the software due to dissatisfaction or other issues. Such sampling bias could lead teams to make decisions based on the needs and experiences of a non-representative sample of users, potentially neglecting areas that need improvement to enhance user retention.
Retail businesses frequently use customer satisfaction surveys to gauge consumer loyalty and response to their services or products. Survivorship bias can occur here when feedback is primarily gathered from repeat customers. These individuals are likely to report higher satisfaction, skewing data and providing a distorted view of overall customer sentiment.
Critical feedback from dissatisfied customers who do not return is often missing, which could provide valuable insights into areas needing improvement.
Healthcare providers often use patient surveys to measure satisfaction and the quality of care. However, these surveys typically capture responses from patients who continue their treatments or visit schedules.
This leads to survivorship bias, as feedback from patients who might have stopped treatment due to dissatisfaction, perceived inefficacy, or other barriers is not captured. This exclusion can lead to overly positive results and misinformed decisions about healthcare practices and patient management strategies.
To tackle survivorship bias effectively, start by setting clear objectives. Understand who your audience is and ensure that your survey goals reflect the diversity within that group. This approach helps in capturing a wide range of experiences and perspectives, reducing the risk of bias that comes from only analyzing the feedback from those who “survive” the conditions set by your initial assumptions.
Next, focus on the non-responders. Often, those who do not respond to surveys can provide insights that are crucial for a balanced view. Set up effective follow-up mechanisms to engage these individuals.
This might involve sending reminders, offering incentives, or using alternative communication methods to increase response rates. Engaging non-responders helps mitigate survivorship bias by ensuring that the voices of all segments of your audience are heard.
Comparing your survey results with external benchmarks is a powerful step in reducing survivorship bias. Look at industry standards or aggregate data from similar surveys conducted by other organizations.
This comparison can highlight anomalies or biases in your data that may have been overlooked. It serves as a validation check that strengthens the reliability of your findings.
Finally, design your survey questions to directly address both positive and negative experiences. This technique ensures that you collect a balanced set of data. Avoid questions that might lead the respondent to provide only socially desirable answers.
By encouraging candid responses about both good and bad experiences, you minimize the risk of survivorship bias skewing your data towards only those who have fared well or had positive engagements with your subject of study.
Digital surveys, while cost-effective and broad-reaching, present unique challenges. Respondents might not engage deeply with the survey as they might in face-to-face interactions, leading to less thoughtful responses.
Also, the lack of personal interaction may affect the quality of the data collected, as nuances in tone and non-verbal cues are lost. Strategies such as improving question design and providing interactive elements can help mitigate these issues.
Feedback loops are essential for refining survey methods and outcomes over time. However, they can inadvertently reinforce existing biases if not carefully managed.
For example, if initial survey results, shaped by certain biases, influence how and what we ask in follow-up surveys, we risk deepening these biases rather than eliminating them. Critical evaluation of feedback loops, with an eye for identifying and correcting bias, is crucial.
When decisions are on the line, the accuracy of the data steering these decisions is paramount. Think about a scenario where a company only reviews feedback from its most vocal customers. Sounds risky, right?
They might miss out on the silent majority whose insights could drive more balanced strategies. By applying survivorship bias mitigation, such as using a scatter graph or a box and whisker plot to visualize the spread and outliers in customer feedback, companies can see the full spectrum of customer experiences. This leads to smarter, more inclusive decision-making.
Reports shape perceptions. If they’re skewed, decisions go awry.
Imagine a health agency assessing a new drug’s effects but only from successful cases. To combat this, using comprehensive visual tools like heatmaps or tree maps can illustrate diverse data points and patterns that might otherwise go unnoticed. By integrating these tools, reports transform into transparent, reliable resources that stakeholders can trust, ensuring decisions are well-rounded and based on all available data.
Alignment is key. Without it, even the best data can lead us astray. Take a company aiming to boost employee satisfaction. If they only consider the happiest employees in surveys, they miss the broader picture.
Strategic use of diverse data visualization techniques, such as the mosaic plot for categorical data or a multi-axis line chart showing various dimensions of employee feedback over time, can reveal deeper insights. These insights help align survey results with real organizational needs, ensuring that initiatives resonate well across the board.
Survivorship bias happens because failures are often invisible or overlooked. People naturally pay attention to things that exist or succeed, while dismissing those that don’t leave a trace. This can stem from a lack of data on failures or a tendency to prefer optimistic stories. Without considering the whole dataset, the results can be misleading and lead to poor decision-making.
Survivorship bias can warp your judgment by making certain outcomes seem more achievable than they really are. For example, you might look at successful stock traders and think their strategies guarantee wealth. But without considering traders who went bankrupt, you’re only seeing part of the story. This bias can lead you to overestimate the likelihood of success and underestimate risks.
To avoid survivorship bias, make a conscious effort to consider both successes and failures. Seek data on what didn’t work, and try to understand why. For example, if you’re studying business strategies, look at both thriving companies and those that failed. By including the “missing data,” you’ll make better, more informed decisions and avoid falling into the trap of biased conclusions.
Success stories are naturally more appealing and widely shared. They inspire, entertain, and motivate, which makes people focus on them. Failures, on the other hand, are often ignored or forgotten because they’re uncomfortable to discuss. This cultural emphasis on success amplifies survivorship bias, creating an incomplete narrative where the lessons from failures are often lost.
While survivorship bias is generally a flaw in thinking, it can sometimes inspire optimism. Focusing on success can motivate people to take action, try harder, or believe in possibilities. However, relying too much on this perspective without acknowledging the risks or failures can lead to unrealistic expectations. Balance is key when considering the role of survivorship bias in decision-making.
Survivorship bias affects how we interpret data and make decisions. It happens when we focus on visible successes while ignoring hidden failures. This bias creates a false sense of reality, leading to overly optimistic conclusions and flawed strategies.
In business, education, healthcare, and beyond, ignoring non-survivors can distort the truth. Misjudging data, dismissing non-responders, or overlooking failed attempts can harm decision-making. Recognizing these gaps is essential for a balanced view.
You can combat survivorship bias by actively seeking missing data, diversifying sampling methods, and analyzing results critically. Emphasize the stories of failure alongside success to uncover actionable insights and avoid misleading conclusions.
Survivorship bias doesn’t have to derail your goals. By staying vigilant and asking, “What’s missing here?” you’ll see the full picture and make smarter, more informed decisions.
Remember this: Success isn’t just what you see; it’s also in what you learn from what’s missing.
How much did you enjoy this article?


Google Forms to Google Sheets keeps your data organized and current with every submission. Learn the steps, methods, and tips now!

Product survey questions reveal what customers truly think. Learn how to ask the right ones and act on the survey results. Read on!

Learn how the 5-Point Performance Rating Scale improves employee evaluations with clear, consistent, and fair performance reviews across teams.


