Categories
Understanding your customers is the key to success. Businesses that invest in learning what their customers love are miles ahead of their competitors.


This necessitates regular surveys to glean valuable insights into the customer base.
Voice of customer survey is one of them. It is one of the most effective methods to gather and act on customer feedback.
Today, consumers are more informed and have many options at their fingertips. Technological advancement has contributed to this ease of access to information. As a result, the market has become more demanding than ever.
Excel is a widely used tool for data presentation and analysis. Voice of customer survey analysis in Excel helps you better understand customer expectations. However, it poses challenges to effective data analysis.
But you can overcome these challenges with ChartExpo.
Continue reading to find out how.
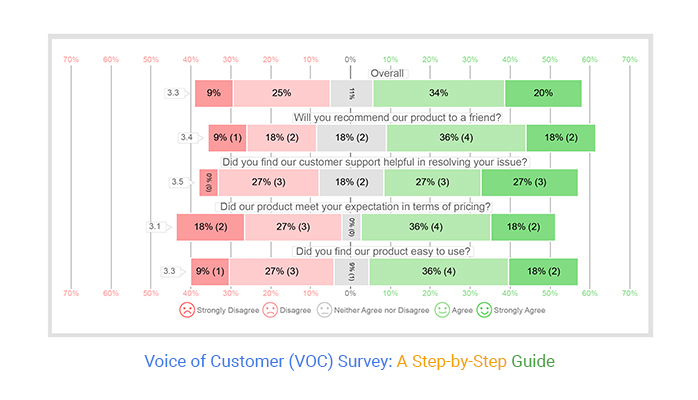
Definition: Voice of customer survey gathers customer feedback about their interactions with products and services. Insights from these surveys help you improve the customer experience. As a result, boost your revenue.
You can ask customers open-ended questions in the survey to gather qualitative feedback about their experience. Otherwise, you can ask them closed-ended questions for quantitative data. Your survey objectives will guide the type of questions you use.
A Voice of Customer Survey is essential for several reasons:
VoC survey provides enough data to look into the customer journey. It helps you identify areas where you excel and where you need to improve. This data strengthens your business’s customer experience strategy.
Improved customer experience is the sure path to improved customer retention. A customer who has a good experience with your brand will not stray away. Capturing customer feedback enables you to identify process flaws and streamline your processes to maintain your customers.
You can use survey ideas to track changes in customer feedback. You can identify emerging trends and adapt your products and services through the feedback captured. This can help you stay ahead of the curve and keep up with the changing customer demands.
Various Voice of Customer Surveys are tailored to capture distinct facets of customer feedback and preferences. The following are examples of commonly utilized survey formats:
Purpose: Evaluate customer loyalty through inquiries about the likelihood of recommending a product or service to others, measured by the Net Promoter Score (NPS).
Question Example: “On a scale from 0 to 10, how likely are you to recommend our product/service to a friend or colleague? Your response will help us calculate our Net Promoter Score (NPS) and understand your loyalty better.
Purpose: Gauges overall customer satisfaction with a product or service.
Question Example: “Please express your satisfaction level regarding your recent engagement with our company.”
Purpose: Assesses the ease with which customers can complete a specific task or interaction.
Question Example: “How easy was it for you to [complete a specific task]?”
Purpose: Allows customers to provide qualitative feedback in their own words.
Question Example: “Please share any additional comments or suggestions you have about your experience with our company.”
Purpose: Centers on acquiring perspectives on customers’ encounters with a particular product.
Question Example: “Which features do you consider particularly valuable in our product, and are there any areas where you believe enhancements could be beneficial?”
Purpose: Collect feedback on the user experience and functionality of a website.
Question Example: “How would you rate your experience navigating our website? Are there any suggestions for improvement?”
Purpose: Gather feedback on customer interactions with employees.
Question Example: “How satisfied are you with the service provided by our employees?”
Purpose: Measures how customers perceive and feel about a brand.
Question Example: “What words or phrases come to mind when you think about our brand?”
Creating VoC Surveys requires careful planning and attention to detail. The following are tips to help you create effective VoC Surveys:
Before crafting survey questions, you must identify what you want to achieve. Clear objectives help in designing effective surveys that gather relevant feedback. Additionally, having a clear objective helps measure the survey’s success.
Customers prefer to fill out only a short survey. Most do not have the time to wriggle their way through numerous words. Simple and short surveys simplify the process and help to achieve a high response rate.
Respondents won’t take the survey if the questions are not easy to understand. Use clear and concise language to ensure the questions are unbiased, succinct, and straightforward.
The first questions should be simple to respond to. Then gradually advance to questions that demand more thought or detail. The goal is to ensure that survey questions flow naturally to help respondents answer with ease.
It’s always a good idea to test surveys before you send them. This helps you identify potential issues and solve them to save you lots of headaches down the road.
Here are more Voice of Customer Survey question examples:
“How often do you use our product/service?”
“What specific features do you frequently use, and how do they benefit you?”
“How does our product or service compare to alternatives offered by other providers?”
“What were the key considerations that led you to select our product over those offered by competitors?”
“How content are you with the assistance provided by our customer service team?”
“Did our support team address your concerns effectively?”
“How probable is it that you will continue using our product or service in the future?
“What factors contribute most to your loyalty to our brand?”
“What influenced your decision to initially choose our product/service?”
“Did particular features or advantages play a significant role in your decision-making process?”
“How user-friendly do you find our product/service?”
“Have you faced any obstacles or issues while utilizing our product?”
Conducting Voice of Customer surveys effectively involves following best practices to ensure that the collected feedback is valuable, actionable, and representative of customer sentiments. Incorporating longitudinal survey methods can further enhance the depth and accuracy of insights over time. Here are some best practices for Voice of Customer surveys:
Clearly outline the goals and objectives of the Voice of Customer Survey. Understand what specific insights you aim to gather to drive meaningful improvements.
Identify and target the appropriate audience for your survey. Ensure that the respondents are representative of your customer base to obtain relevant insights.
Incorporate a variety of surveys, including multiple-choice, open-ended, 5-point Likert scale questions, and demographic questions. This adds depth and richness to the data collected.
Before launching the survey, conduct a pilot test with a small group of individuals to identify any issues with clarity, relevance, or technical aspects of the survey.
Use unambiguous language in your questions to avoid confusion. Ensure that respondents can easily understand and provide accurate feedback.
Voice of customer surveys offer valuable insights into your customers’ thoughts and feelings about your offerings. However, analyzing VoC survey data can be daunting, especially if you’re unfamiliar with data analysis tools.
That’s where ChartExpo comes in.
This powerful Excel add-in makes it easy to analyze VoC survey data, including responses collected through a 7-point Likert scale, and gain actionable insights. Whether you’re a seasoned data analyst or a beginner, ChartExpo helps you make sense of your data.
Benefits of Using ChartExpo
How to Install ChartExpo in Excel?
ChartExpo charts are available both in Google Sheets and Microsoft Excel. Please use the following CTA’s to install the tool of your choice and create beautiful visualizations in a few clicks in your favorite tool.


Assume you send an online survey to every customer who recently bought your product.
Your survey consists of the questions below:
Respondents are to provide an answer to each question using the response scale below:
Let’s say you have received enough feedback, as displayed in the table below.
| Will you recommend our product to a friend? |
Did you find our customer support helpful in resolving your issue? | Did our product meet your expectations in terms of pricing? | Did you find our Is the product easy to use? |
| Agree | Strongly Agree | Disagree | Neither Agree nor Disagree |
| Disagree | Strongly Agree | Agree | Agree |
| Agree | Agree | Agree | Disagree |
| Strongly Agree | Neither Agree nor Disagree | Agree | Strongly Agree |
| Neither Agree nor Disagree | Disagree | Disagree | Agree |
| Agree | Agree | Strongly Agree | Disagree |
| Strongly Disagree | Disagree | Agree | Strongly Agree |
| Strongly Agree | Agree | Disagree | Agree |
| Neither Agree nor Disagree | Strongly Agree | Strongly Disagree | Strongly Disagree |
| Agree | Disagree | Strongly Agree | Agree |
| Disagree | Neither Agree nor Disagree | Strongly Disagree | Disagree |
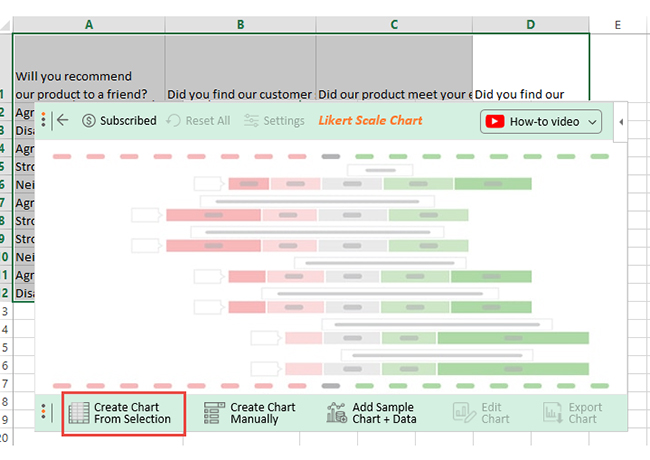
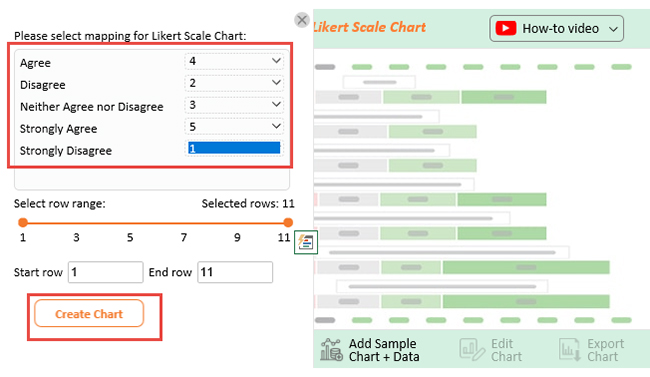
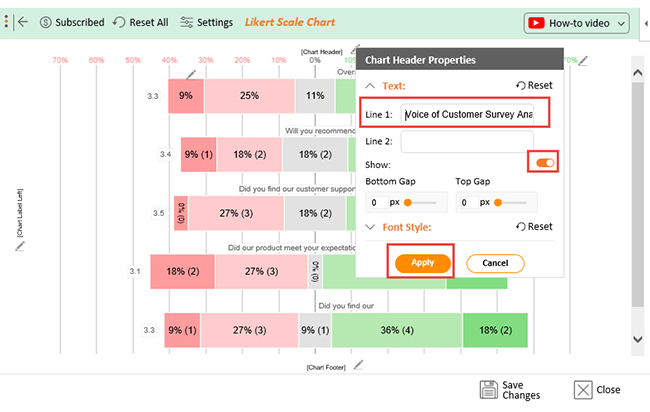
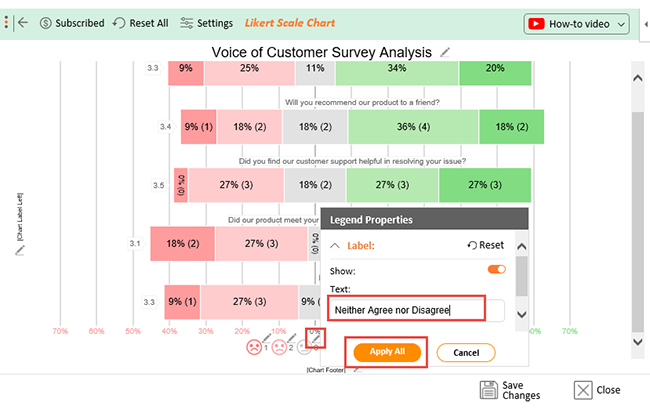
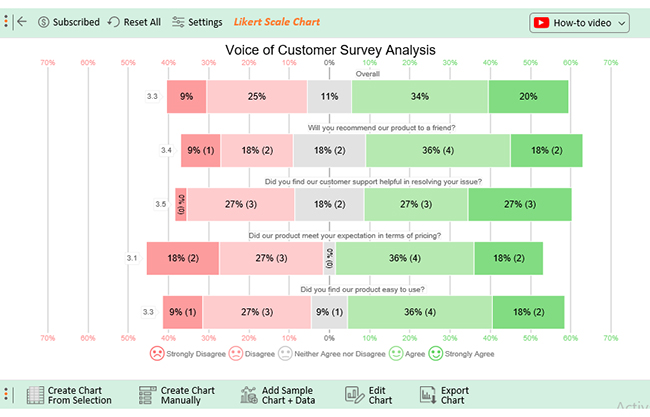
Follow through as I show you how to create insightful visualizations with ChartExpo to analyze the data.


Using surveys as a data collection method offers several advantages, making them a popular and effective tool for gathering information. Here are some key advantages of using survey formats:
Surveys are scalable and can be distributed to a large audience simultaneously. This makes them suitable for collecting data from diverse populations.
Survey formats allow for a variety of question types, including multiple-choice, open-ended, Likert scales, and more. This flexibility caters to different research needs and objectives.
Surveys can be administered quickly, allowing for the rapid collection of data. This is particularly advantageous when time-sensitive information is required.
With the advent of online survey tools, respondents can participate from anywhere with an internet connection. This remote accessibility increases the reach and convenience of survey administration.
Survey data analysis in Excel is typically structured and can be easily analyzed using statistical tools and software.
You can use various methods to gather the voice of the customer survey data. Some of these methods include interviews, online surveys, and client feedback monitoring. VoC surveys provide a complete picture of how customers perceive your brand.
Customer service surveys allow you to look into your customers’ minds. It helps you know the customer’s experience and how to improve your products or services’ quality.
Use ChartExpo for Excel to analyze data from the voice of customer surveys. It is an Excel add-in that makes it easier to create insightful data visualizations. These visualizations help you glean valuable insights to help you enhance your offerings.
A survey designed to capture the customer’s point of view is not just a nice-to-have tool. Instead, it’s a necessity. With an effective voice of the customer surveys, you can collect a plethora of useful data from your customers.
Direct feedback, particularly through interviews and questionnaires, is a centerpiece of the VoC strategy.
Data analysis in Excel is a challenging area for many business owners. Inevitably, this leads to time and resource wastage.
This is where ChartExpo comes in handy.
ChartExpo for Excel allows for easy data analysis. It facilitates the creation of charts with appealing data presentations. Thus you can achieve accurate survey data analysis and use the insights to improve your offerings.
Now that you’ve learned how to install and use ChartExpo, don’t wait any longer. Install ChartExpo now, create insightful visualizations, and take your VoC survey data analysis to the next level.
How much did you enjoy this article?


Google Forms to Google Sheets keeps your data organized and current with every submission. Learn the steps, methods, and tips now!

Product survey questions reveal what customers truly think. Learn how to ask the right ones and act on the survey results. Read on!

Learn how the 5-Point Performance Rating Scale improves employee evaluations with clear, consistent, and fair performance reviews across teams.


