Categories
Survey Ideas are the catalysts for unlocking the full potential of data collection.
In today’s world, knowledge is the key to success. However, this is also an era in which disseminating falsehoods and unproven hypotheses is simpler than ever. Critical business decisions must be based on facts, not speculation or the opinions of others.


So, how do we gather reliable data most straightforwardly and efficiently?
You may learn a lot about your target market and discover their thoughts on your business, products, and services by conducting surveys.
We often make judgments based on what we think is right rather than what is true. We fantasize about doing what pleases us and what our ideal selves would do, but things rarely go as planned.
Decisions based on assumptions can lead to significant financial losses, especially in a corporate context. Trying to reach your target audience on Instagram when they’re all on Twitter would be crazy.
Nonetheless, be sure you’re asking about the right things in your surveys. This blog will examine why survey ideas are essential during your research.
In this blog, you will learn:
Definition: A survey idea refers to a fundamental concept or subject matter that provides the framework for developing and implementing a survey.
The process entails the identification of a research question or objective, determining the intended audience, and creating a set of survey questions that will facilitate the collection of pertinent and valuable data.
Creativity in surveys involves going beyond traditional question-and-answer formats, making the process more engaging, insightful, and enjoyable for participants.
This approach is particularly important in longitudinal surveys, where maintaining participant interest over time is crucial. Here are key elements that contribute to making surveys creative:
One potential method for gauging customer satisfaction is to conduct a campaign wherein customers are asked to provide feedback regarding their likelihood of recommending a product or service to others in their personal or professional networks.
The user will receive insights regarding the number of promoters, passives, and detractors they possess. Conversely, to obtain more comprehensive insights, conclude with a handful of open-ended inquiries.
Inquire about the level of customer satisfaction regarding the products and services provided. Augmenting the inquiry above with a couple of open-ended queries is advisable. It is imperative to ensure that customers are comfortable interacting with your organization.
The consumer experience must be a top priority. Research indicates that consumers tend to repeat purchases with a brand that provides them with low-effort expertise, as revealed through an effective survey data collection method, instead of switching to a less expensive competitor.
Customers come and go, and some will always be disappointed and leave. It’s OK, but learning why they leave would serve you well. Test the waters to see if your product is getting good reviews.
The following are five innovative survey ideas that may serve as a source of inspiration for enhancing business decision-making while simultaneously engaging the customer base.
The most effective kind of advertising is word of mouth. Consumers put more faith in people than in companies. The effectiveness of paid media is discounted by a factor of 5. Friends’ recommendations account for 90% of all purchases made by consumers. Five million unique monthly users access G2 reviews.
Writing a blog requires a steady stream of original content. Innovative ideas often come from consumers. They will be interested in what you offer if their friends recommend it to them.
An influential article can be predicted using analytics data. User apathy cannot be understood by analyzing the data. Pre-made survey formats collect valuable qualitative data for better analytics.
After releasing your updated product or service to customers, ensure they are still happy. Problems should be solved before they become significant issues.
It’s vital to verify who your customers are. Many businesses miss out on selling to the most in-demand customer segments because their efforts must be directed.
Here are those questions that allow you to create surveys quickly, which can be of great assistance. Here are some potential ideas for your survey:
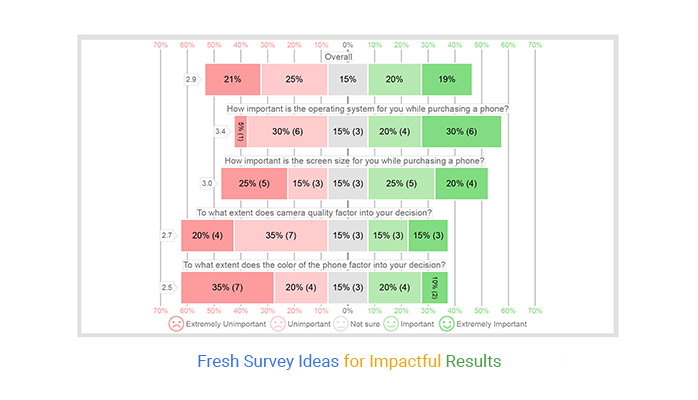
Suppose you want to introduce a mobile device. Before taking any action, it is imperative to have a clear understanding of the preferences and needs of one’s clientele. To this end, an online survey was conducted using Google Forms, and the resulting data was compiled and organized in an Excel spreadsheet. The data will be presented in the following format.
Now, let’s examine the scale that corresponds to these queries.
Write a query on “Untitled Question.” For adding options, write “Option 1” and “Add option” for additional options.
To send your form to the intended recipients, click the Send icon.

After collecting all of the responses. Select the option represented by three vertical dots adjacent to the “Link to Sheets” feature.

This will create a dropdown menu to download your responses as a CSV file.

The neatly organized tables in Excel can’t compare to interactive visualization. Although Excel can analyze and display data, it may need more survey data visualization capabilities.
Excel’s graphics, particularly those of Likert Scale Charts, can be enhanced with the help of third-party add-ons like ChartExpo.
How to install ChartExpo in Excel?
ChartExpo charts can be accessed on both Google Sheets and Microsoft Excel platforms. Kindly utilize the provided Call-to-Actions (CTAs) to install your preferred tool, enabling you to generate aesthetically pleasing visual representations with minimal effort within your preferred platform.
Read on to learn how to use ChartExpo to make eye-catching visualizations in Excel.
This data needs to be converted to the following format before it can be analyzed in Excel.
| Timestamp | How important is the operating system for you while purchasing a phone? | How important is the screen size for you while purchasing a phone? | To what extent does camera quality factor into your decision? | To what extent does the color of the phone factor into your decision? |
| 10-13-2023 17:47:33 | Extremely Important | Important | Extremely Important | Not Sure |
| 10-13-2023 17:47:33 | Important | Extremely Important | Not Sure | Important |
| 10-13-2023 17:47:33 | Important | Extremely Unimportant | Unimportant | Extremely Important |
| 10-13-2023 17:47:33 | Important | Extremely Important | Extremely Unimportant | Extremely Unimportant |
| 10-13-2023 17:47:33 | Unimportant | Important | Unimportant | Not Sure |
| 10-13-2023 17:47:33 | Extremely Important | Extremely Important | Extremely Important | Unimportant |
| 10-13-2023 17:47:33 | Unimportant | Extremely Unimportant | Extremely Unimportant | Important |
| 10-13-2023 17:47:33 | Unimportant | Important | Not Sure | Unimportant |
| 10-13-2023 17:47:33 | Extremely Important | Important | Unimportant | Extremely Unimportant |
| 10-13-2023 17:47:33 | Extremely Important | Not Sure | Unimportant | Extremely Unimportant |
| 10-13-2023 17:47:33 | Important | Unimportant | Important | Unimportant |
| 10-13-2023 17:47:34 | Extremely Unimportant | Unimportant | Not Sure | Important |
| 10-13-2023 17:47:35 | Not Sure | Important | Unimportant | Important |
| 10-13-2023 17:47:36 | Not Sure | Extremely Important | Important | Unimportant |
| 10-13-2023 17:47:37 | Unimportant | Not Sure | Unimportant | Extremely Unimportant |
| 10-13-2023 17:47:38 | Not Sure | Extremely Unimportant | Extremely Unimportant | Extremely Important |
| 10-13-2023 17:47:39 | Extremely Important | Extremely Unimportant | Important | Not Sure |
| 10-13-2023 17:47:40 | Unimportant | Not Sure | Extremely Important | Extremely Unimportant |
| 10-13-2023 17:47:41 | Unimportant | Extremely Unimportant | Extremely Unimportant | Extremely Unimportant |
| 10-13-2023 17:47:42 | Extremely Important | Unimportant | Unimportant | Extremely Unimportant |
This table contains example data. Expect many responses and questions in real life.


Provide tangible rewards or incentives to customers who complete the survey, such as discounts, coupons, or entries into a prize draw. This can increase participation rates by giving customers a clear benefit for their time and effort.
Communicate why their feedback is valuable and how it will be used to improve products or services. When customers understand that their opinions can directly impact future experiences, they may be more inclined to participate.
Respect your customers’ time by keeping the survey short and focused. Use clear and concise language, and avoid asking unnecessary or overly complex questions. Shorter surveys are more likely to be completed in full.
Tailor survey invitations to the individual customer whenever possible. Address them by name, and customize the content based on their past interactions or preferences. Personalized invitations can make customers feel valued and more likely to respond.
Clearly outline the benefits of taking the survey, such as improving products, shaping future offerings, or receiving better customer service. By emphasizing how their feedback will directly benefit them or others, you can encourage participation.
Timing is crucial when asking customers to take a survey. Avoid sending survey requests during busy or inconvenient times, such as peak business hours or holiday seasons. Instead, choose times when customers are more likely to have the time and inclination to participate.
Send friendly reminders to customers who have not yet completed the survey. A gentle nudge can serve as a helpful reminder and prompt them to take action.
Thank customers for their participation and feedback, regardless of whether they completed the survey or not. Expressing genuine appreciation can leave a positive impression and encourage future engagement.
The top 5 good survey questions you ask yourself before sending out a survey are;
There you have it. If you stick to those 5 questions, you’ll have a solid foundation to build your survey.
Some good survey topics include:
Surveys are an effective instrument for acquiring data from a particular demographic, enabling businesses to amass significant information and perspectives that can be utilized to guide judgments and tactics. Creating unambiguous, concise, and pertinent surveys would allow researchers to acquire reliable and valuable data, facilitating their research goals.
Acquiring knowledge of the concept of a business survey and its methodology can enhance an organization’s decision-making quality. Business surveys can reveal market preferences and behaviors, helping companies design growth strategies.
To reach important people, clear and focused queries and several distribution methods are essential. A well-designed survey and a little effort can give us valuable insights. In turn, this can help us make informed decisions and succeed in any endeavor.
How much did you enjoy this article?


Google Forms to Google Sheets keeps your data organized and current with every submission. Learn the steps, methods, and tips now!

Product survey questions reveal what customers truly think. Learn how to ask the right ones and act on the survey results. Read on!

Learn how the 5-Point Performance Rating Scale improves employee evaluations with clear, consistent, and fair performance reviews across teams.


