Categories
By ChartExpo Content Team
Data is changing how companies manage their employees. HR analytics takes workforce data and turns it into clear insights. Instead of guessing why employees leave or how hiring decisions impact productivity, companies use real numbers to make informed choices.
HR analytics answers critical questions. How long does it take to hire top talent? What factors impact employee satisfaction? Why do some teams perform better than others? This data-driven approach removes bias, reduces risks, and improves workforce planning.


Companies that use HR analytics build stronger teams. They track trends, spot patterns, and adjust strategies before small issues become big problems. Hiring, retention, and performance management all improve when decisions are backed by data.
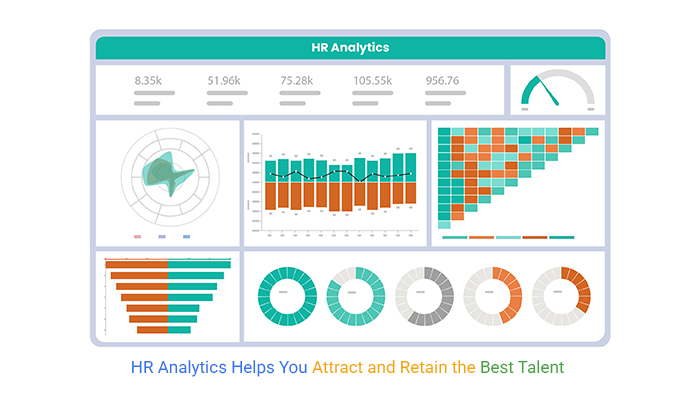
Learn how HR analytics is shaping the future of work.
First…
HR analytics is the process of using employee data to guide decisions. It helps companies measure workforce trends, predict future needs, and improve HR strategies. By analyzing patterns, businesses can enhance hiring, engagement, and retention.
The goal is to turn raw data into useful insights. Companies track metrics like turnover, productivity, and employee satisfaction. These numbers help HR leaders make data-backed choices instead of guessing.
HR analytics relies on tools like dashboards and reports. These tools organize data into clear visuals. Leaders can spot trends, identify problems, and act fast to fix them.
HR analytics makes HR more than just paperwork and policies. It helps align workforce planning with business goals. Leaders can track hiring success, monitor workforce health, and spot risks before they grow.
Predictive analytics takes this further. It forecasts talent shortages, turnover risks, and future hiring needs. Companies can prepare instead of reacting.
Data-driven HR also strengthens diversity, inclusion, and workforce planning. By tracking hiring trends and pay gaps, businesses create fairer workplaces. The result is smarter decisions, better employee experiences, and stronger company performance.
An HR metrics dashboard organizes key workforce data in one place. It displays hiring trends, turnover rates, engagement scores, and productivity levels. HR leaders get a quick view of workforce health.
A well-built dashboard shows patterns over time. It highlights warning signs, such as rising absenteeism or high turnover in certain departments. Leaders can act before problems get worse.
Dashboards make data easy to read. Graphs, bar charts, and trend lines help HR teams understand workforce shifts. Instead of digging through spreadsheets, they see insights at a glance. This speeds up decision-making and keeps HR strategies sharp.
Talent analytics is critical in recruitment. It uses data-driven insights to improve hiring quality. How? By identifying the traits of high-performing employees. Companies can then look for these traits in potential hires. This targeted approach reduces the chances of bad hires.
Moreover, talent analytics helps in crafting personalized onboarding programs. Customized programs make new hires feel valued. This increases their engagement and retention rates. Analytics also identifies the best channels for recruiting top talent. This ensures that recruitment efforts are not wasted on unproductive sources.
Finally, talent analytics aids in succession planning. It identifies potential leaders early. This allows for timely development programs, preparing them to take on crucial roles. This proactive approach not only secures the company’s future but also motivates employees by showing a clear career path.
Performance optimization in HR focuses on enhancing employee output. How? By identifying key performance indicators (KPIs) that align with business goals. HR analytics tracks these KPIs to pinpoint areas needing improvement. This approach ensures efforts focus where they impact the most.
Feedback mechanisms are also crucial. Regular, data-backed feedback helps employees understand their performance. This transparency motivates employees to improve. It also fosters a culture of continuous development.
Additionally, HR analytics identifies high-performing individuals and teams. Understanding what contributes to their success can help replicate these practices across the company. This elevates overall performance, pushing the company towards its strategic goals.
Cost control is crucial for any business. HR metrics and analytics play a pivotal role here. They enable precise tracking of all HR-related expenses. This includes recruitment costs, training expenses, and salary payouts.
By analyzing these costs, companies can identify areas where expenses can be reduced without impacting employee satisfaction.
For instance, analytics might reveal that certain recruitment channels are more cost-effective. Companies can then allocate more resources to these channels, reducing overall recruitment costs. Similarly, data might show that virtual training is just as effective as in-person sessions but at a fraction of the cost.
Furthermore, analytics can predict when to hire temporary workers to handle workload peaks, avoiding the higher costs of overtime or additional full-time salaries. This strategic use of temporary staffing ensures productivity without unnecessary expenditure.
The Pareto chart is based on the 80-20 rule. It is a visual tool essential for HR analytics. It helps identify the few critical factors that drive the majority of results. In HR, this could mean pinpointing a small set of competencies that lead to high performance. Understanding these key factors allows companies to focus their development efforts more effectively.
This chart’s clarity in displaying data helps in data-driven decision-making. It highlights the areas that need the most attention, thereby optimizing resource allocation. For instance, if a Pareto Chart shows that 20% of leadership behaviors influence 80% of team performance, training can focus specifically on those behaviors.
Incorporating the Pareto Chart in HR analytics simplifies complex data. It makes it easier to communicate important information across the organization. This ensures that decision-makers and stakeholders are on the same page, facilitating more effective workforce management.
An interactive HR metrics dashboard is vital for any HR leader. It allows for the dynamic tracking of key workforce indicators. This kind of dashboard supports quick and informed decisions.
Real-time data updates are a standout feature. They provide leaders with the most current information. This is crucial for managing a dynamic workforce effectively.
The dashboard also promotes transparency within the organization. It does this by making data accessible to all stakeholders. This accessibility helps in aligning the workforce strategy with business objectives.
Customizing data views is key in meeting the unique needs of different users. Executives might need high-level data. This includes financial impacts and workforce demographics. Managers might need more detailed reports. These focus on team performance and individual metrics.
HR teams require a mix of both. They need detailed data to manage daily operations. They also need strategic data for planning purposes. Custom views ensure that each group gets relevant and actionable insights.
This customization enhances the functionality of the HR dashboard. It turns it into a versatile tool that meets diverse needs.
Spotting trends in HR data is crucial. It involves comparing real-time data with historical data. This comparison helps in identifying patterns that could impact future HR policies and strategies.
Real-time data offers immediate insights. It is essential for urgent decision-making. Historical data provides a broader perspective. It shows how trends have evolved over time.
Using both types of data, HR professionals can develop more accurate forecasts. They can also tailor their strategies to meet future challenges.
A multi-axis line chart is effective for comparing hiring trends over time. This chart uses multiple axes to show different data sets in the same view. It provides clear visual insights into how different hiring metrics interact over time.
The chart’s dual axes might display the number of hires against time and the cost per hire. This visualization helps identify correlations. For example, it can show if an increase in hiring efforts leads to a higher cost per hire.
Multi-axis line chart is invaluable for HR leaders. It aids in assessing the efficiency of hiring processes. It also supports strategic planning by highlighting trends that could affect future hiring.
The following video will help you create a Sankey Chart in Microsoft Excel.
The following video will help you to create a Sankey Chart in Google Sheets.
The following video will help you create a Sankey Chart in Microsoft Power BI.
Employee engagement is vital for a thriving workplace. HR analytics tools measure engagement through surveys, performance metrics, and feedback channels. By analyzing this data, HR can pinpoint areas that need improvement. Strategies such as recognition programs and career development opportunities can then be implemented to enhance employee satisfaction and productivity.
Workforce planning with HR analytics involves analyzing current workforce data to forecast future staffing needs. This predictive approach helps organizations prepare for changes and maintain operational efficiency. HR can identify skills gaps, anticipate retirements, and plan for growth, ensuring the right number of employees with the right skills are available when needed.
Retention strategies are crucial in maintaining a stable workforce. HR analytics helps identify patterns and predictors of employee turnover. Factors such as job satisfaction, workload, and manager relationships are analyzed to determine risk levels. Tailored retention programs can then be designed to address these risks, keeping valuable talent within the company.
A Sankey diagram shows how employees move within an organization. It uses flow lines of varying widths to represent transitions between departments, roles, or exit points. The wider the line, the greater the movement in that direction. The chart helps HR teams see hiring trends, promotions, and turnover patterns.
This visual tool makes it easy to track workforce changes. It highlights where employees stay, where they leave, and what roles they shift into. HR teams can identify retention issues and see if internal mobility supports career growth. If many employees leave a specific role, it signals a problem. If movement between departments is balanced, internal opportunities may be strong.
The Sankey diagram simplifies complex workforce data. Instead of sifting through spreadsheets, HR professionals can instantly spot retention risks. Leaders can use this insight to adjust hiring strategies, improve job satisfaction, and boost retention. It also helps predict future workforce trends, ensuring the organization is prepared for shifts in employee flow.
The art of sourcing candidates transforms with HR analytics. Traditional methods often rely on intuition, but data provides a factual basis. HR teams use analytics to track where the best candidates come from and why they succeed.
This speeds up the sourcing process significantly. It reduces the time spent on less effective recruitment channels, focusing efforts where the highest return on investment exists.
Artificial intelligence (AI) in hiring processes tackles bias head-on, promoting fairness. By employing algorithms trained on diverse data sets, businesses ensure decisions are based solely on relevant qualifications, not unconscious biases.
This use of AI aids in creating a more inclusive workforce. It also helps firms comply with equal employment opportunity laws more effectively.
Predicting a candidate’s success is now more accurate with HR analytics. By examining patterns in data from previous hires, predictive models assess potential job performance.
These insights allow HR professionals to make informed decisions. They also tailor onboarding processes to individual needs, boosting initial productivity and long-term retention.
A funnel chart shows how candidates move through hiring stages. The chart starts wide at the top, representing all applicants. As candidates move forward, the chart narrows, highlighting drop-offs at each stage. The shape reveals bottlenecks and inefficiencies in the recruitment process.
This visual helps hiring teams pinpoint where candidates exit the pipeline. If many drop out after interviews, it may signal a problem with assessments or expectations. A steep drop between application and screening suggests unqualified applicants or poor job descriptions. Spotting these issues early helps recruiters fix weak spots.
The funnel chart makes hiring data easy to read. Instead of scanning reports, recruiters see hiring flow at a glance. This allows for quick adjustments, better candidate experiences, and smarter hiring decisions. If certain job roles show high rejection rates at specific steps, teams can refine criteria or improve outreach efforts.
Real-time feedback is revolutionizing how we approach employee appraisals. This system allows managers to provide immediate responses to employees, addressing issues and highlighting achievements as they occur.
Such timely feedback proves more effective than the traditional annual review, which often relies on outdated information.
Implementing real-time feedback systems involves regular check-ins and the use of mobile apps or platforms where feedback can be given instantly. This approach ensures that employees always know how they’re doing, which motivates continuous improvement and helps maintain morale.
Moreover, real-time feedback allows for personalized development plans. Each employee’s strengths and areas for improvement are regularly updated, providing a tailored growth path that aligns with both individual and organizational goals.
Identifying top talent within an organization is crucial for maintaining a competitive edge. HR data analytics plays a pivotal role in spotting these high performers by analyzing patterns and outcomes across various metrics. These metrics might include project completion rates, leadership activities, and innovation contributions.
By leveraging data analytics, HR professionals can pinpoint which employees are not only excelling in their current roles but also demonstrating potential for future leadership positions.
This proactive approach in talent management ensures that high performers are engaged and given opportunities to grow within the company, thereby increasing retention.
Furthermore, recognizing and nurturing top talent contributes to a positive workplace culture. It signals to all employees that hard work and innovation are noticed and rewarded.
To effectively close the skills gap within an organization, HR professionals must develop targeted employee development plans. These plans, informed by comprehensive HR analytics, identify the specific skills that are lacking and provide a roadmap for acquiring them.
HR analytics help in mapping out career trajectories and the necessary competencies for each role within the company. By understanding these requirements, HR can create personalized learning and development programs that not only address current skill shortages but also prepare employees for future challenges.
Implementing these data-backed development plans helps ensure that the workforce evolves in tandem with the changing demands of the industry, thus maintaining organizational competitiveness and employee satisfaction.
A scatter chart is an effective visual tool in HR analytics for correlating employee performance with retention rates. This chart plots individual performance against the length of tenure, revealing trends and outliers in the data.
By examining this plot, HR professionals can identify if high performers are staying with the company or leaving.
The scatter plot provides clear visual insights that help in understanding the impact of performance management on employee retention. For example, if high performers are frequently exiting the organization, it might indicate issues in career progression or job satisfaction that need addressing.
Using this chart, organizations can more effectively fine-tune their HR strategies to not only boost performance but also enhance retention, ensuring that top talent remains within the fold. This strategic use of data supports better decision-making and more effective HR practices overall.
HR dashboards offer a valuable tool to detect potential resignations early. They track employee engagement, satisfaction, and performance metrics. Spotting dips in these areas can alert managers to intervene before it’s too late. This timely response can prevent the loss of valuable talent and the associated costs of replacing them.
Effective retention strategies focus on employee needs and preferences. Tailored benefits, flexible schedules, and career development opportunities are key. By addressing these areas, companies can boost morale and loyalty. This personalized approach makes employees feel valued, encouraging them to stay longer.
Reviewing exit interviews and turnover patterns can provide crucial insights. Understanding why employees leave helps in crafting better retention strategies. This reflection leads to improved practices that resonate with current staff, fostering a more committed workforce.
A clustered column chart displays turnover rates across departments. Each bar represents a department, making it easy to compare exit rates. Taller bars indicate higher turnover, while shorter ones suggest stability. The side-by-side layout helps HR teams spot patterns and variations in employee retention.
This chart highlights which departments struggle with high attrition. If one team has a higher turnover rate, HR can investigate issues like workload, leadership, or job satisfaction. A sudden increase in exits may point to recent changes in management or policies. Comparing departments side by side makes these trends visible without complex reports.
The visual clarity of a clustered column chart improves decision-making. HR leaders can use this insight to address retention problems, adjust hiring strategies, or improve workplace conditions. If certain teams show low turnover, their practices can serve as a model for other departments. Data-driven adjustments help organizations retain employees, reducing hiring costs and disruptions.
Pay equity analysis is critical in promoting fairness and compliance in the workplace. HR analytics tools play a vital role here by providing data-driven insights that spotlight wage discrepancies. These tools analyze salaries and roles to ensure equal pay for equal work, adhering to legal standards.
The process starts by grouping employees with similar roles and qualifications. The analytics system then compares their compensation packages. Discrepancies are flagged for further investigation. This methodical approach helps organizations maintain fairness and transparency in compensation.
Addressing these gaps not only ensures compliance but also boosts employee morale and retention. Workers feel valued and treated fairly, fostering a more productive work environment.
Linking performance to compensation is a strategy that drives employee engagement and business results. Workforce metrics and analytics provide a clear picture of individual contributions. This transparency helps in creating fair and motivating compensation plans.
Performance metrics typically include sales numbers, customer service ratings, and production outputs. HR analytics tools integrate these metrics with compensation data to ensure direct correlations. High performers can see how their efforts translate to financial rewards, enhancing motivation.
This approach also helps HR teams adjust compensation plans based on changing business goals or market conditions. It ensures that compensation strategies remain aligned with company objectives and employee performance.
Staying competitive in the labor market is crucial for attracting and retaining top talent. HR analytics tools equip companies with the latest market data on salary and benefits. This information is essential for benchmarking compensation packages against industry standards.
These tools pull data from various external surveys and reports, providing an up-to-date overview of industry compensation trends. HR teams can compare their company’s salary ranges with those of competitors. This comparison helps identify strengths and areas for improvement in their compensation strategies.
Regularly updating compensation packages based on market data ensures that a company remains an attractive employer. It also prevents turnover due to compensation issues, preserving valuable human capital.
The Slope Chart is an effective visual tool for tracking changes in compensation over time. It illustrates individual or group salary progression, highlighting growth trends or disparities. This visual representation helps HR professionals quickly grasp shifts in pay scales across the organization.
The Slope Chart’s clarity and straightforward layout make it an excellent tool for presentations to management or stakeholders. It shows where investments in human capital are growing and where adjustments might be needed. This insight is vital for strategic planning in HR management.
By embedding the Slope Chart in HR discussions, companies can ensure that compensation practices are aligned with long-term strategic goals. It also supports transparency and accountability in compensation management, strengthening trust within the organization.
Determining the return on investment (ROI) for training programs is crucial for any business. HR data analytics plays a pivotal role in this process by tracking the performance of employees before and after undergoing training. This comparison highlights the direct benefits of specific learning initiatives.
Analytics tools measure key metrics such as productivity changes, quality of work, and employee retention rates. These indicators help identify which programs are effective and which might need a revamp. It’s about linking training efforts directly to business outcomes, showing tangible results that justify the investment.
Effective measurement of ROI not only validates the existing programs but also guides future training developments. It ensures that companies invest in programs that truly enhance employee skills and contribute to organizational success.
HR data analytics excels in pinpointing skills gaps within an organization. By analyzing current workforce capabilities and comparing them with industry standards or future needs, analytics identify where gaps exist. This process involves detailed data collection from performance reviews, surveys, and regular assessments.
Once identified, HR professionals can focus on developing targeted training programs to bridge these gaps. This proactive approach not only enhances individual employee performance but also ensures that the organization can adapt to changing industry demands.
Addressing skills gaps is a strategic move that boosts internal mobility and employee satisfaction. It shows a commitment to employee development, fostering a more engaged and competent workforce.
Personalized learning is transforming professional development. By using HR analytics, companies can tailor learning experiences to individual employee needs, career aspirations, and learning styles. This approach increases the effectiveness of training programs and enhances employee engagement.
Data analytics help identify what skills each employee excels in and where they could improve. This insight allows for the creation of customized learning paths that are both challenging and rewarding. Personalized plans cater to different learning paces and styles, making training more enjoyable and effective.
The shift towards personalized learning shows a commitment to nurturing each employee’s potential. It leads to higher job satisfaction and loyalty, ultimately contributing to lower turnover rates.
The Stacked Area Chart is an excellent tool for visualizing the impact of training investments over time. This chart layers data about training costs against metrics of workforce performance, providing a clear visual of how investment correlates with improvement.
This data visualization helps stakeholders see the direct and indirect benefits of training expenditures. For instance, a rise in investment in new technologies training might correlate with improved productivity and innovation among employees. The chart’s clarity and visual appeal make it an effective tool for presenting complex data in an accessible way.
By leveraging the Stacked Area Chart, organizations can better communicate the value of their training efforts. This aids in strategic planning and securing budget approval for future training initiatives.
AI-driven workforce planning is essential for HR professionals. It uses data and machine learning to forecast staffing needs. This tool is essential for effective talent management and strategic planning.
By analyzing current data, AI predicts future trends in employee turnover. It also forecasts hiring needs. This foresight helps companies prepare and adapt their workforce strategies proactively. It ensures they have the right people with the right skills at the right time.
Moreover, this technology identifies skill gaps within the organization. It guides training programs, enhancing employee performance and satisfaction. This proactive approach reduces recruitment costs and improves workforce agility.
Automating administrative tasks in HR leads to better efficiency and accuracy. Routine tasks such as payroll processing, time tracking, and employee data management are automated. This change frees up HR professionals to focus on more strategic initiatives.
Automation reduces the risk of errors that can occur with manual processing. It ensures compliance with employment laws and regulations. Automated systems provide real-time data access, making HR responses more agile.
The result is a more streamlined HR department. It is more responsive to employee needs and organizational changes. This efficiency supports a better work environment and overall company performance.
The use of AI in HR must balance automation with human decision-making. Ethical considerations are vital. They ensure that AI tools are used responsibly.
AI systems should be transparent and unbiased. They must respect employee privacy and adhere to data protection laws. HR professionals must oversee AI decisions. They ensure these decisions align with the company’s ethical standards and values.
Training HR staff on ethical AI use is crucial. It ensures they are prepared to manage these powerful tools responsibly. This balance between human oversight and automation fosters trust and fairness in HR practices.
The multi-axis spider chart effectively visualizes AI adoption levels across various HR functions. It shows at a glance which areas are leveraging AI and to what extent. This visual tool is invaluable for strategic planning and resource allocation.
The chart’s clear, web-like structure allows for easy comparison between different HR areas. It highlights strengths and gaps in AI adoption. This insight guides decision-makers on where to focus their efforts and investments.
By embedding this chart in the discussion, it reinforces the importance of a balanced AI strategy in HR. It aids in understanding complex data patterns and supports better decision-making. The chart is a crucial tool in visualizing and strategizing AI integration in HR functions.
Disconnected data sources result in incomplete workforce insights. Without a unified view, HR can’t see the full picture. This leads to decisions that might not support the company’s goals.
Connecting all HR data ensures that decisions are based on complete and accurate information. This alignment increases efficiency and effectiveness in managing workforce resources.
Centralizing HR metrics starts with choosing the right technology. This technology should integrate seamlessly with existing systems. It should also be scalable to adapt to future needs. Training HR staff to use new systems is essential. They need to understand how to extract and interpret the unified data. Regular audits ensure the system remains effective and aligned with business goals.
The future of HR is highly integrated with analytics. Advanced analytics tools will predict trends and improve decision-making. These systems will use AI to provide deeper insights into workforce management. The integration of these tools with HR systems will automate and optimize many HR tasks. This leads to more strategic and data-driven decision-making in HR practices.
A co-occurrence chart reveals how different HR data sources connect. It visually maps the overlap between workforce metrics, such as payroll, performance, engagement, and hiring trends. The chart uses nodes and links to display relationships between datasets.
The advantage of this chart is its ability to highlight redundancies. If payroll and performance systems track similar metrics separately, the overlap becomes clear. HR teams can then merge data points, reducing errors and improving efficiency.
Another key benefit is its clarity. Instead of sorting through spreadsheets, HR leaders see workforce relationships in one glance. The chart simplifies complex data, making decision-making easier and faster.
A co-occurrence chart helps HR teams eliminate duplicate efforts. By identifying overlapping data sources, HR can streamline analytics, reducing the time spent reconciling mismatched reports.
When HR analytics merges with business intelligence, the impact multiplies. This union provides a holistic view of company health. HR data combined with business metrics guides better decision-making. It highlights areas needing attention, like workforce productivity or employee satisfaction.
This synergy supports a data-driven culture, fostering smarter business strategies.
NLP and sentiment analysis reveal the true feelings of employees. These tools interpret what employees say and how they feel. This tech spots trends in employee feedback, aiding in improving workplace conditions.
By analyzing the tone and choice of words, companies address issues before they escalate. This proactive approach boosts employee satisfaction and retention.
AI-powered dashboards provide real-time insights for swift decision-making. These dashboards display key HR metrics at a glance. Leaders make informed decisions quickly, responding to data trends in real time. This agility is crucial in a fast-paced business environment. It ensures that HR operations stay aligned with overall business goals.
A Sunburst Chart presents employee sentiment in a layered, circular design. The center represents overall company sentiment, while outer rings break down data by department, team, or job role. Each section is color-coded for easy interpretation.
This layout makes it simple to see variations in sentiment across different levels. Departments with declining engagement stand out instantly. The chart’s structure allows HR to track sentiment trends without digging through spreadsheets.
The biggest advantage is its ability to display hierarchical data in a single view. HR leaders can compare sentiment between teams and trace issues to their source. Instead of analyzing isolated survey responses, decision-makers see patterns across the organization.
The Sunburst Chart helps HR leaders make sense of large sentiment datasets. Instead of focusing on individual survey responses, they see how sentiment shifts across the company. If one department shows a decline, HR can pinpoint where to focus engagement efforts.
HR analytics turns workforce data into clear insights. It removes guesswork from hiring, retention, and performance management. Companies using data effectively can predict talent needs, reduce turnover, and create fairer workplaces.
Strong HR analytics lead to better hiring. They track what works and what doesn’t, preventing costly mistakes. They also help companies retain top talent by spotting risks early. A proactive approach to workforce planning ensures the right people are in place before gaps appear.
HR teams don’t need to rely on assumptions. Real-time dashboards, AI insights, and predictive models make workforce planning smarter and faster. Businesses that embrace data will stay ahead, making informed choices that benefit employees and company growth.
The future of HR belongs to those who use data wisely.
How much did you enjoy this article?


Calculate accounts receivable turnover ratio to measure credit collection speed, improve cash flow, and strengthen your financial strategy. Read on!

Change Management KPIs are the key to tracking adoption, performance, and ROI during transitions. Find out which metrics matter. Read on!

Data collection methods and techniques determine the quality of every insight you act on. Explore key approaches for gathering reliable data. Read on!


