Categories
By ChartExpo Content Team
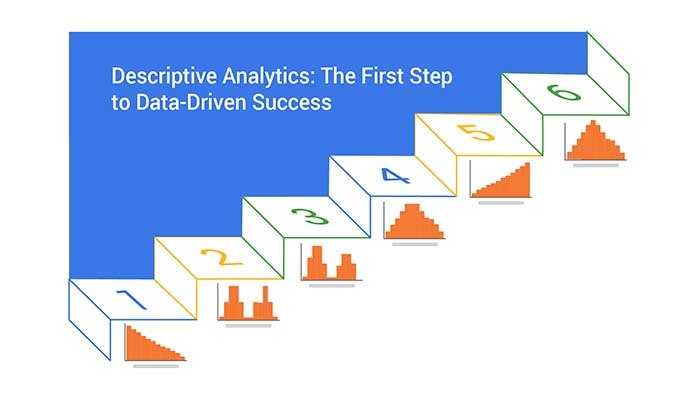
You want to make sense of the mountain of data piling up, right? Descriptive Analytics is your ticket to understanding what’s happening in your business. It’s not about predictions or fancy algorithms; it’s about getting a clear picture of your current situation.
Descriptive Analytics turns raw data into useful insights. Imagine looking at a dashboard showing your sales trends, customer behaviors, or website traffic. This data-driven approach helps you see patterns and understand your operations better. You can spot what’s working and what needs fixing.
With Descriptive Analytics, you can transform data into stories that reveal your business’s true performance. By examining historical data, you gain insights into past behaviors and outcomes. This helps in making informed decisions and crafting effective strategies.
So, if you’re looking to get a handle on your data, Descriptive Analytics is where you start.
First…
Descriptive Analytics is about summarizing past data to understand what has happened. It’s the process of collecting, processing, and analyzing data to provide insights into historical trends and patterns. This helps organizations make data-driven decisions based on past performance.
Imagine having a detective at your disposal, uncovering hidden patterns in your data. Descriptive Analytics sifts through vast amounts of information, identifying trends and insights you might miss. It’s the first step in making data-driven decisions.
In business, guessing isn’t enough. Descriptive Analytics turns guesswork into certainty. By analyzing past performance, you gain a clear picture of what works and what doesn’t, leading to better decisions and strategies.
Staying ahead in today’s market requires more than intuition. Descriptive Analytics gives you a competitive edge by providing a detailed analysis of your data. This means you can anticipate trends, understand customer behavior, and make informed decisions that put you ahead of your competitors.
Descriptive Analytics isn’t limited to one industry. It’s transforming sectors from healthcare to retail. By examining past data, including insights from Customer Journey Maps, these industries can improve services, boost efficiency, and enhance customer satisfaction.
Descriptive Analytics, including Visual Analytics, finds applications across various business functions. In the boardroom, it informs strategic decisions. On the factory floor, it optimizes processes. Understanding its versatility helps you see its value in every aspect of your business.
The world of Descriptive Analytics is driven by skilled professionals. Data analysts, data scientists, and IT specialists all play vital roles. Their expertise turns raw data into actionable insights.
Everyone in the business benefits from mastering Descriptive Analytics. Analysts provide insights, managers make informed decisions, and executives steer the company in the right direction. It’s a team effort that drives success and helps avoid Analysis Paralysis, ensuring that decisions are made efficiently and effectively.
Forget the jargon. Descriptive Analytics is about understanding what happened in your business. It involves summarizing past data to find patterns and trends. Think of it as the first step in your data journey.
Descriptive Analytics, including tools like the Treemap graph, is the foundation of the analytics hierarchy. It’s where you start before moving on to predictive or prescriptive analytics. By knowing where you’ve been, you can make better decisions about where to go next.
Some say Descriptive Analytics is old news, but that’s not true. It’s still vital because it provides the baseline from which other analyses are built. You can’t predict the future if you don’t understand the past.
Descriptive Analytics sets the stage for more complex analysis. Establishing a clear picture of historical data empowers more advanced techniques like predictive and prescriptive analytics to be more accurate and effective. Additionally, as a data democratization tool, it enables broader access to data insights, making it easier for non-experts to engage with and interpret key trends.
Many businesses have hit the jackpot using Descriptive Analytics. For example, retailers analyze past sales to optimize inventory. Healthcare providers study patient data to improve treatment outcomes. Each success story shows the power of understanding your data.
Descriptive Analytics turns insights into actionable steps. By analyzing historical data, companies can improve customer satisfaction, streamline operations, and boost profits. It’s about making informed decisions that lead to real results.
Descriptive and Prescriptive Analytics work hand-in-hand. Descriptive Analytics looks at past data to identify patterns, while Prescriptive Analytics suggests actions based on those patterns. Together, they help you make informed decisions.
Combining Descriptive and Prescriptive Analytics gives you a full picture. Descriptive Analytics tells you what happened, and Prescriptive Analytics tells you what to do about it. This synergy maximizes your data’s value and helps you achieve your business goals.
Your first step is finding the right data. Look at internal databases, customer feedback, sales reports, and even social media. The goal is to gather data that will give you a full picture of your operations and customer behaviors.
Data quality matters. Inaccurate data can lead to wrong conclusions. Check for missing values, duplicates, and inconsistencies. This step is about making sure your data is reliable and accurate.
Clean data is the backbone of reliable analysis. Errors and outliers can skew results, leading you down the wrong path.
Use software tools to detect and correct errors. Techniques include removing duplicates, filling in missing values, and standardizing formats.
Automate repetitive tasks to save time. Scripts and tools can handle most of the cleaning, allowing you to focus on analysis.
Aggregation involves summarizing data to make it more manageable. Group data by categories or periods to find patterns.
Select the right statistics to summarize your data. Mean, median, and mode are basics. Depending on your needs, use more complex measures like standard deviation or quartiles.
Present your findings in a way that suits your audience. Executives might need high-level summaries, while analysts prefer detailed reports.
Experiment with different types of charts and graphs. Sankey Diagrams, Likert Scale charts, and a Scatter plot chart can show various aspects of your data.
Colors can highlight key points and make your data more understandable. Use contrasting colors to draw attention to important areas.
Our brains process visuals 60,000 times faster than text. This speed gives graphs and charts a clear advantage. They transform complex data into easy-to-digest images. This quick understanding can drive action and insight.
Raw data can overwhelm. Visuals cut through the noise, highlighting key points. This clarity turns confusion into comprehension. Simple graphs can reveal trends and outliers that numbers alone might hide.
Choosing the right chart is like picking the right tool. Bar charts compare quantities. Line graphs show trends over time. Pie charts highlight proportions. Each chart type has a unique purpose. Understanding these uses makes your data tell a clearer story.
Maps turn location-based data into powerful insights. Heat maps show concentration areas. Choropleth maps color-code regions by value. These techniques reveal geographic patterns that numbers can’t.
Dashboards offer a snapshot of your data story. They combine multiple visuals into one view. This design helps users see the big picture and spot details quickly. Effective dashboards guide decisions and actions.
Color impacts how we understand visuals. Use contrasting colors to differentiate data points. Stick to a consistent color scheme to avoid confusion. Remember, colorblind-friendly palettes ensure everyone can read your charts.
Space in your visual matters. Avoid clutter. Give elements room to breathe. Use white space to highlight important data. A clean layout directs focus and enhances understanding.
Labels guide readers through your visuals. Use clear, readable fonts. Keep text sizes consistent. Avoid decorative fonts that distract. Effective labels make your data easy to follow.
Misleading visuals can distort the truth. Be wary of truncated axes or skewed scales. Ensure your visuals represent data accurately. Honest visuals build trust.
Design with everyone in mind. Use high-contrast colors for readability. Provide text descriptions for visual content. Accessible designs make your data available to a wider audience.
More data doesn’t always mean better visuals. Overloading a chart can be confusing. Focus on key points. Simplify where possible. Balance detail with clarity for effective visuals.
You can do descriptive analytics in your favorite spreadsheet. Follow the steps below to do descriptive analytics.
The following video will help you to create Descriptive Analytics in Microsoft Excel.


The following video will help you to create Descriptive Analytics in Google Sheets.
Retailers have transformed the way they understand customer behavior. Basket analysis digs into purchase patterns to reveal hidden connections between products. Imagine finding out that people often buy toothpaste and floss together. This insight can drive smarter promotions and product placements, boosting sales effortlessly.
Personalized marketing starts with understanding your customers on a deeper level. By segmenting customers based on their behavior, preferences, and purchase history, retailers can craft targeted marketing campaigns. Think of it as knowing your customers’ DNA, enabling you to send the right message at the right time, making them feel valued and understood.
Inventory management is a puzzle many retailers struggle with. Descriptive Analytics offers a clear picture of stock levels, sales trends, and demand forecasts. This helps in reducing overstock and stockouts, ensuring shelves are always filled with the products customers want. It’s about being smart with stock, turning data into actionable insights.
In healthcare analytics, understanding the patient’s journey is crucial. By mapping out the entire patient experience using data, healthcare providers can identify pain points and streamline processes. This leads to improved care pathways, reduced wait times, and a more efficient healthcare system, ultimately enhancing patient satisfaction.
Hospitals are complex environments with numerous processes. Descriptive Analytics helps in pinpointing inefficiencies and optimizing operations. From scheduling to resource allocation, data-driven decisions lead to smoother operations, reduced costs, and better patient outcomes.
Public health initiatives rely on understanding trends within populations. Descriptive Analytics, including tools like histograms, enables the analysis of large-scale health data to identify patterns and trends. This information is vital for developing effective public health strategies, improving community health, and preventing diseases.
Financial institutions face numerous risks. Descriptive Analytics provides a detailed view of historical data, helping banks identify potential risks and take proactive measures. This approach minimizes losses and ensures financial stability.
Fraud detection is a critical task for financial institutions. By analyzing data patterns, banks can identify suspicious activities and prevent fraud. This not only protects the bank’s assets but also builds trust with customers.
Financial reports and dashboards provide a snapshot of an institution’s performance. Descriptive Analytics helps in creating detailed and accurate reports, enabling better decision-making. These insights help in identifying growth opportunities and improving financial health.
Marketing campaigns need constant evaluation. Descriptive Analytics allows marketers to measure the performance of their campaigns accurately. By understanding what works and what doesn’t, marketers can optimize their strategies for better results.
Social media is a goldmine of data. By analyzing interactions, comments, shares, and insights from YouTube analytics, businesses can gain valuable insights into customer preferences and trends. This helps in crafting more effective social media strategies that resonate with the audience.
Understanding the customer lifecycle is key to building long-term relationships. Descriptive Analytics provides insights into customer behavior at each stage of their journey. This enables businesses to tailor their interactions and keep customers engaged over time.
Manufacturers aim to produce high-quality products consistently. Descriptive Analytics helps in identifying defect patterns and areas for improvement. This leads to better products, fewer defects, and increased customer satisfaction.
A smooth supply chain is vital for manufacturing success. Descriptive Analytics offers a clear view of supply chain operations, helping to identify bottlenecks and inefficiencies. This results in a more coordinated and efficient supply chain.
Maintenance is a major concern for manufacturers. By analyzing historical data, companies can predict when equipment is likely to fail and perform maintenance before issues arise. This prevents downtime and keeps production running smoothly.
Aligning your analytics with business goals ensures your efforts drive meaningful outcomes. Start by understanding your company’s objectives. Are you aiming to increase sales, improve customer satisfaction, or streamline operations? Once clear, tailor your analytics to support these targets. This way, your data doesn’t just sit in a report but actively contributes to achieving business success.
Your questions shape your analysis. Craft queries that dig deep and uncover valuable insights. Avoid vague or broad questions. Instead, be specific and focused. For instance, instead of asking, “How are sales?” ask, “What factors contributed to the 10% increase in sales last quarter?” Specific questions lead to actionable insights, making your analysis more impactful.
Creating a roadmap for your analytics journey helps keep you on track. Start with your objectives, break them down into smaller, manageable goals, and outline the steps needed to achieve each one. Use timelines to keep progress in check and adjust your course as needed. A clear roadmap ensures you stay focused and achieve your analytical goals efficiently.
Vanity metrics might look good on paper, but they don’t drive action. Focus on KPIs that reflect real performance. Look for metrics that align with your business goals and offer actionable insights. For instance, instead of tracking website hits, monitor conversion rates or customer acquisition costs. These KPIs provide a clearer picture of your business’s health.
Tracking too many KPIs can overwhelm you, while too few might miss critical insights. Aim for a balanced approach. Identify the most crucial metrics and focus on them. Usually, 5-10 KPIs and metrics provide a comprehensive yet manageable view of your performance. Regularly review and adjust these KPIs to ensure they remain relevant to your business goals.
KPIs serve as your business’s early warning system. Set benchmarks and monitor them closely. Sudden spikes or drops can signal issues or opportunities. For example, a sudden drop in customer satisfaction might indicate a problem with your product or service. By keeping a close eye on your KPIs, you can address issues promptly and seize opportunities as they arise.
Numbers alone don’t tell the full story. Context is key. Understand the circumstances behind the data. For instance, a sales dip might seem bad, but if it occurred during a known off-season, it makes sense. Always consider external factors and industry trends when interpreting your data. This approach provides a more accurate and insightful analysis.
Biases can skew your analysis. Be aware of common pitfalls like confirmation bias, where you only see what you expect to see. Use techniques like blind analysis, where you review data without knowing the context, to mitigate bias. Peer reviews can also help identify and correct biases. By actively countering biases, you ensure your findings are objective and reliable.
Every analysis should answer the question, “So what?” Translate your findings into clear, actionable recommendations. If data shows a decline in customer satisfaction, suggest specific improvements. Ensure your recommendations are practical and aligned with your business goals. This way, your analysis drives real-world action and results.
Gaps in your data can skew your results. When data is missing, you have a few options. Impute missing values with averages or medians. Sometimes, dropping incomplete records is necessary if they’re too messy. Look for patterns in missing data to understand if there’s an underlying issue. Keep an eye on the impact of these methods on your overall analysis.
Set up a robust system to continually monitor data quality. Automated alerts can notify you of any discrepancies. Regular updates and validations ensure your data stays reliable. Incorporate checkpoints throughout your data lifecycle to maintain high standards.
Dealing with enormous datasets can be overwhelming. Sampling helps manage this by analyzing a representative subset of your data. Techniques like random sampling, stratified sampling, or cluster sampling can provide valuable insights without crunching the entire dataset.
However, be mindful of sampling bias, as it can distort results if your sample isn’t truly representative. Ensure your sample size is sufficient to maintain accuracy and reliability.
Leverage technology to handle large volumes of data. Distributed computing frameworks, like Hadoop, can process massive datasets efficiently. Cloud-based platforms offer scalable solutions to store and analyze your data. Invest in powerful hardware and software to keep your operations running smoothly.
When analyzing large datasets, it’s easy to get lost in details. Balance your approach by focusing on both the big picture and specific insights. Prioritize key metrics and use dashboards to visualize your findings. This approach helps maintain clarity and prevents data overload.
Integrating data from various sources can be tricky. Use data integration tools to merge different datasets seamlessly. Establish data standards to ensure consistency across sources. Regularly update your integration methods to adapt to new data streams.
Encourage a culture of data sharing within your team. Promote transparency and collaboration across departments. Educate your team on the benefits of sharing data, and create incentives for those who contribute. Breaking down silos can lead to richer insights and more effective decision-making.
Different departments may have their own ways of defining data. Establish a universal data dictionary to standardize definitions. Regular training sessions can help maintain consistency. Consistent data definitions ensure everyone is on the same page, leading to more accurate analysis.
Identify the key skills required for your team. Look for individuals with strong analytical abilities, critical thinking, and attention to detail. Soft skills like communication and teamwork are equally important. Ensure your team has a good mix of technical and business acumen.
Invest in continuous learning for your team. Offer training sessions, workshops, and online courses. Encourage team members to stay updated with the latest industry trends. Hands-on projects and real-world scenarios can enhance learning and application of skills.
A successful analytics team needs a balance of technical skills and business knowledge. Ensure your team understands the business context of their work. This approach helps in translating data insights into actionable strategies. Cross-functional training can bridge the gap between technical and business expertise.
Think of sentiment analysis as reading emotions in text. It identifies whether the sentiment is positive, negative, or neutral. By utilizing a text analysis tool to analyze customer reviews, social media posts, or feedback forms, you can gauge public opinion and react accordingly. This method digs deeper into the emotional tone behind the words, providing richer insights into how people feel about your products or services.
Geospatial analysis starts with maps. Plotting data points on a map can reveal patterns and trends that aren’t visible in spreadsheets. Techniques like heat maps show areas with high concentrations of activity, while choropleth maps use different colors to represent data values across regions. These visual tools make geographical data easier to understand and act upon.
Location intelligence combines geographic data with business strategies. It helps in site selection, market analysis, and logistics planning. By integrating geographic insights, businesses can optimize operations, improve customer targeting, and enhance decision-making processes.
Long-term trends are the backbone of temporal analysis. By examining data over time, you can identify patterns such as sales growth, seasonal variations, or economic cycles. Techniques like moving averages and exponential smoothing help smooth out short-term fluctuations, making long-term trends more apparent.
Seasonal trends repeat over specific periods, like holidays or annual events. Seasonal decomposition techniques break down time series data into trend, seasonal, and residual components. This approach helps you understand and predict cyclical behaviors, allowing for better planning and resource allocation.
Cohorts are groups of users who share a common characteristic or experience within a specific time frame. Defining these groups involves selecting relevant criteria, such as sign-up date or purchase behavior. Analyzing cohorts helps you track user behavior and understand how different groups interact with your product or service over time.
Retention analysis focuses on how long users continue to engage with your product or service. By tracking cohorts over time, you can identify trends in user retention and pinpoint factors that contribute to loyalty. This insight is crucial for developing strategies to keep customers engaged and reduce churn.
Cohort analysis offers a lens into user journeys. By examining how different cohorts behave at various stages, you can understand the user lifecycle better. This approach helps you identify drop-off points, optimize onboarding processes, and tailor experiences to different user segments, ultimately enhancing overall user satisfaction and engagement.
Creating a feedback loop is vital for refining your analytics. Continuously gather insights from your results, and use these to adjust and improve your methods. Regularly review your processes and outcomes, and don’t hesitate to make necessary tweaks. This cycle helps you stay sharp and relevant.
Promote a data-driven culture in your organization. Encourage all team members to think analytically, no matter their role. Offer training sessions, share success stories, and create a supportive environment where data is central to decision-making. This collective mindset enhances overall analytical capabilities.
Recognize that analytics evolves in stages. Descriptive Analytics tells you what happened. Predictive analytics forecasts what might happen next. Prescriptive analytics suggests actions based on predictions. Understanding this progression helps you navigate your journey from basic analysis to advanced insights.
Descriptive insights are the building blocks for predictive models. Use your descriptive data to identify patterns and trends. These patterns inform your forecasting models, allowing you to make educated predictions about future outcomes. It’s a step-by-step process that builds on your existing knowledge.
Descriptive Analytics provides a clear picture of past performance. By understanding what happened, businesses can identify strengths and weaknesses. This insight is crucial for planning and improving future strategies. It’s like having a map of where you’ve been, so you can plan where to go next.
No, Descriptive Analytics looks at past data. While it can provide insights into trends, it doesn’t predict future events. For predictions, you need predictive analytics, which uses statistical models to forecast what might happen based on historical data.
While it primarily looks at past data, the insights gained can shape future strategies. By understanding what happened, businesses can predict potential outcomes and plan accordingly. It’s the first step towards a more comprehensive analytics approach.
Yes, it can help in crisis management by providing a clear picture of the situation. It helps identify the root causes of issues and track the effectiveness of responses. This data-driven approach enables better management and resolution of crises.
Descriptive Analytics looks at past data to understand what happened. Predictive analytics, on the other hand, uses data to forecast future events. While descriptive tells you “what was,” predictive tells you “what might be.” Both are crucial, but they serve different purposes.
Start with your existing data. Gather historical data from various sources. Clean and organize the data. Look for patterns and trends. Use visualization techniques to present your findings. This will give you a solid foundation to build on.
Absolutely. Small businesses can benefit from Descriptive Analytics just as much as large ones. Even basic tools like spreadsheets can provide valuable insights. The key is to start with what you have and build from there. Understanding your data can lead to better business decisions, no matter the size of your company.
Skills needed include data analysis, critical thinking, and curiosity. Understanding data visualization principles is also essential. These skills help in interpreting data accurately and presenting it effectively.
Visualizing data makes it easier to understand and communicate. Charts and graphs can highlight trends and patterns more effectively than raw numbers. They provide a clear and immediate picture, making it easier to share insights with others in the organization.
Start with clear goals. What are you trying to learn? Collect data that is relevant and reliable. Clean your data to avoid misleading results. Use the right tools and methods to analyze it. Finally, interpret the results in a way that informs decision-making.
First, ensure your team understands the goals. Make the data accessible and easy to understand. Regularly review and update your methods to stay relevant. Encourage collaboration across departments to get diverse insights. Document your processes to maintain consistency and quality.
One common mistake is relying on inaccurate data. Always verify your sources. Another is ignoring the context of the data. Make sure you understand the background before concluding. Avoid overcomplicating your analysis. Simple, clear methods often yield the best results. Lastly, don’t overlook the importance of clear communication. Share your findings in a way that’s understandable to everyone involved.
Begin by identifying your key questions. What do you need to know? Gather your data sources and ensure they are accurate and relevant. Clean your data to eliminate errors. Choose the right tools and methods for your analysis. Start small with a pilot project to test your approach. Use the results to refine your methods before scaling up.
Your team should include diverse skills. Data scientists bring technical expertise. Business analysts understand the context. IT staff ensure you have the right infrastructure. Collaborate closely to combine these strengths. Regular meetings and clear communication are key to a successful team.
Measure your success by the impact of your decisions. Are you making better choices? Track key performance indicators before and after your analysis. Share your results with stakeholders in a clear, concise manner. Use visuals and summaries to make complex data understandable. Show how your insights are driving positive change.
Stay ahead by keeping an eye on trends. Automation is increasing, making analytics faster and more accessible. More industries are adopting analytics, creating new opportunities. Data privacy and ethics are becoming more important. Stay informed and adapt to these changes to stay relevant.
Analytics is always evolving. Keep learning to stay on top. Attend workshops, read industry publications, and join professional networks. Encourage your team to do the same. Foster a culture of continuous improvement and curiosity.
Prepare for the future by building a strong data foundation. Invest in technology and training. Create a culture that values data-driven decision-making. Anticipate challenges and plan for them. By staying adaptable and proactive, you can turn data into a powerful asset for your organization.
Your guide to Descriptive Analytics is complete. Now, take these insights and put them into action. Your journey in the world of data is ongoing, and with these strategies, you’re well-equipped to make the most of it.
How much did you enjoy this article?


Calculate accounts receivable turnover ratio to measure credit collection speed, improve cash flow, and strengthen your financial strategy. Read on!

Change Management KPIs are the key to tracking adoption, performance, and ROI during transitions. Find out which metrics matter. Read on!

Data collection methods and techniques determine the quality of every insight you act on. Explore key approaches for gathering reliable data. Read on!


