• Home
  • Tools dropdown img
    • Spreadsheet Charts

      • ChartExpo for Google Sheets
      • ChartExpo for Microsoft Excel
    • Power BI Charts

      • Power BI Custom Visuals by ChartExpo
    • Word Cloud

  • Charts dropdown img
    • Chart Category

      • Bar Charts
      • Circle Graphs
      • Column Charts
      • Combo Charts
      • Comparison Charts
      • Line Graphs
      • PPC Charts
      • Sentiment Analysis Charts
      • Survey Charts
    • Chart Type

      • Box and Whisker Plot
      • Clustered Bar Chart
      • Clustered Column Chart
      • Comparison Bar Chart
      • Control Chart
      • CSAT Survey Bar Chart
      • CSAT Survey Chart
      • Dot Plot Chart
      • Double Bar Graph
      • Funnel Chart
      • Gauge Chart
      • Likert Scale Chart
      • Matrix Chart
      • Multi Axis Line Chart
      • Overlapping Bar Chart
      • Pareto Chart
      • Radar Chart
      • Radial Bar Chart
      • Sankey Diagram
      • Scatter Plot Chart
      • Slope Chart
      • Sunburst Chart
      • Tornado Chart
      • Waterfall Chart
      • Word Cloud
    • Google Sheets
      Microsoft Excel
  • Services
  • Pricing
  • Contact us
  • Blog
  • Support dropdown img
      • Gallery
      • Videos
      • Contact us
      • FAQs
      • Resources
    • Please feel free to contact us

      atsupport@chartexpo.com

Categories
All Data Visualizations Data Analytics Surveys
Add-ons/
  • Google Sheets
  • Microsoft Excel
  • Power BI
All Data Visualizations Data Analytics Surveys
Add-ons
  • Google Sheets
  • Microsoft Excel
  • Power BI

We use cookies

This website uses cookies to provide better user experience and user's session management.
By continuing visiting this website you consent the use of these cookies.

Ok

ChartExpo Survey


Home > Blog > Data Analytics

What are Key Risk Indicators: Essential Insights

What are key risk indicators?

Picture this: The business world is expansive and constantly evolving, with opportunities and dangers. Every choice and action is akin to playing a high-stakes chess game. But how can you navigate these uncertainties, these hidden dangers that could ruin your carefully made plans?

What Are Key Risk Indicators

This is where key risk indicators (KRIs) are useful. They act as guardians for your business, alerting you to possible dangers that could result in catastrophe.

Think about this: the current average data breach cost is $4.45 million. A strong understanding of your organization’s potential risks is essential when dealing with such significant financial numbers. Key risk indicators offer a method to measure and monitor every risk.

The significance of key risk indicators (KRIs) in business cannot be overstated. Monitoring these measurements is essential for managing operations, informing choices, and establishing stakeholder confidence. These metrics allow for proactive risk management by anticipating potential risk scenarios, not just reacting to them.

This blog post demystifies what are key risk indicators. It highlights how KRIs provide visibility into weaknesses within your company’s risk and control environment.

Join us – let’s unravel the critical role of KRIs in safeguarding your business against potential risks.

Table of Contents:

  1. What are Key Risk Indicators?
  2. What is the Purpose of Key Risk Indicators?
  3. What are the Characteristics of a Good KRI?
  4. How to Compare KPI vs. KRI?
  5. How to Develop Key Risk Indicators?
  6. What are the Challenges of Developing Key Risk Indicators?
  7. How to Use and Monitor KRIs Effectively?
  8. How to Mention KRI When Creating a KRI Report?
  9. How to Analyze Key Risk Indicators?
  10. Wrap Up

First…

What are Key Risk Indicators?

Definition: Key Risk Indicators (KRIs) are metrics used to signal potential risks. They help organizations identify and manage risks proactively. KRIs are often quantifiable and measurable. They provide early warning signs of increasing risk exposure.

KRIs are critical for effective risk management. They can relate to various risk types, such as financial, operational, or strategic risks. High-quality KRIs are specific, relevant, and timely. They should be easy to monitor and interpret.

Regular monitoring of KRIs helps in prompt decision-making. It allows organizations to take corrective actions before risks become significant issues. Effective KRIs contribute to an organization’s overall resilience and stability.

Key risk indicators examples include:

  • Financial KRI – a sudden drop in cash flow.
  • Operational KRI – an increase in machinery breakdowns.
  • Strategic KRI – Changes in market share.

What is the Purpose of Key Risk Indicators?

Key Risk Indicators (KRIs) are the early warning system for your organization. Think of them as the smoke detectors, alerting you to potential problems before they become full-blown crises. So, what is the purpose of these handy metrics and KPIs? Let’s break it down:

  • Early risk detection: KRIs help you spot potential risks early on. They provide timely alerts that allow you to address issues before they escalate. This proactive approach can save time, money, and resources.
  • Enhanced risk management: Continuously monitoring KRIs can help you manage risks more effectively. They give you a clear picture of your risk landscape, enabling you to prioritize and mitigate risks precisely.
  • Strategic decision-making: KRIs inform strategic decisions by highlighting areas of concern. This ensures your decisions are based on comprehensive risk assessments, leading to better outcomes.
  • Improved performance monitoring: KRIs help track performance against risk-related goals. They offer insights into how well your risk management strategies are working and where adjustments are needed.
  • Regulatory compliance: KRIs play a crucial role in meeting regulatory requirements. They provide documented evidence of risk monitoring and management, which is essential for compliance with various regulations.

What are the Characteristics of a Good KRI?

A good KRI can be compared to a reliable friend who always gives you a heads-up when something’s amiss. But what makes a KRI truly effective? Here are the characteristics that define a good KRI:

  1. Specific and relevant: A good KRI targets a particular risk and aligns with your organization’s objectives. It’s not just any metric; it directly relates to the risks you care about the most.
  2. Quantifiable: Effective KRIs are measurable. They provide clear, numerical data that you can track over time. This makes it easier to spot trends and make informed decisions.
  3. Timely: The best KRIs offer real-time or near-real-time information. They enable you to respond quickly to emerging risks, preventing small issues from becoming major problems.
  4. Predictive: A good KRI doesn’t just report on past events; it anticipates future risks. It acts as a forward-looking indicator, giving you a glimpse of what might be coming down the line.
  5. Easy to monitor: Effective KRIs are straightforward to track and interpret. They should be simple enough for regular monitoring without requiring extensive resources or complex analysis.

How to Compare KPI vs. KRI?

Comparing Key Performance Indicators (KPIs) and Key Risk Indicators (KRIs) can feel like comparing apples and oranges. Both are important, but they serve different purposes. To make it easier, let’s break it down and see how they stack up against each other.

Aspect Key Performance Indicators (KPIs) Key Risk Indicators (KRIs)
Purpose KPIs measure the performance and progress towards strategic goals. KRIs signal potential risks that could impact achieving those goals.
Focus KPIs focus on achieving success and efficiency. KRIs focus on identifying and mitigating risks.
Measurement KPIs are often based on past and current performance data. KRIs are predictive and aim to foresee potential future risks.
Relationship KPIs and KRIs are interrelated. Low performance in KPIs may signal potential risks, while successful risk management can impact KPI results positively.
Integration KPIs are integrated into performance management systems. KRIs are integrated into risk management frameworks.

How to Develop Key Risk Indicators?

Developing Key Risk Indicators (KRIs) is akin to setting up a radar system for your organization. It helps you detect potential issues before they become major problems. Ready to get started? Here are key steps to develop effective KRIs:

  1. Identify key risks: Begin by pinpointing your organization’s most significant risks. These could be financial, operational, strategic, or compliance-related risks.
  2. Align with objectives: Ensure the KRIs you develop are aligned with your organizational objectives. They should help you monitor risks that could impact your strategic goals.
  3. Select relevant metrics: Choose metrics directly related to the identified risks. The metrics should be specific and relevant to provide meaningful insights.
  4. Ensure quantifiability: Make sure the KRIs you select can be quantified. This allows for clear tracking and analysis over time.
  5. Set thresholds: Define acceptable levels for each KRI. Establish thresholds that, when crossed, trigger alerts for potential risk issues.
  6. Develop data collection processes: Establish reliable processes for collecting the necessary data. Ensure the data is accurate, consistent, and timely.
  7. Implement monitoring systems: Use software tools or dashboards to monitor KRIs regularly. This ensures you have real-time visibility into your risk environment.
  8. Review and update regularly: KRIs are not static. Regularly review and update them to reflect changing risk landscapes and organizational priorities.

What are the Challenges of Developing Key Risk Indicators?

Creating Key Risk Indicators (KRIs) can significantly impact risk management, although it comes with challenges. Consider it like establishing a security system: it needs careful planning and continual modifications. Below are a few primary challenges you could encounter:

  • Data availability and quality: Accessing high-quality data is a major challenge in risk monitoring. Incorrect or incomplete data may result in misleading charts and Key Risk Indicators, making it challenging to monitor risks effectively.
  • Identifying relevant KRIs: Determining which metrics will be the most beneficial can be challenging. Understanding your organization’s risks is crucial to identifying key risk indicators (KRIs) specific to your business.
  • Establishing thresholds: Determining the correct thresholds for KRIs can be tricky. Set them too high, and you might miss early warning signs. Set them too low, and you could have too many false alarms.
  • Subjectivity and interpretation: Subjectivity plays a role in interpreting KRIs. Various stakeholders may interpret the data differently, possibly causing misunderstandings and discrepancies.
  • Integration with existing systems: Integrating KRIs into your current risk management and reporting systems can be complex. Ensuring the technology and processes work seamlessly together is essential for effective monitoring.
  • Continuous review and adaptation: Key Risk Indicators (KRIs) must stay current and effective through ongoing evaluation and adjustments. This requires constant dedication and effort since the risk environment and organizational focus may evolve.

How to Use and Monitor KRIs Effectively?

Using and monitoring KRIs effectively is about staying proactive and ready to tackle potential risks head-on. Ready to make your KRIs work for you? Here’s how:

  1. Define clear objectives: Start by setting clear goals for your KRIs. Understand what you want to achieve with them. This could be early risk detection, improved risk management, or ensuring regulatory compliance.
  2. Establish thresholds: Determine the thresholds for each KRI. These thresholds will help you know when to take action. Ensure they are realistic and based on your organization’s risk appetite and tolerance.
  3. Implement monitoring systems: Use robust monitoring systems to monitor your KRIs. These systems can be software tools or dashboards that provide real-time data and alerts. Ensure the system is user-friendly and accessible to relevant stakeholders.
  4. Regular reporting: Establish a schedule for consistent reporting on Key Risk Indicators (KRIs). Depending on your requirements, this could be weekly, monthly, or quarterly. Maintaining regular reporting ensures all individuals are kept up to date and actively involved in the risk management process.
  5. Actionable insights: Study the information obtained from your Key Risk Indicators to create insights that can be implemented. Utilize these insights to guide decision-making and strategies for reducing risk. The objective is to transition from gathering data to implementing practical measures to manage potential risks.
  6. Review and modify: Ensure your Key Risk Indicators are flexible and change according to the development of your company. Frequently assess and modify your key risk indicators to correspond with the following:
    • Shifts in the business landscape
    • Emerging risks
    • Insights gained from previous encounters

How to Mention KRI When Creating a KRI Report?

Creating a KRI report is crucial for effective risk management. It’s similar to crafting a roadmap that guides your organization through potential hazards, ensuring you stay on track. If you’re looking to build a solid foundation, here’s a key risk indicators template to help you get started:

  1. Introduction

Give a summary of the intentions and extent of the KRI report. Elaborate on the significance of Key Risk Indicators in overseeing and controlling organizational risks.

  1. Executive Summary

This section provides a high-level overview of the key findings from the KRI analysis. It highlights the most critical risks, their potential impact, and the immediate actions required.

  1. KRI Framework

The KRI framework outlines the methodology used to select and define our KRIs. It includes:

    • The criteria for choosing relevant indicators
    • The data sources
    • The rationale behind the thresholds set for each KRI
  1. KRI Dashboard

The KRI dashboard presents a visual representation of each KRI’s current status. It includes charts, graphs, and color-coded indicators that provide a quick snapshot of risk levels. This section allows for easy monitoring and helps identify areas that require immediate attention.

  1. KRI Analysis

Here, you delve into a detailed analysis of each KRI. This includes trend analysis over time, comparisons against thresholds, and potential implications for the organization. The analysis helps to understand the root causes of risks and assess their potential impact on operations.

  1. Action Plan

Based on the KRI analysis, outline the specific actions to mitigate identified risks. The action plan includes short-term and long-term strategies, responsible parties, and timelines for implementation. It ensures that risks are addressed promptly and effectively.

  1. Recommendations

Provide strategic recommendations for improving your risk management practices. These recommendations are based on insights from the KRI analysis and aim to enhance your overall risk resilience.

  1. Conclusion

The conclusion summarizes the key takeaways from the report and reiterates the importance of proactive risk management. It emphasizes using KRIs to maintain organizational stability and achieve strategic objectives. The conclusion also highlights the next steps in your risk management journey.

How to Analyze Key Risk Indicators?

Data analysis is a maze of numbers and statistics, requiring a Sherlock Holmes-like intuition to unravel its mysteries. Visualizing Key Risk Indicators leads us through this labyrinth, revealing patterns and insights crucial for informed decision-making.

However, relying solely on Excel for this visualization expedition is like using an outdated map. Excel lacks the finesse needed to give the full story behind the numbers.

Enter ChartExpo, the treasure map, to Excel’s basic compass. It offers a sophisticated solution to decode the complexities of visualizing KRIs and steer businesses toward clearer risk management strategies.

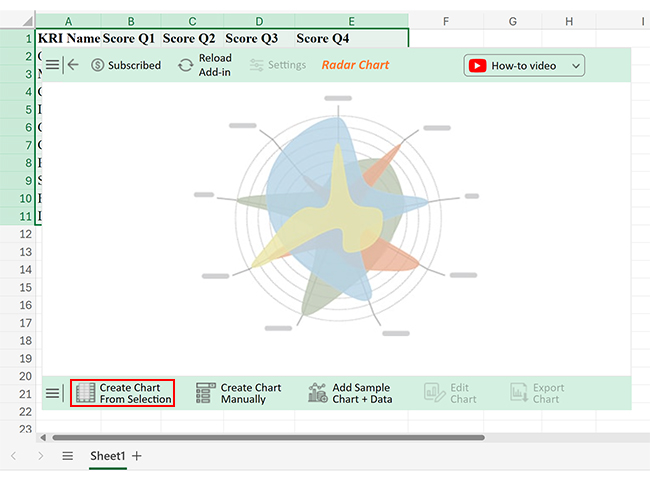
Let’s learn how to install ChartExpo in Excel.

  1. Open your Excel application.
  2. Open the worksheet and click the “Insert” menu.
  3. You’ll see the “My Apps” option.
  4. In the Office Add-ins window, click “Store” and search for ChartExpo on my Apps Store.
  5. Click the “Add” button to install ChartExpo in your Excel.

ChartExpo charts are available both in Google Sheets and Microsoft Excel. Please use the following CTAs to install the tool of your choice and create beautiful visualizations with a few clicks in your favorite tool.

Example

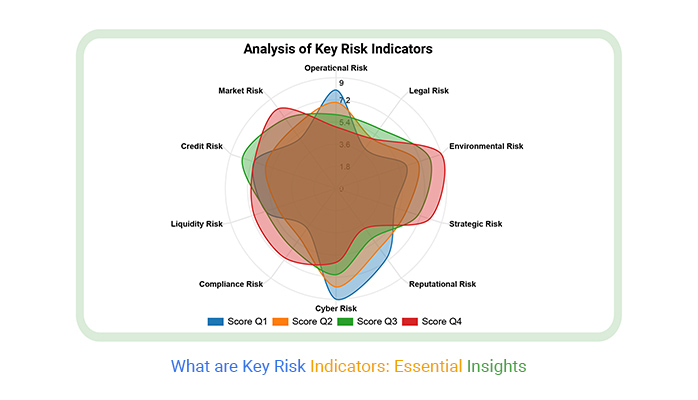
Let’s analyze the key risk indicators sample data below using ChartExpo.

KRI Name Score Q1 Score Q2 Score Q3 Score Q4
Operational Risk 8 7 6 5
Market Risk 5 6 7 8
Credit Risk 7 6 8 7
Liquidity Risk 6 5 6 7
Compliance Risk 4 5 6 7
Cyber Risk 9 8 7 6
Reputational Risk 7 6 5 4
Strategic Risk 5 6 7 8
Environmental Risk 6 7 8 9
Legal Risk 4 5 6 5
  • To get started with ChartExpo, install ChartExpo in Excel.
  • Now Click on My Apps from the INSERT menu.
insert chartexpo in excel
  • Choose ChartExpo from My Apps, then click Insert.
open chartexpo in excel
  • Once it loads, choose the “Radar Chart” from the charts list.
search radar chart in excel
  • Click the “Create Chart From Selection” button after selecting the data from the sheet, as shown.
Create Chart From Selection After Learning What Are Key Risk Indicators
  • ChartExpo will generate the visualization below for you.
Edit Chart After Learning What Are Key Risk Indicators
  • If you want to have the chart’s title, click Edit Chart, as shown in the above image.
  • Click the pencil icon next to the Chart Header to change the title.
  • It will open the properties dialog. Under the Text section, you can add a heading in Line 1 and enable Show.
  • Give the appropriate title of your chart and click the Apply button.
Add Chart Header After Learning What Are Key Risk Indicators
  • You can change the precision value into zero of all values:
Change Precision Value into Zero After Learning What Are Key Risk Indicators
  • Click the “Save Changes” button to persist the changes.
Save Changes After Learning What Are Key Risk Indicators
  • Your final Radar Chart will appear as below.
Final What Are Key Risk Indicators

Insights

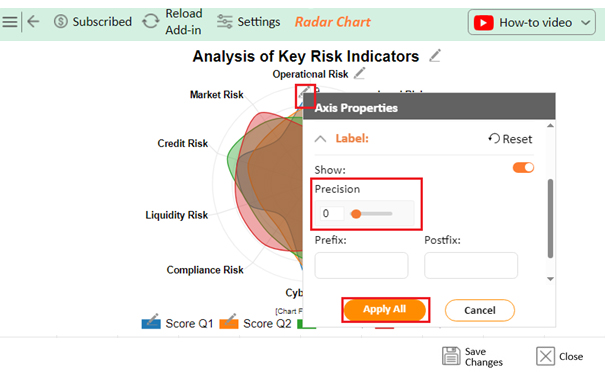
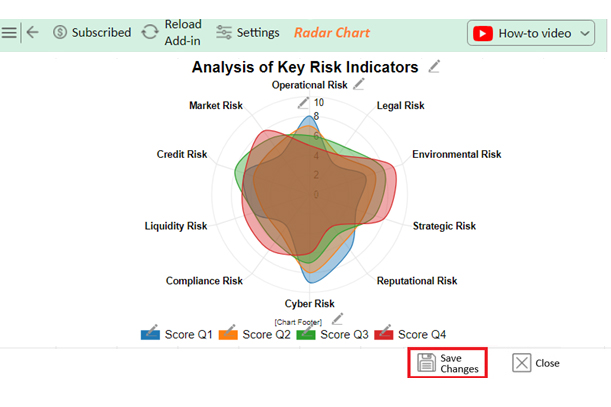
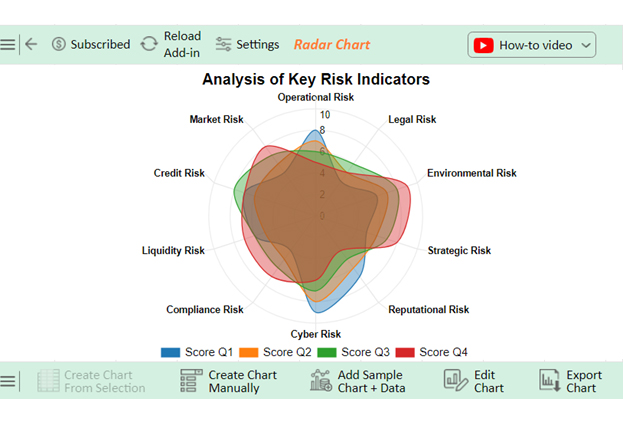
This Radar Chart displays Key Risk Indicators (KRIs). These quantifiable measures are utilized to evaluate possible risks in a company. They assist in:

  • Examining early warning signs
  • Signaling deviations from acceptable risk levels
  • Aiding stakeholders in recognizing, tracking, and minimizing risks to attain strategic goals and safeguard organizational value

FAQs

What are the key risk indicator criteria?

Key risk indicator criteria include:

  • Relevance to objectives
  • Measurability
  • Data availability
  • Sensitivity to changes
  • Predictiveness
  • Ease of interpretation
  • Benchmarking capability
  • Frequency of updates
  • Clear thresholds
  • Alignment with risk appetite and regulatory requirements

How do I identify key risks?

Identify key risks by:

  • Analyzing business objectives
  • Consulting stakeholders
  • Reviewing past incidents
  • Conducting risk assessments
  • Monitoring industry trends
  • Using KRIs to track potential threats
  • Continuously updating risk profiles based on new data and changing conditions

What are the 5 key risk indicators?

Five key risk indicators include:

  1. Financial metrics
  2. Operational efficiency
  3. Compliance rates
  4. Customer satisfaction scores
  5. Market volatility indices

These indicators help monitor financial health, operational performance, regulatory adherence, client feedback, and external market conditions.

Wrap Up

Key Risk Indicators (KRIs) are essential tools for risk management. They act as early warning signs for potential issues, helping organizations anticipate and mitigate risks. These indicators are specific and measurable. They provide actionable insights into risk exposure.

KRIs are critical for proactive risk management. They allow businesses to identify threats before they escalate. This proactive approach can prevent costly consequences. By monitoring KRIs, organizations can maintain stability with informed decision-making.

KRIs must be relevant to the organization’s goals. They should align with strategic objectives. Each KRI should directly relate to a specific risk. This relevance ensures they provide meaningful data. Accurate KRIs are crucial for effective risk management.

Another key characteristic is quantifiability. KRIs should be based on measurable data, allowing precise tracking and analysis. Quantifiable KRIs provide concrete evidence of risk levels, making it easier to identify trends and take action.

Regular monitoring of KRIs is essential. Organizations should use real-time or near-real-time data. This enables timely responses to emerging risks. Monitoring systems should be robust and user-friendly. Effective monitoring helps maintain a proactive risk management stance.

KRIs need constant review and adaptation, the risk landscape changes over time. Regular updates ensure KRIs remain relevant. Organizations must be flexible and responsive. Continuous improvement of KRIs strengthens risk management efforts.

In conclusion, KRIs are vital for managing risks effectively. They provide early warnings of potential threats. By being specific, measurable, and regularly monitored, KRIs help organizations stay ahead of risks.

Do not hesitate.

Start implementing and monitoring KRIs with ChartExpo today to strengthen your organization’s resilience and stability.

How much did you enjoy this article?

GSAd1
Start Free Trial!
136320

Related articles

next previous
Data Analytics10 min read

Business Management KPIs for Driving Clearer Insights

Business management KPIs track key performance areas to drive success. Click here to learn how to analyze, use, and measure them effectively and more.

Data Analytics22 min read

80-20 Rule: The Math Is Simple. The Impact Isn’t.

80-20 rule missteps can cost growth and alignment. Are you focusing on the right 20% or missing what matters? Learn more and rethink your strategy today!

Data Analytics8 min read

Benchmarking Dashboard: Tips for Better Insights

This guide dives deep into what benchmarking dashboards are. The guide also reveals easy ways and steps to create a benchmarking dashboard in Power BI.

Data Analytics9 min read

Inventory Management KPIs for Better Visual Insights

Key Performance Indicators for inventory track stock accuracy and efficiency. This blog covers the essential KPIs, analysis tips, and Excel tracking methods.

Data Analytics11 min read

How to Increase Efficiency in a Business?

How to increase efficiency in the business is key to boosting performance. Click here to learn the strategies to use to increase your business efficiency.

ChartExpo logo

Turn Data into Visual
Stories

CHARTEXPO

  • Home
  • Gallery
  • Videos
  • Services
  • Pricing
  • Contact us
  • FAQs
  • Privacy policy
  • Terms of Service
  • Sitemap

TOOLS

  • ChartExpo for Google Sheets
  • ChartExpo for Microsoft Excel
  • Power BI Custom Visuals by ChartExpo
  • Word Cloud

CATEGORIES

  • Bar Charts
  • Circle Graphs
  • Column Charts
  • Combo Charts
  • Comparison Charts
  • Line Graphs
  • PPC Charts
  • Sentiment Analysis Charts
  • Survey Charts

TOP CHARTS

  • Sankey Diagram
  • Likert Scale Chart
  • Comparison Bar Chart
  • Pareto Chart
  • Funnel Chart
  • Gauge Chart
  • Radar Chart
  • Radial Bar Chart
  • Sunburst Chart
  • see more
  • Scatter Plot Chart
  • CSAT Survey Bar Chart
  • CSAT Survey Chart
  • Dot Plot Chart
  • Double Bar Graph
  • Matrix Chart
  • Multi Axis Line Chart
  • Overlapping Bar Chart
  • Control Chart
  • Slope Chart
  • Clustered Bar Chart
  • Clustered Column Chart
  • Box and Whisker Plot
  • Tornado Chart
  • Waterfall Chart
  • Word Cloud
  • see less

RESOURCES

  • Blog
  • Resources
  • YouTube
SIGN UP FOR UPDATES

We wouldn't dream of spamming you or selling your info.

© 2025 ChartExpo, all rights reserved.