• Home
  • Tools dropdown img
    • Spreadsheet Charts

      • ChartExpo for Google Sheets
      • ChartExpo for Microsoft Excel
    • Power BI Charts

      • Power BI Custom Visuals by ChartExpo
    • Word Cloud

  • Charts dropdown img
    • Chart Category

      • Bar Charts
      • Circle Graphs
      • Column Charts
      • Combo Charts
      • Comparison Charts
      • Line Graphs
      • PPC Charts
      • Sentiment Analysis Charts
      • Survey Charts
    • Chart Type

      • Box and Whisker Plot
      • Clustered Bar Chart
      • Clustered Column Chart
      • Comparison Bar Chart
      • Control Chart
      • CSAT Survey Bar Chart
      • CSAT Survey Chart
      • Dot Plot Chart
      • Double Bar Graph
      • Funnel Chart
      • Gauge Chart
      • Likert Scale Chart
      • Matrix Chart
      • Multi Axis Line Chart
      • Overlapping Bar Chart
      • Pareto Chart
      • Radar Chart
      • Radial Bar Chart
      • Sankey Diagram
      • Scatter Plot Chart
      • Slope Chart
      • Sunburst Chart
      • Tornado Chart
      • Waterfall Chart
      • Word Cloud
    • Google Sheets
      Microsoft Excel
  • Services
  • Pricing
  • Contact us
  • Blog
  • Support dropdown img
      • Gallery
      • Videos
      • Contact us
      • FAQs
      • Resources
    • Please feel free to contact us

      atsupport@chartexpo.com

Categories
All Data Visualizations Data Analytics Surveys
Add-ons/
  • Google Sheets
  • Microsoft Excel
  • Power BI
All Data Visualizations Data Analytics Surveys
Add-ons
  • Google Sheets
  • Microsoft Excel
  • Power BI

We use cookies

This website uses cookies to provide better user experience and user's session management.
By continuing visiting this website you consent the use of these cookies.

Ok

ChartExpo Survey


Home > Blog > Microsoft Excel

15 Key Operational KPIs And Metrics for Optimal Reporting

Key performance indicators for operations encompass a range of quantifiable measurements crucial for monitoring and enhancing day-to-day business processes.

KPIs for Operations

From turnover rates to customer service response times, and from delivery times to manufacturing defect rates, these KPIs play a pivotal role in assessing operational efficiency.

Historically, the roots of KPIs can be traced back to the early 20th century. Back then, visionaries like Frederick Taylor championed the use of data to drive operational efficiency.

Today, KPIs have evolved into indispensable tools for businesses. 93% of organizations use KPIs to track their performance and achieve their strategic goals.

Table of Contents:

  1. What are Key Performance Indicators for Operations?
  2. Why are Operational Metrics and KPIs Important?
  3. Examples of KPIs For Operations Managers
    1. Financial KPIs for Operations Manager
    2. Customer KPIs for Operations Manager
    3. Manufacturing KPIs for Operations Manager
  4. Role of Operational Performance Indicators
  5. 15 Best Key Performance Indicators for Operations
  6. How to Track KPIs in Operations?
  7. How to Analyze Key Performance Indicators of Operations?
  8. Benefits of Tracking KPIs in Operation
  9. How to Select the Best KPI Metrics For Your Operation?
  10. Download the Operational KPI Template
  11. FAQs: KPIs For Operation
  12. Wrap Up

Join us – let’s unravel the operational KPIs concept and uncover actionable insights for continuous improvement.

What are Key Performance Indicators for Operations?

Definition: Key Performance Indicators (KPIs) for operations are metrics that assess efficiency, quality, and overall effectiveness. Key Performance Indicators for Operations focus on essential aspects such as productivity, resource utilization, and overall performance. Therefore, they provide actionable insights, enabling businesses to streamline processes and optimize resource utilization for sustained operational success.

Metrics like cycle time gauge the time taken for processes, ensuring optimal efficiency. The inventory turnover ratio measures how quickly inventory is utilized, indicating operational effectiveness. Moreover, order fulfillment metrics and KPIs, such as on-time delivery and accuracy, showcase operational reliability.

Why are Operational Metrics and KPIs Important?

Operational metrics and KPIs play a critical role in assessing business performance and ensuring that daily operations support broader strategic objectives. They offer valuable insights into efficiency, productivity, and progress, enabling organizations to make informed decisions. By consistently tracking these key indicators, businesses can spot improvement opportunities, streamline processes, and drive sustainable growth.

Examples of KPIs For Operations Managers

Financial KPIs for Operations Manager

  • Cost of Goods Sold (COGS): Tracks the direct costs associated with producing goods or services.
  • Operating Profit Margin: Measures the percentage of profit after covering operating expenses.
  • Cash Flow: Monitors the inflow and outflow of cash to ensure liquidity.
  • Inventory Turnover: Indicates how efficiently inventory is managed by calculating how often it’s sold and replaced.
  • Return on Investment (ROI): Assesses the profitability of investments in equipment, projects, or processes.

Customer KPIs for Operations Manager

  • Customer Satisfaction (CSAT): Evaluates customer happiness through feedback or survey results.
  • Net Promoter Score (NPS):  Assesses customer loyalty by gauging how likely they are to recommend your product or service to others.
  • Customer Holding Rate: Monitors the percentage of customers who continue their relationship with the business over time.
  • On-Time Delivery Performance: Tracks the efficiency of delivering goods or services to clients within the promised timeframe.
  • Customer Lifetime Value (CLV): Projects the total revenue a customer is expected to generate throughout their relationship with the company.

Manufacturing KPIs For Operations Manager

  • Overall Equipment Effectiveness (OEE): Measures the efficiency of manufacturing processes by evaluating availability, performance, and quality.
  • First Pass Yield (FPY): Monitors the proportion of products produced accurately without requiring any rework or resulting in waste.
  • Production Volume: Monitors the total output of products over a specific period, helping to assess production capacity.
  • Cycle Time: Measures the total time from the beginning to the end of a manufacturing process, indicating efficiency.
  • Downtime: Calculates the total time that production is halted due to equipment failures, maintenance, or other interruptions.

Role of Operational Performance Indicators

Key Performance Indicators for Operations provide a comprehensive toolkit to navigate the complex landscape of operational management. Let’s explore the multifaceted roles of operational performance indicators (OPIs) in detail.

  • Performance measurement: OPIs serve as a yardstick for measuring the performance of various operational aspects. Quantifying key metrics offers valuable insights into your current performance levels, allowing for informed decision-making and targeted improvements.
  • Efficiency monitoring: Monitoring efficiency is a core function of OPIs. These indicators track how well resources, time, and processes are utilized. Moreover, they highlight areas of improvement, enabling you to streamline workflows and eliminate bottlenecks.
  • Process optimization: OPIs identify inefficiencies in operational processes, laying the groundwork for strategic optimization. Pinpointing areas for improvement helps to refine processes, enhance productivity, and ultimately achieve higher levels of operational effectiveness.
  • Capacity planning: Effective capacity planning relies on operational performance indicators to assess current operational capabilities and predict future needs. Analyzing throughput, resource utilization, and demand patterns will help you proactively plan for growth. Moreover, you can prevent issues related to overcapacity or underutilization.
  • Quality assurance: Key Performance Indicators for Operations play a critical role in ensuring the quality of outputs. Quality metrics assess the accuracy, reliability, and consistency of operational processes. This enables you to maintain high-quality standards and meet customer expectations.
  • Customer satisfaction: OPIs directly impact customer satisfaction by measuring and improving key operational aspects. Timely delivery, product quality, and responsiveness are crucial indicators that influence customer perceptions and loyalty, ultimately impacting the bottom line.
  • Risk management: Operational performance indicators help in identifying and mitigating operational risks. Monitoring various performance metrics helps to detect potential issues early. This allows for proactive risk management strategies to prevent disruptions and protect against unforeseen challenges.
  • Decision support: OPIs provide a solid foundation for decision-making. Leaders rely on these indicators to make informed choices based on data-driven insights. Tools like a Pyramid Chart can effectively visualize these insights, helping to optimize processes or allocate resources. OPIs, when represented clearly, guide in aligning actions with strategic objectives.
  • Employee performance and engagement: Key Performance Indicators for Operations help to evaluate workforce efficiency and engagement. Measuring employee performance and satisfaction helps to identify improvement areas, foster a positive work environment, and enhance team effectiveness.
  • Strategic alignment: OPIs ensure that operational activities align with broader strategic objectives. Regular performance assessment against key indicators helps to verify that day-to-day operations contribute to the overarching goals. This, as a result, fosters a cohesive and purposeful approach to success.

15 Best Key Performance Indicators for Operations

Careful monitoring of various operational aspects is crucial to maintaining optimal business performance. Here are the general key performance indicators for operations, each playing a pivotal role in evaluating and enhancing efficiency.

  • Cycle Time

Cycle time measures the duration required to complete a specific process or operation. Monitoring cycle times provides insights into the speed and efficiency of operational workflows, allowing you to streamline processes and eliminate bottlenecks.

How To Calculate It = Total time taken for the process / Number of units produced

  • Throughput

Throughput is the rate at which a system or process produces results. It assesses production and delivery efficiency, highlighting operational capacity to meet demand. Optimizing throughput ensures effective resource utilization.

How To Calculate It =  Total output over a specific period / Time period.

  • Resource Utilization

Efficient use of resources is critical for operational success. Resource utilization KPIs evaluate how well assets, human resources, and equipment are employed. This insight aids in resource optimization, enhancing overall operational efficiency.

How To Calculate It = (Total actual output / Total potential output) x 100.

  • Inventory Turnover

Inventory turnover measures how quickly a company sells and replaces its inventory within a specific timeframe. It reflects inventory management efficiency, ensuring stock levels align with demand to prevent overstocking or stockouts.

How To Calculate It = Cost of goods sold (COGS) / Average inventory.

  • Quality Metrics

Ensuring the quality of outputs is fundamental. Quality metrics assess the accuracy, reliability, and consistency of operational processes. Monitoring these metrics helps identify areas for improvement and maintain high-quality standards.

How To Calculate It = (Number of good units produced / Total units produced) x 100.

  • Lead Time

Lead time measures the time it takes from the initiation of a process to its completion. Minimizing lead time enhances operational responsiveness, meeting customer expectations, and improving overall efficiency.

How To Calculate It = End date of the process – Start date of the process.

  • Cost per Unit

Cost per unit evaluates the expenses associated with producing a single unit of a product or delivering a service. Monitoring this KPI aids in cost control, supporting financial sustainability and operational efficiency.

How To Calculate It = Total costs / Total units produced.

  • Downtime

Downtime measures the time during which equipment or machinery is not operational. Reducing downtime enhances productivity, preventing disruptions to operational workflows and ensuring consistent output.

How To Calculate It = Total downtime hours / Total available production hours

  • On-Time Delivery

On-time delivery assesses the punctuality of delivering products or services to customers. This operational KPI is crucial for customer satisfaction, loyalty, and maintaining a positive brand reputation.

How To Calculate It = (Number of on-time deliveries / Total deliveries) x 100

  • Employee Productivity

Employee productivity evaluates the efficiency of the workforce in completing tasks. Monitoring this KPI provides insights into resource management and aids in workforce optimization for enhanced operational performance.

How To Calculate It = Total output produced / Total hours worked

  • Waste Reduction

Waste reduction assesses the volume of waste produced during manufacturing processes. Tracking this KPI is essential for improving sustainability and cost-effectiveness.

How To Calculate It = Total waste produced / Total output produced

  • Customer Complaint Rate

This KPI measures the number of customer complaints received regarding products or services. A high complaint rate can indicate quality issues or service gaps.

How To Calculate It = (Number of complaints / Total customers) x 100

  • Return Rate

Return rate monitors the proportion of items returned by customers. High return rates can signal issues with quality or customer satisfaction.

How To Calculate It = (Number of returned products / Total sold products) x 100

  • Scrap Rate

Scrap rate measures the amount of material wasted during production. Monitoring this helps identify inefficiencies in the manufacturing process.

How To Calculate It =  (Total scrap produced / Total output produced) x 100

  • Capacity Utilization

Capacity utilization assesses how effectively a company uses its production capacity. This KPI helps identify potential overcapacity or underutilization issues.

How To Calculate It = (Actual output / Potential output) x 100

How to Track KPIs in Operations?

Measuring operational performance involves tracking key metrics and KPIs that reflect the efficiency and effectiveness of business processes. Here are the main steps:

  1. Identify Key Metrics: Focus on KPIs that align with your organization’s goals, such as productivity, quality, and customer satisfaction.
  2. Data Collection: Use reliable tools to gather data from various departments, such as sales, production, or customer service.
  3. Analyze Results: Evaluate the data to spot trends, inefficiencies, or opportunities for improvement.
  4. Compare Benchmarks: Measure performance against industry standards or historical data to gauge success.
  5. Implement Improvements: Use insights to optimize processes, enhance productivity, and drive continuous improvement.

How to Analyze Key Performance Indicators of Operations?

Data analysis is quite similar to untangling earphones. But fear not; data visualization swoops in as the caped crusader of clarity, making sense of the chaos.

However, while Excel is excellent in number crunching, its superpowers wane when it comes to data visualization. This is where ChartExpo comes in to save the day with its prowess in visual storytelling.

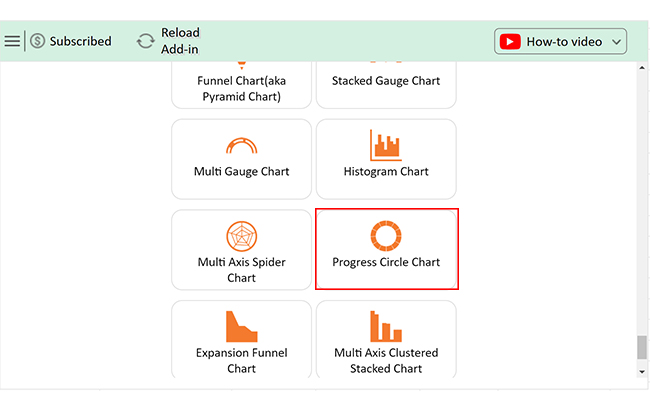
Let’s learn how to Install ChartExpo in Excel.

  1. Open your Excel application.
  2. Open the worksheet and click the “Insert” menu.
  3. You’ll see the “My Apps” option.
  4. In the office Add-ins window, click “Store” and search for ChartExpo on my Apps Store.
  5. Click the “Add” button to install ChartExpo in your Excel.

ChartExpo charts are available both in Google Sheets and Microsoft Excel. Please use the following CTA’s to install the tool of your choice and create beautiful visualizations in a few clicks in your favorite tool.

Example

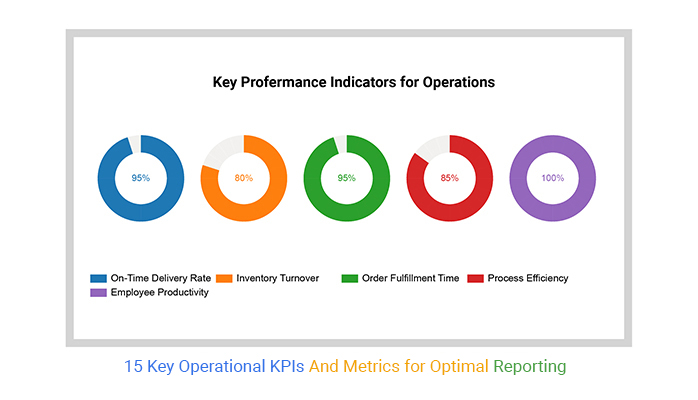
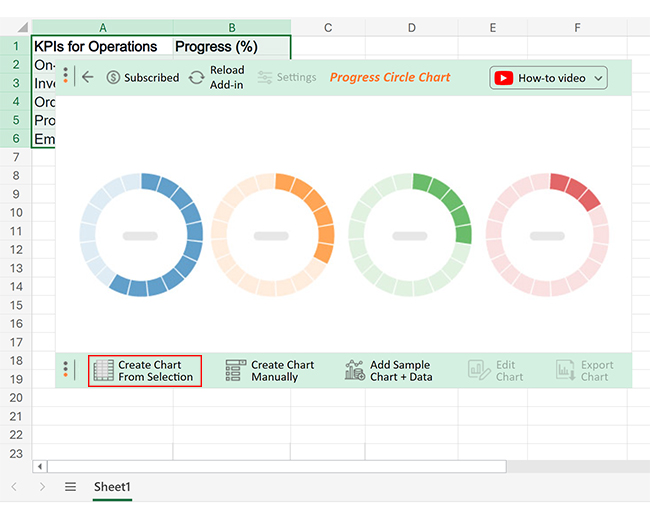
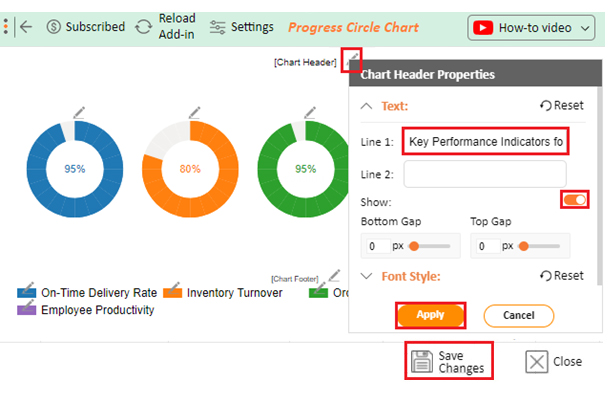
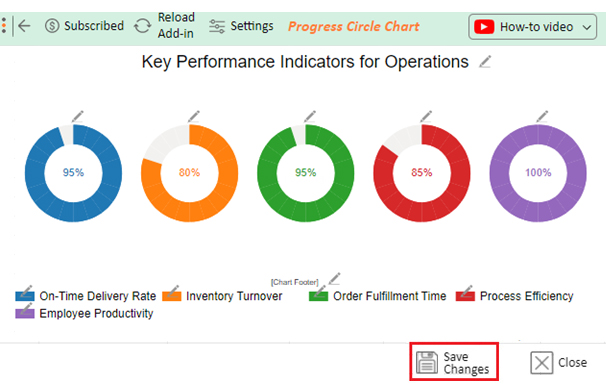
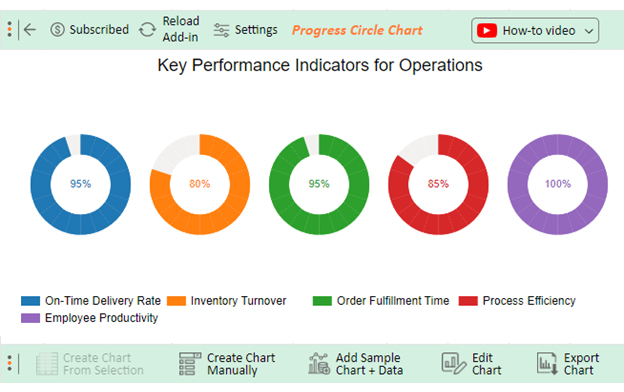
The data below contains KPI examples for operations.

KPIs for Operations Progress (%)
On-Time Delivery Rate 95
Inventory Turnover 80
Order Fulfillment Time 95
Process Efficiency 85
Employee Productivity 100

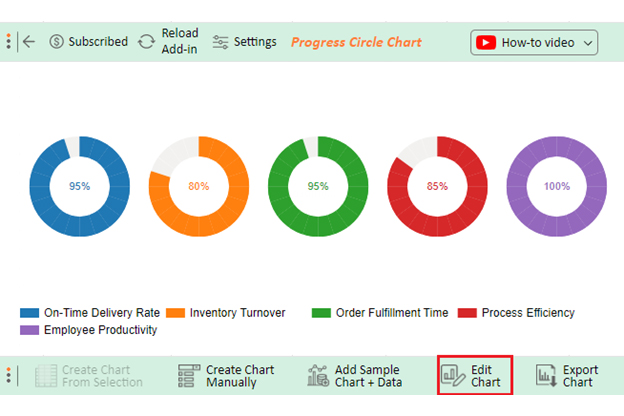
Let’s visualize this data in Excel with ChartExpo and glean valuable insights.

  • To get started with ChartExpo, install ChartExpo in Excel.
  • Now Click on My Apps from the INSERT menu.
insert chartexpo in excel
  • Choose ChartExpo from My Apps, then click Insert.
open chartexpo in excel
  • Once it loads, scroll through the charts list to locate and choose the “Progress Circle Chart”.
Search Progress Circle Chart n Excel ce517
  • Click the “Create Chart From Selection” button after selecting the data from the sheet, as shown.
Create Chart From Selection ce517
  • ChartExpo will generate the visualization below for you.
KPIs for Operations Design Template
  • If you want to add anything to the chart, click the Edit Chart button:
  • Click the pencil icon next to the Chart Header to change the title.
  • It will open the properties dialog. Under the Text section, you can add a heading in Line 1 and enable Show.
  • Give the appropriate title of your chart and click the Apply button.
Apply Tittle on Chart ce517
  • Click the “Save Changes” button to persist the changes made to the chart.
Save Changes ce517
  • Your final Progress Circle Chart will look like the one below.
Final KPIs for Operations

Insights

  • On-Time Delivery Rate: Demonstrated a robust 95%, underscoring dedication to timely service.
  • Inventory Turnover: Preserved a robust 80%, refining inventory efficiency.
  • Order Fulfillment Time: Attained an impressive 95%, guaranteeing prompt and dependable order processing.
  • Process Efficiency: Maintained an impressive 85%, signifying efficient and effective workflows.
  • Employee Productivity: Achieved an exceptional 100%, showcasing employee dedication and efficiency.

Benefits of Tracking KPIs in Operation

1. Improved Decision-Making

KPIs provide valuable insights that enable managers to make informed, data-driven decisions to enhance operational performance.

2. Enhanced Efficiency

By identifying inefficiencies, tracking KPIs allows organizations to streamline processes, ultimately increasing productivity and reducing waste.

3. Goal Alignment

KPIs ensure that team objectives are aligned with organizational goals, promoting focus and accountability across the workforce.

4. Increased Accountability

Regularly reviewing KPIs fosters a culture of accountability, motivating employees to meet or exceed performance expectations.

5. Enhanced Customer Satisfaction

Monitoring customer-related KPIs ensures that service delivery meets customer expectations, leading to higher satisfaction and loyalty.

How to Select the Best KPI Metrics For Your Operation?

To select the best KPI metrics for your operation, start by defining clear objectives that align with your business goals. Analyze your operational processes to identify critical areas for measurement, involving key stakeholders for their insights.

Focus on quantifiable metrics that can be tracked consistently, keeping the list manageable to avoid confusion. Additionally, consider industry benchmarks to ensure relevance and adapt the selected KPIs as your business evolves. This approach will help you effectively measure performance and drive operational success.

Download the Operational KPI Template

  1. Visit the ChartExpo Website: Go to the official ChartExpo website to access the resources section.
  2. Navigate to Templates: Look for the section dedicated to templates, where you can find various KPI templates.
  3. Select Operational KPI Template: Browse through the available templates and select the Operational KPI Template.
  4. Download the Template: Click on the download button or link associated with the template. This will typically provide the template in a suitable format, such as Excel or Google Sheets.
  5. Open and Customize: After downloading, open the template in your preferred spreadsheet software and customize it according to your operational needs.

FAQs: KPIs For Operation

What is the KPI of operational excellence?

Key Performance Indicators (KPIs) for operational excellence include efficiency metrics, cycle times, resource utilization, and quality measures. These indicators gauge the effectiveness of processes, ensuring optimal performance and alignment with overarching operational excellence goals.

What are the KPIs to improve operational performance?

Operational performance KPIs include cycle time, resource utilization, throughput, quality metrics, and cost-effectiveness. Monitoring these indicators enhances process efficiency, identifies areas for improvement, and ensures alignment with organizational goals. Consequently, they foster continual enhancement of operational performance.

What is the role of operational performance indicators?

Operational Performance Indicators (OPIs) measure, assess, and guide various facets of business operations. They enable performance evaluation, highlight inefficiencies, drive decision-making, ensure strategic alignment, and foster continuous improvement. They play a pivotal role in achieving and maintaining operational excellence.

Wrap Up

Key Performance Indicators (KPIs) for operations are the compass guiding businesses through the complexities of efficient management. These metrics are invaluable tools for assessing, optimizing, and ensuring the success of operational processes.

Efficient operations demand the constant monitoring of these KPIs. Why? They provide valuable insights into current performance levels and opportunities for improvement. Assessing cycle times and throughput provides clarity on process speed and production rates. Moreover, resource utilization metrics enable the optimization of assets and human resources, ensuring efficiency across the board.

Inventory turnover KPIs help in maintaining the delicate balance between supply and demand, preventing overstocking or stockouts. Quality metrics guarantee the consistent delivery of high-quality products or services, building and sustaining customer trust. Lead time and cost per unit metrics contribute to responsive and financially sustainable operations.

Furthermore, downtime metrics ensure the reliability of equipment, preventing disruptions and maintaining consistent output. On-time delivery KPIs directly impact customer satisfaction and loyalty, influencing the overall brand reputation. Employee productivity metrics gauge workforce efficiency and engagement, ensuring optimal human resource utilization.

Key Performance Indicators for Operations find an ideal companion in ChartExpo. ChartExpo offers a transformative approach to visualizing, analyzing, and optimizing operational metrics for sustained success.

Do not hesitate.

Embrace these performance indicators with ChartExpo to pave the way for sustained growth in the ever-evolving business landscape.

How much did you enjoy this article?

ExcelAd1
Start Free Trial!
133522

Related articles

next previous
Microsoft Excel10 min read

Invoice Tracker Template in Excel for Better Insights

An invoice tracker Excel template helps track invoices, due dates, and payments. Learn how to use this template for better financial management.

Microsoft Excel12 min read

Key Performance Indicators in Healthcare for Better Insights

Key Performance Indicators in healthcare track patient care and efficiency. Learn about these KPIs, top examples, and how to use them to improve outcomes.

Microsoft Excel10 min read

BMI Calculation Formula in Excel for Better Fitness Insights

The BMI calculation formula in Excel helps track and analyze body mass index. Explore step-by-step instructions and tips to simplify BMI tracking in Excel.

Microsoft Excel29 min read

How to Create a Tornado Chart in Excel? A Complete Guide

Click to learn how to plot a Tornado Chart in Excel using easy-to-follow steps. Also, we’ll address the following question: what is a Tornado Diagram?

Microsoft Excel14 min read

How to Create a Scatter Plot in Excel with 3 Variables?

Click to discover how to create a Scatter Plot in Excel with 3 variables. We’ll also address the following question: why do we use Scatter Plot Graph?

ChartExpo logo

Turn Data into Visual
Stories

CHARTEXPO

  • Home
  • Gallery
  • Videos
  • Services
  • Pricing
  • Contact us
  • FAQs
  • Privacy policy
  • Terms of Service
  • Sitemap

TOOLS

  • ChartExpo for Google Sheets
  • ChartExpo for Microsoft Excel
  • Power BI Custom Visuals by ChartExpo
  • Word Cloud

CATEGORIES

  • Bar Charts
  • Circle Graphs
  • Column Charts
  • Combo Charts
  • Comparison Charts
  • Line Graphs
  • PPC Charts
  • Sentiment Analysis Charts
  • Survey Charts

TOP CHARTS

  • Sankey Diagram
  • Likert Scale Chart
  • Comparison Bar Chart
  • Pareto Chart
  • Funnel Chart
  • Gauge Chart
  • Radar Chart
  • Radial Bar Chart
  • Sunburst Chart
  • see more
  • Scatter Plot Chart
  • CSAT Survey Bar Chart
  • CSAT Survey Chart
  • Dot Plot Chart
  • Double Bar Graph
  • Matrix Chart
  • Multi Axis Line Chart
  • Overlapping Bar Chart
  • Control Chart
  • Slope Chart
  • Clustered Bar Chart
  • Clustered Column Chart
  • Box and Whisker Plot
  • Tornado Chart
  • Waterfall Chart
  • Word Cloud
  • see less

RESOURCES

  • Blog
  • Resources
  • YouTube
SIGN UP FOR UPDATES

We wouldn't dream of spamming you or selling your info.

© 2025 ChartExpo, all rights reserved.