• Home
  • Tools dropdown img
    • Spreadsheet Charts

      • ChartExpo for Google Sheets
      • ChartExpo for Microsoft Excel
    • Power BI Charts

      • Power BI Custom Visuals by ChartExpo
    • Word Cloud

  • Charts dropdown img
    • Chart Category

      • Bar Charts
      • Circle Graphs
      • Column Charts
      • Combo Charts
      • Comparison Charts
      • Line Graphs
      • PPC Charts
      • Sentiment Analysis Charts
      • Survey Charts
    • Chart Type

      • Box and Whisker Plot
      • Clustered Bar Chart
      • Clustered Column Chart
      • Comparison Bar Chart
      • Control Chart
      • CSAT Survey Bar Chart
      • CSAT Survey Chart
      • Dot Plot Chart
      • Double Bar Graph
      • Funnel Chart
      • Gauge Chart
      • Likert Scale Chart
      • Matrix Chart
      • Multi Axis Line Chart
      • Overlapping Bar Chart
      • Pareto Chart
      • Radar Chart
      • Radial Bar Chart
      • Sankey Diagram
      • Scatter Plot Chart
      • Slope Chart
      • Sunburst Chart
      • Tornado Chart
      • Waterfall Chart
      • Word Cloud
    • Google Sheets
      Microsoft Excel
  • Services
  • Pricing
  • Contact us
  • Blog
  • Support dropdown img
      • Gallery
      • Videos
      • Contact us
      • FAQs
      • Resources
    • Please feel free to contact us

      atsupport@chartexpo.com

Categories
All Data Visualizations Data Analytics Surveys
Add-ons/
  • Google Sheets
  • Microsoft Excel
  • Power BI
All Data Visualizations Data Analytics Surveys
Add-ons
  • Google Sheets
  • Microsoft Excel
  • Power BI

We use cookies

This website uses cookies to provide better user experience and user's session management.
By continuing visiting this website you consent the use of these cookies.

Ok

ChartExpo Survey


Home > Blog > Power BI

How to Build a Power BI Sales Dashboard (Step-by-Step)

Managing sales data across spreadsheets, reports, and multiple sources quickly becomes difficult as your business grows.

Key metrics get scattered, trends are harder to spot, and decision-making slows down.

Power bi sales dashboard

A Power BI sales dashboard solves this by bringing your revenue, performance, and pipeline data into one interactive view.

Instead of manually compiling reports, you can monitor what’s working, identify gaps, and respond faster using real-time visuals.

This is why sales dashboards have become essential for teams that rely on fast, data-driven decisions.

What is a Power BI Sales Dashboard?

Definition: A Power BI sales dashboard is an interactive reporting layer that turns raw sales data into real-time performance insights across revenue, pipeline, and customer activity.

It helps sales teams quickly understand what is driving results by visualizing key metrics such as revenue trends, sales targets, product performance, and regional breakdowns in a single view.

Unlike static reports, it updates dynamically and allows users to filter and drill into data to understand the reasons behind performance changes.

When Should You Use a Power BI Sales Dashboard?

A Power BI sales dashboard should be used when sales data becomes too large, scattered, or fast-moving to manage through manual reports or spreadsheets, and when decisions depend on clear, up-to-date performance visibility.

When you need a single view of sales data

  • Data is spread across Excel, CRM systems, and marketing platforms
  • You need one place to monitor revenue, pipeline, and performance metrics

When reporting becomes frequent and time-sensitive

  • Sales reports are required daily, weekly, or in real time
  • Static reports are too slow to support ongoing decision-making

When managing multiple teams, regions, or products

  • You need to compare performance across sales reps, territories, or product lines
  • Identifying top and underperforming segments is important for strategy

When manual reporting slows down the analysis

  • Teams spend more time preparing reports than analyzing results
  • Excel-based reporting creates delays or inconsistencies in insights

When decisions depend on fast performance insights

  • Pricing, campaigns, or sales strategies need quick adjustments
  • Leadership requires instant visibility into KPIs and trends

Key Components of a Sales Dashboard in Power BI

Interactive Visuals

  • Dynamic charts and graphs allow users to explore sales data visually and quickly identify patterns, trends, and performance changes at a glance.

Real-Time Data Updates

  • Power BI dashboards connect to live data sources, ensuring that sales figures, KPIs, and reports always reflect the latest available information. This is even more effective with a KPI visual in Power BI, helping track performance in real time.

Customizable Filters

  • Users can filter data by region, product, sales representative, or date range to focus on specific segments and extract more relevant insights.

Drill-Down Capability

  • Interactive visuals let users move from high-level summaries to detailed transaction-level data, helping them understand the root cause behind performance changes.

Performance Tracking Metrics

  • Built-in KPIs, targets, and variance indicators help track sales performance against goals and highlight areas that require attention or improvement.

Common Metrics to Include in a Power BI Sales Dashboard

A Power BI sales dashboard focuses on a set of core metrics that help teams track performance, identify growth opportunities, and understand what is driving revenue.

Revenue

  • Revenue shows total sales performance over a specific period. It includes overall sales value, growth trends, and performance against targets, helping businesses measure whether they are meeting revenue goals.

Profit

  • Profit metrics highlight financial health by showing net profit, profit margins, and profitability trends. This helps identify whether revenue growth is actually translating into business gains.

Sales by Region

  • This metric breaks down sales performance by geographic areas or territories. It helps identify high-performing regions as well as areas that need improvement or additional focus.

Sales by Product

  • Sales by product shows which products are performing well and which are underperforming. It also helps track product-level trends and supports decisions related to pricing, demand, and inventory planning.

Sales by Channel

  • This compares performance across different sales channels such as online stores, retail outlets, or direct sales. It helps businesses understand which channels are driving the most revenue and where optimization is needed.

Customer Acquisition

  • Customer acquisition metrics track how effectively a business is gaining new customers. This includes CAC (Customer Acquisition Cost), conversion rates, and customer lifetime value (CLV), helping evaluate marketing and sales efficiency.

Top 4 Power BI Sales Dashboard Templates With Examples

  • Sales Dashboard

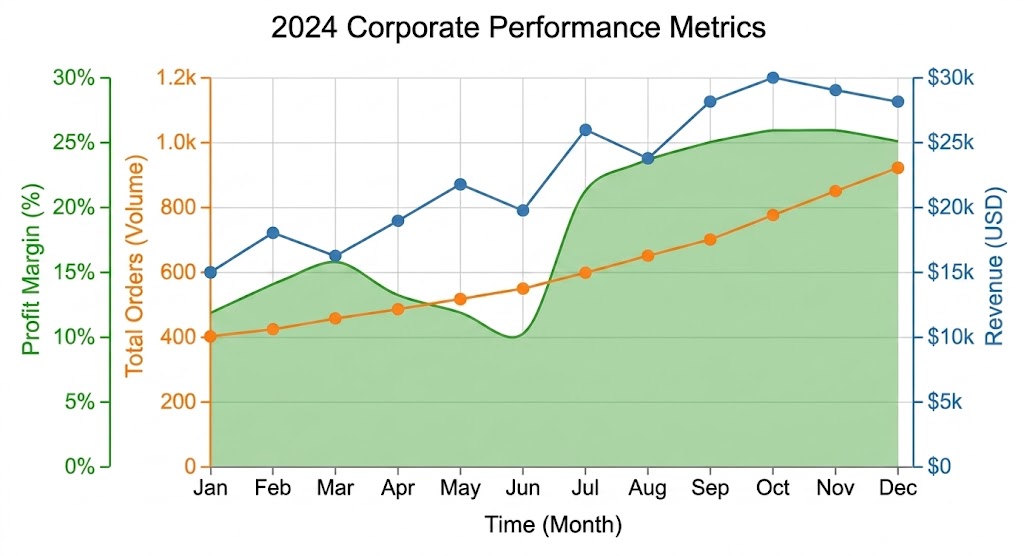
A sales dashboard provides a high-level view of overall sales performance. It helps users track key metrics such as revenue, growth, and sales targets across different time periods.

It is commonly used by sales teams and executives to monitor KPIs, analyze trends, and make data-driven decisions. A customizable layout also allows businesses to adjust visuals based on their specific reporting needs.


Power bi sales dashboard sample ce360
  • Monthly Sales Performance

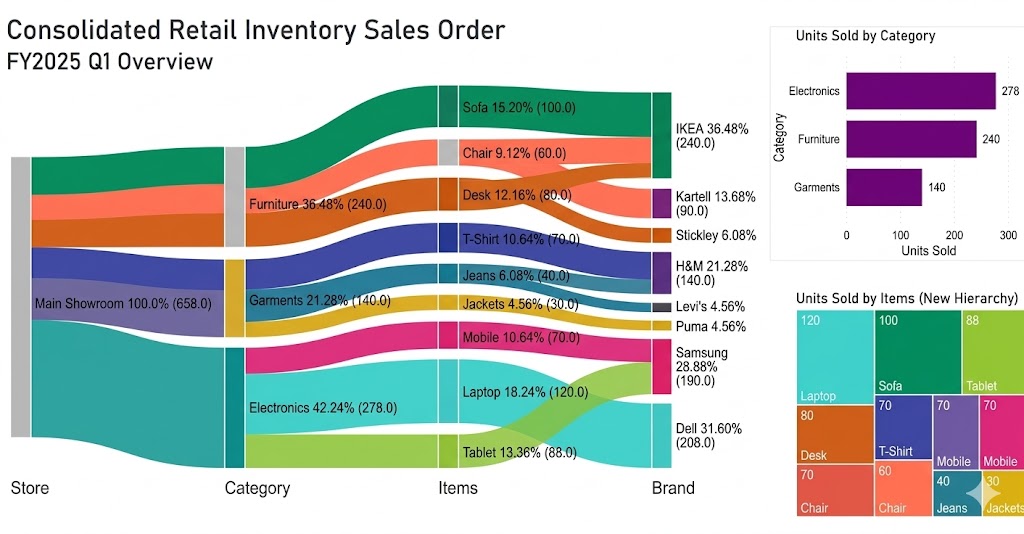
This dashboard tracks sales performance every month across regions, products, or teams. It highlights revenue trends and helps identify both high-performing and underperforming segments.

Users can filter data by time period, product category, or sales representative to focus on specific performance insights.

Sales Performance
  • Sales Pipeline Analysis

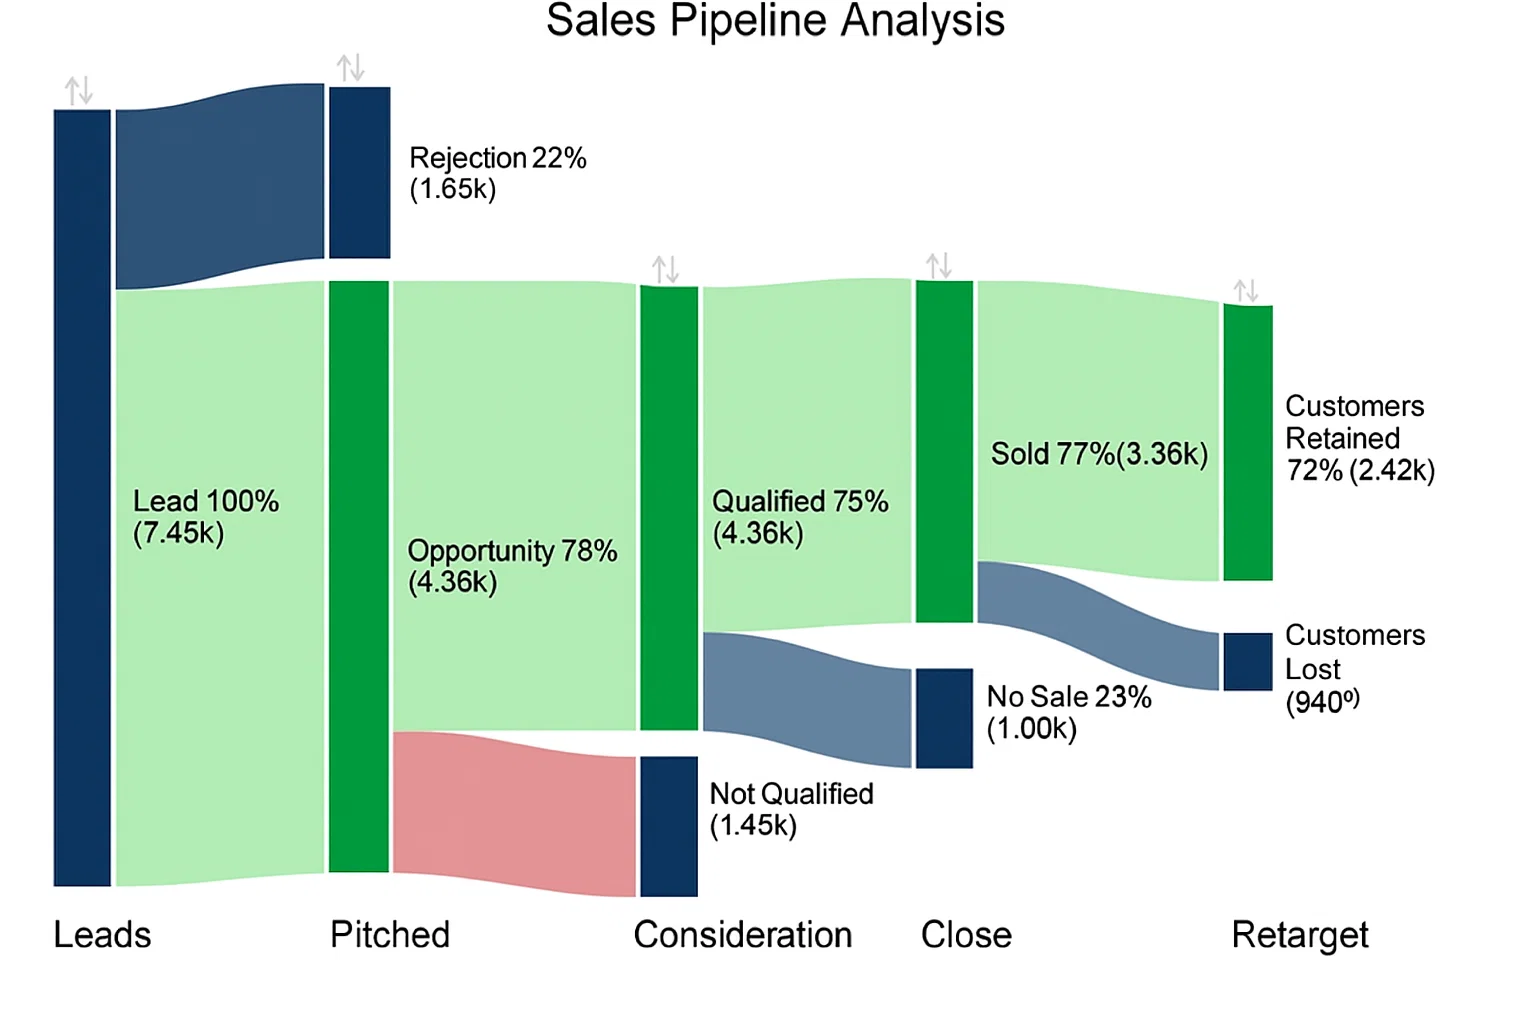
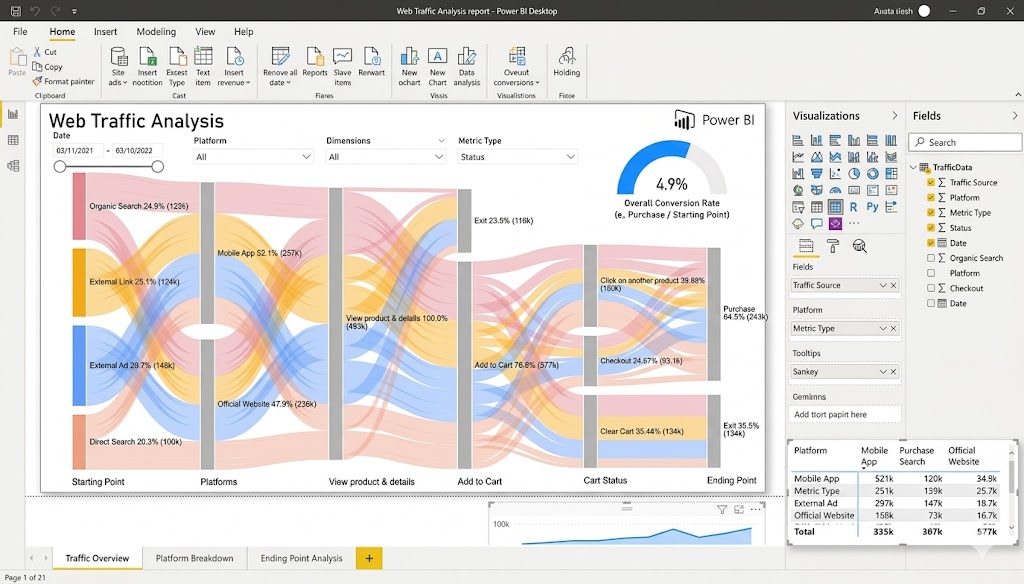
A sales pipeline dashboard visualizes the entire customer journey from leads to closed deals. It helps track deal progress, conversion rates, and forecast future revenue.

Sales managers use it to identify bottlenecks in the pipeline and improve conversion efficiency at each stage.

Sales Pipline
  • Customer Segment Sales

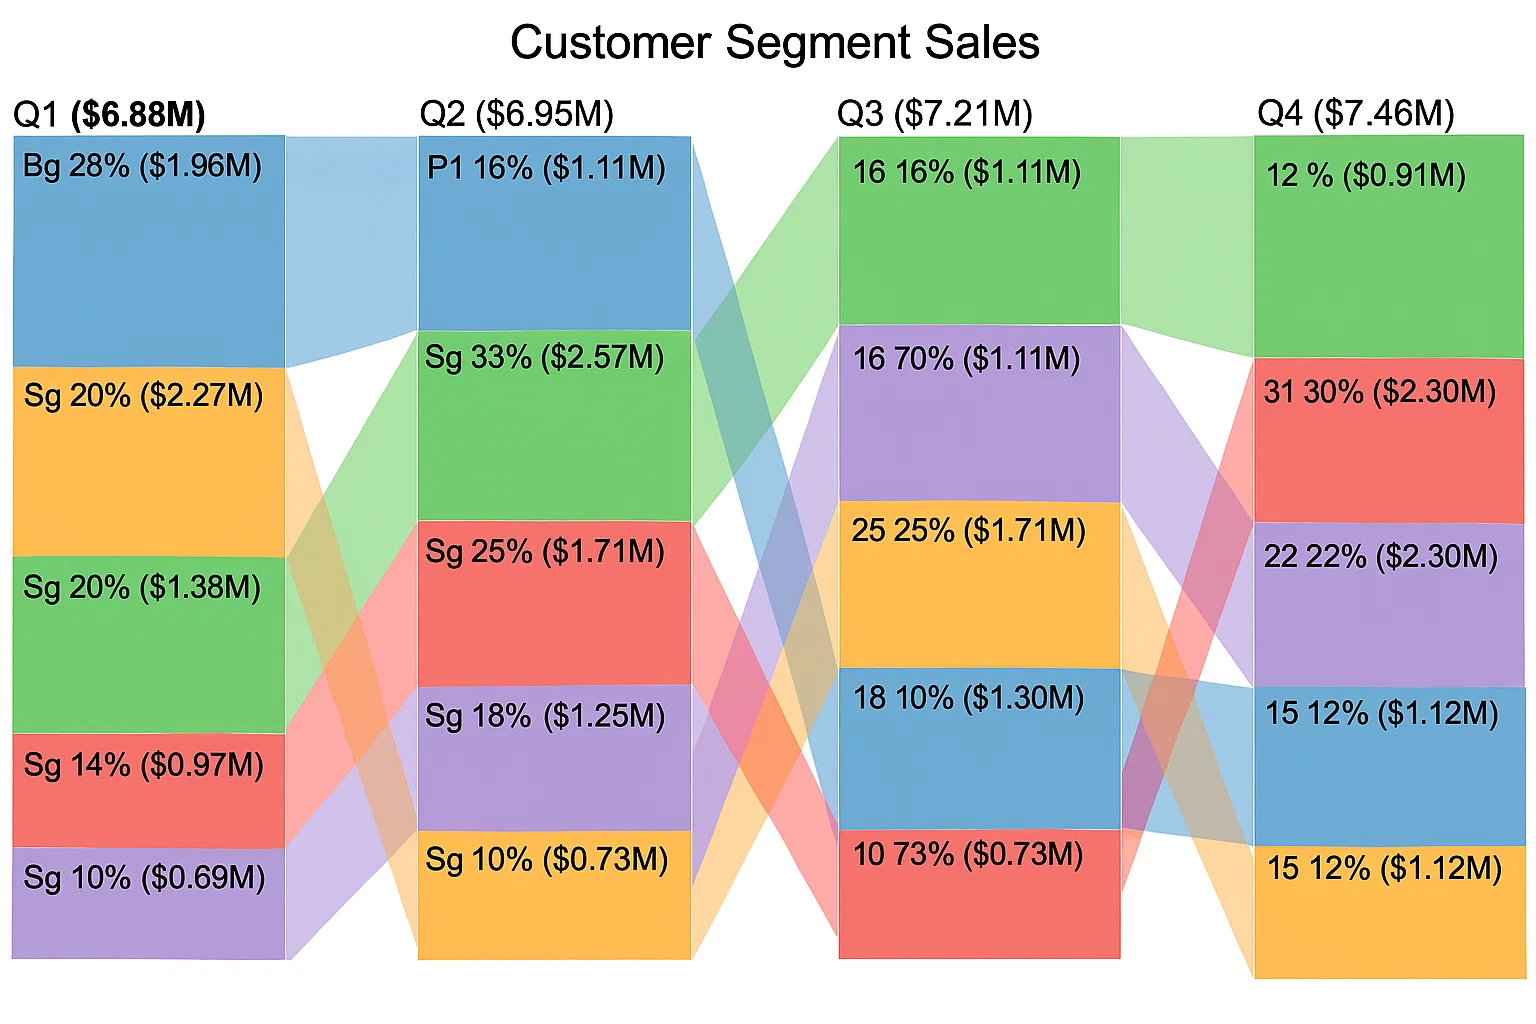
This dashboard breaks down sales based on customer groups, such as new vs returning customer segments. It helps identify which customer groups contribute most to revenue.

It also supports targeted marketing and upselling strategies by revealing high-value customer segments.

Customer Segment Sales

How to Create a Power BI Sales Dashboard?

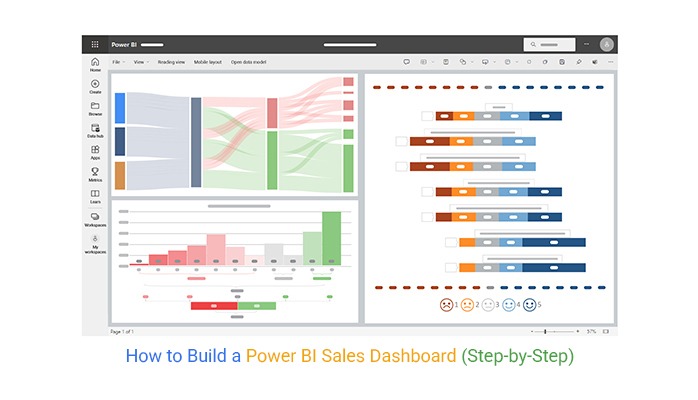
Below is a step-by-step process.

Step 1: Collect and Import Sales Data

  • Gather sales data from sources like Excel files, CRM systems, or databases. Import the data into Power BI to create a centralized dataset for analysis.

Step 2: Clean and Transform Data

  • Use Power Query Editor to remove duplicates, fix errors, and standardize formats. Ensure fields like date, revenue, product, and region are properly structured for analysis.

Step 3: Build Data Model

  • Create relationships between tables such as sales, products, customers, and regions. A strong data model ensures accurate reporting and smooth filtering across visuals.

Step 4: Create Key Measures (KPIs)

  • Define important metrics like total revenue, profit, sales growth, and units sold using DAX formulas. These KPIs form the foundation of your dashboard insights.

Step 5: Design Visual Layout

  • Add visuals such as Sankey charts, line charts, KPI cards, and maps. Arrange them logically so users can first see overall performance and then explore details.

Step 6: Add Filters and Interactivity

  • Include slicers for date, region, product category, and sales channels. This allows users to explore specific segments of data easily.

Step 7: Enhance Visual Insights Using Advanced Charts

  • Add advanced visuals like funnel charts, heat maps, or custom charts to uncover deeper sales patterns. Tools like ChartExpo can be used here to extend visualization options beyond default Power BI charts.

Step 8: Publish and Share Dashboard

  • Once finalized, publish the dashboard to the Power BI Service. Share it with stakeholders so teams can access real-time sales insights anytime.
final Power bi sales dashboard

You can add more charts to this dashboard according to your needs.

Benefits of Sales Dashboard in Power BI

Faster and Clear Decision-Making

  • It brings all key sales metrics into one view, helping teams quickly understand performance and make decisions without waiting for manual reports.

Real-Time Sales Tracking

  • Sales dashboard in Power BI connects to live data sources, allowing businesses to monitor revenue, profit, and sales activity as it happens instead of relying on outdated reports.

Better Visibility Across Sales Performance

  • It provides a complete view of sales across regions, products, teams, and channels, making it easier to identify what is working and what is not.

Improved Sales Efficiency

  • By reducing manual reporting work, sales teams spend less time preparing data and more time analyzing performance and improving strategies.

Stronger Performance Monitoring

  • Built-in KPIs and visual tracking make it easier to measure progress against targets and quickly spot underperforming areas that need attention.

Tips For Power BI Sales Dashboard Ideas

Focus on the Right KPIs

  • Select only the most important metrics such as revenue, profit, sales growth, and conversion rate. Avoid adding too many KPIs as it reduces clarity and focus.

Design for Quick Understanding

  • Place the most important insights at the top of the dashboard. Use a clean layout so users can understand overall performance in a few seconds.

Use Interactive Filters Wisely

  • Add slicers for date, region, product, and sales channel. This allows users to explore specific data segments without creating multiple reports.

Highlight Trends, Not Just Numbers

  • Include line charts and trend visuals to show how performance changes over time. This helps users understand growth patterns and seasonal shifts.

Keep Visuals Simple and Consistent

  • Use consistent colors, formats, and chart types. Avoid cluttered visuals so the dashboard remains easy to read and interpret, especially when designing business views like healthcare dashboard examples, where clarity directly impacts decision-making speed and accuracy

FAQs

What is the sales revenue dashboard in Power BI?

A sales revenue dashboard in Power BI is an interactive report that visualizes total sales, revenue trends, and key performance metrics in one place to help track business performance and targets.

Can Power BI be used for sales?

Yes, Power BI is widely used for sales because it helps teams analyze performance, track KPIs, monitor revenue, and make data-driven decisions using real-time dashboards.

How do you show sales data in Power BI?

Sales data in Power BI is shown using interactive visuals like bar charts, line charts, maps, and KPI cards, along with filters and drill-down features for deeper analysis.

Wrap Up

A Power BI sales dashboard helps turn raw sales data into clear, structured insights that support better decision-making.

It brings key metrics like revenue, profit, and performance trends into a single view, making it easier to monitor business performance and identify opportunities for improvement.

Its interactive features allow users to explore data in detail, track changes over time, and understand what is driving sales results.

This makes it a practical tool for improving visibility and supporting data-driven sales strategies.

As shown in the examples above, Power BI sales dashboards can be adapted to different business needs, from regional sales tracking to pipeline analysis and product performance monitoring.

To take visualization further, ChartExpo can be used to extend Power BI’s default charting options and create more meaningful and easy-to-understand visuals for deeper sales insights.

How much did you enjoy this article?

PBIAd2
Start Free Trial!
127710

Related articles

next previous
Power BI10 min read

Top 7 Power BI Reports Examples for Better Insights

Discover diverse and high-quality Power BI report examples for inspiration and insights. Elevate your reporting with strategic visualization techniques.

Power BI12 min read

CRM Dashboard for Real-Time Sales Insights

A Customer Relationship Management Dashboard centralizes data, tracks key metrics, and drives smarter business decisions. Discover now!

Power BI10 min read

Top 5 Power BI Healthcare Dashboard Examples & Use Cases

Explore Healthcare Dashboard Examples and learn how to turn complex healthcare data into clear, actionable insights for better decision-making.

Power BI10 min read

Power BI Copilot: Best Tips for Faster Insights

Power BI Copilot converts natural language into instant reports, dashboards, and data insights for teams at every level. Read on to learn more!

Power BI10 min read

Recruitment Dashboard: What to Track and Why It Matters

Recruitment dashboards turn hiring data into real-time KPIs. Track metrics, reduce time-to-hire, and remove bottlenecks. Learn more!

ChartExpo logo

Turn Data into Visual
Stories

CHARTEXPO

  • Home
  • Gallery
  • Videos
  • Services
  • Pricing
  • Contact us
  • FAQs
  • Privacy policy
  • Terms of Service
  • Sitemap

TOOLS

  • ChartExpo for Google Sheets
  • ChartExpo for Microsoft Excel
  • Power BI Custom Visuals by ChartExpo
  • Word Cloud

CATEGORIES

  • Bar Charts
  • Circle Graphs
  • Column Charts
  • Combo Charts
  • Comparison Charts
  • Line Graphs
  • PPC Charts
  • Sentiment Analysis Charts
  • Survey Charts

TOP CHARTS

  • Sankey Diagram
  • Likert Scale Chart
  • Comparison Bar Chart
  • Pareto Chart
  • Funnel Chart
  • Gauge Chart
  • Radar Chart
  • Radial Bar Chart
  • Sunburst Chart
  • see more
  • Scatter Plot Chart
  • CSAT Survey Bar Chart
  • CSAT Survey Chart
  • Dot Plot Chart
  • Double Bar Graph
  • Matrix Chart
  • Multi Axis Line Chart
  • Overlapping Bar Chart
  • Control Chart
  • Slope Chart
  • Clustered Bar Chart
  • Clustered Column Chart
  • Box and Whisker Plot
  • Tornado Chart
  • Waterfall Chart
  • Word Cloud
  • see less

RESOURCES

  • Blog
  • Resources
  • YouTube
SIGN UP FOR UPDATES

We wouldn't dream of spamming you or selling your info.

© 2026 ChartExpo, all rights reserved.