Categories
Healthcare organizations generate large volumes of data every day, including patient records, treatment outcomes, staffing performance, and financial reports.
On their own, these datasets are difficult to interpret and often remain underutilized.
Healthcare dashboard examples solve this problem by converting raw data into structured visual insights.
They bring key performance indicators (KPIs) into a single view, making it easier to track performance, identify trends, and support faster decision-making.
Instead of reviewing disconnected reports or large spreadsheets, healthcare teams can instantly understand what is happening across departments and act with greater accuracy.
Definition: A Healthcare Dashboard is a visual analytics tool used to monitor, track, and analyze healthcare data in a centralized view.
It transforms complex clinical, operational, and financial information into interactive charts, KPIs, and reports that help healthcare professionals make faster and more informed decisions.
These dashboards are commonly used to track metrics such as patient admissions, bed occupancy, treatment outcomes, staff performance, readmission rates, and patient satisfaction.
By presenting real-time insights in an easy-to-understand format, they help hospitals and healthcare organizations improve operational efficiency, optimize resource allocation, enhance patient care, and support regulatory compliance.
Healthcare organizations manage large volumes of clinical, operational, and financial data every day.
Without a centralized reporting system, it becomes difficult to track performance, identify issues, and make timely decisions.
Tracking the right healthcare metrics helps organizations improve patient care, optimize operations, and make more informed decisions. Below are some of the most important KPIs commonly monitored in dashboards.
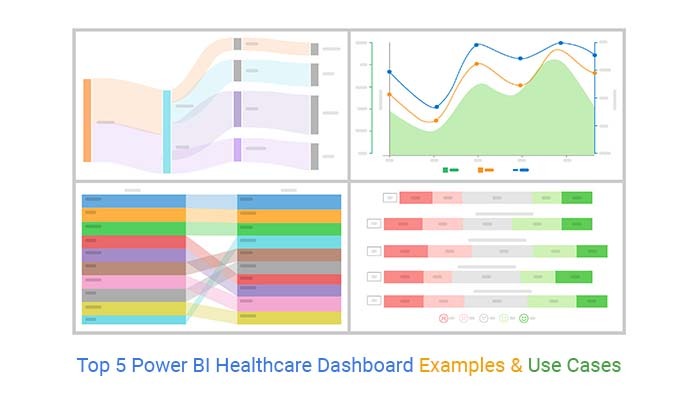
Below are some of the most effective healthcare dashboard examples used for clinical, operational, and financial analysis.
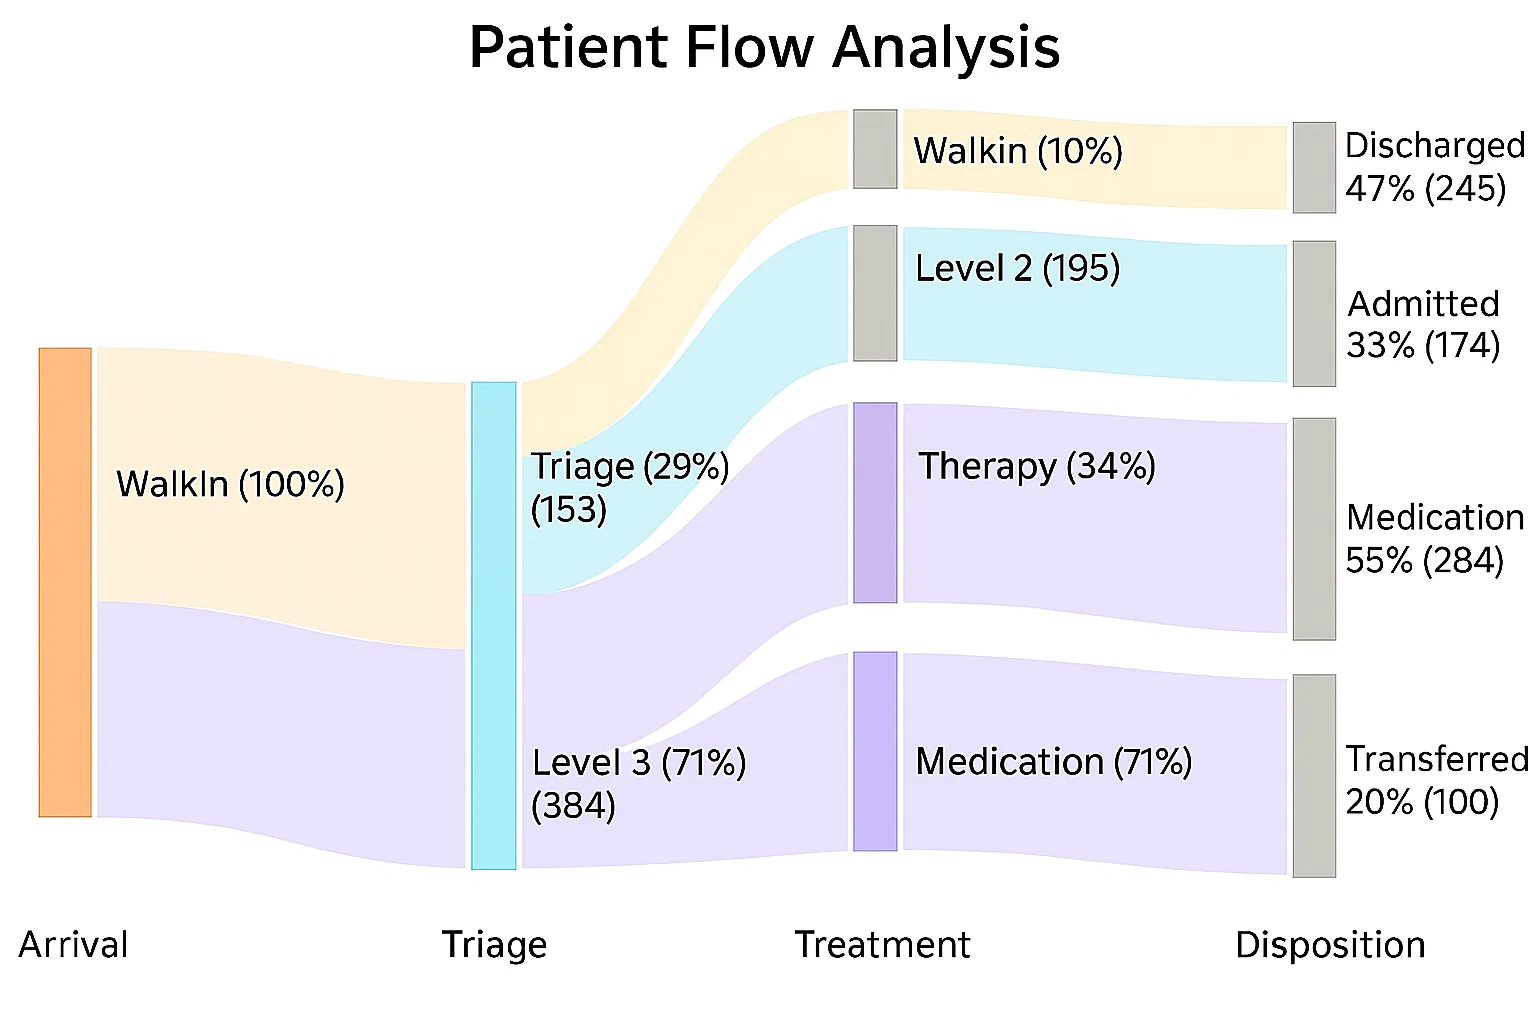
A patient flow analysis dashboard helps hospitals monitor how patients move through different stages of care, from admission to discharge.
It provides visibility into emergency room activity, inpatient transfers, discharge delays, and waiting times.
Healthcare teams use this dashboard to reduce bottlenecks, improve patient throughput, and optimize hospital capacity planning.
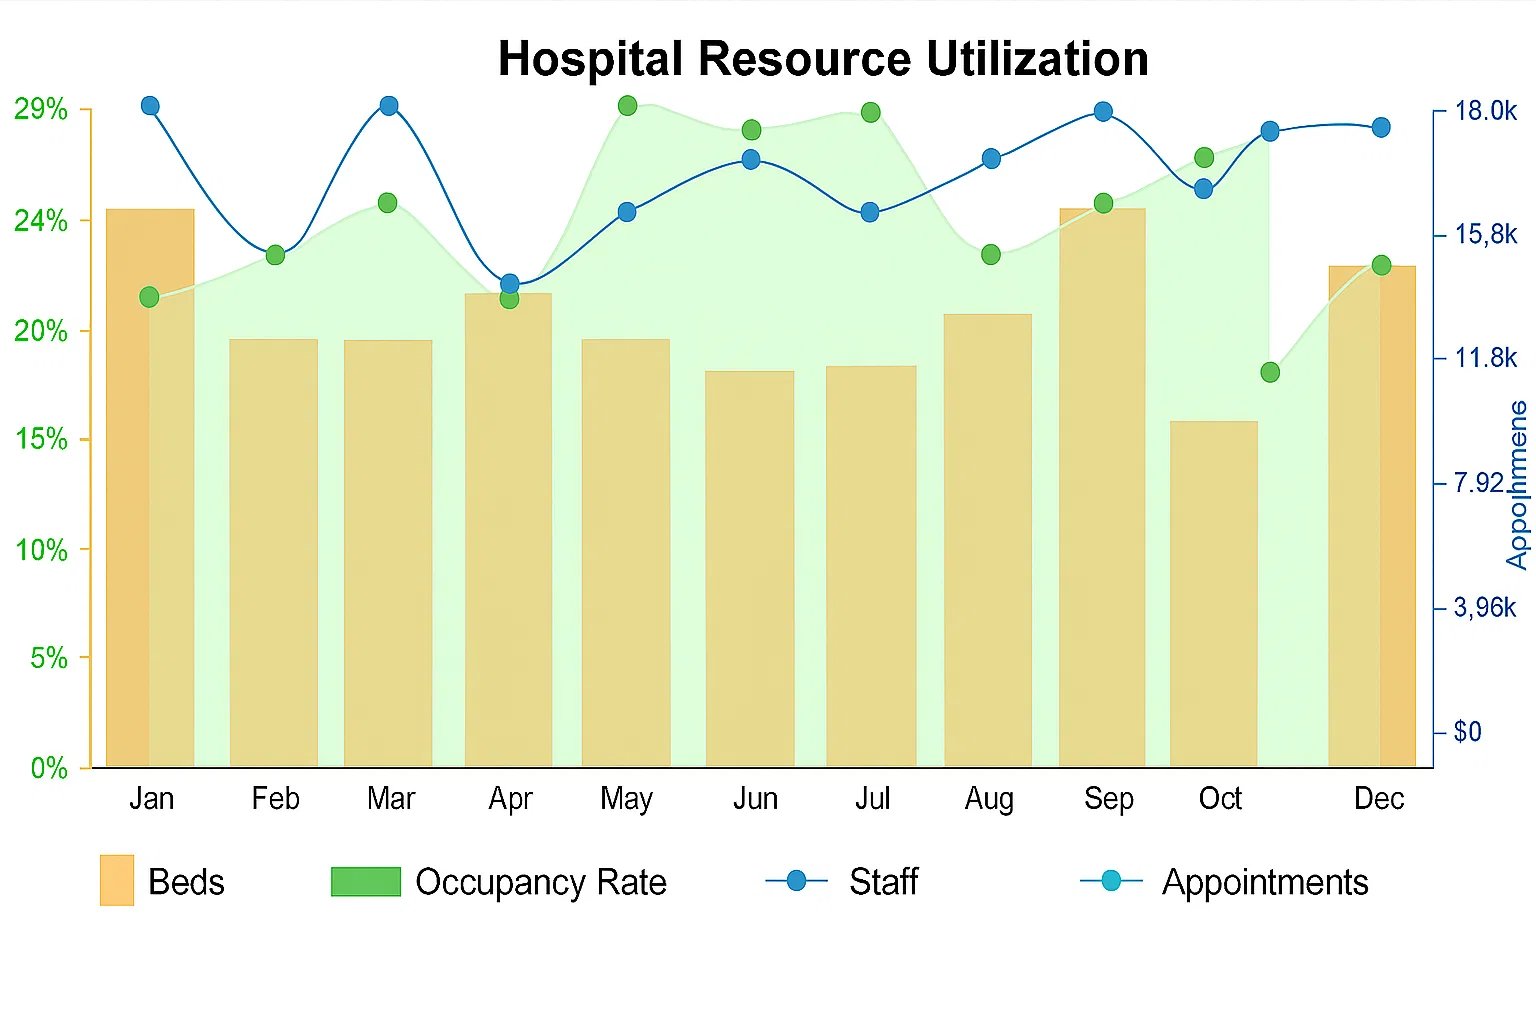
This dashboard focuses on tracking the usage of critical healthcare resources such as hospital beds, medical staff, equipment, and operating rooms.
Healthcare administrators use it to monitor occupancy levels, identify underutilized resources, and improve workforce planning.
It helps organizations maintain operational efficiency while avoiding shortages during high-demand periods.
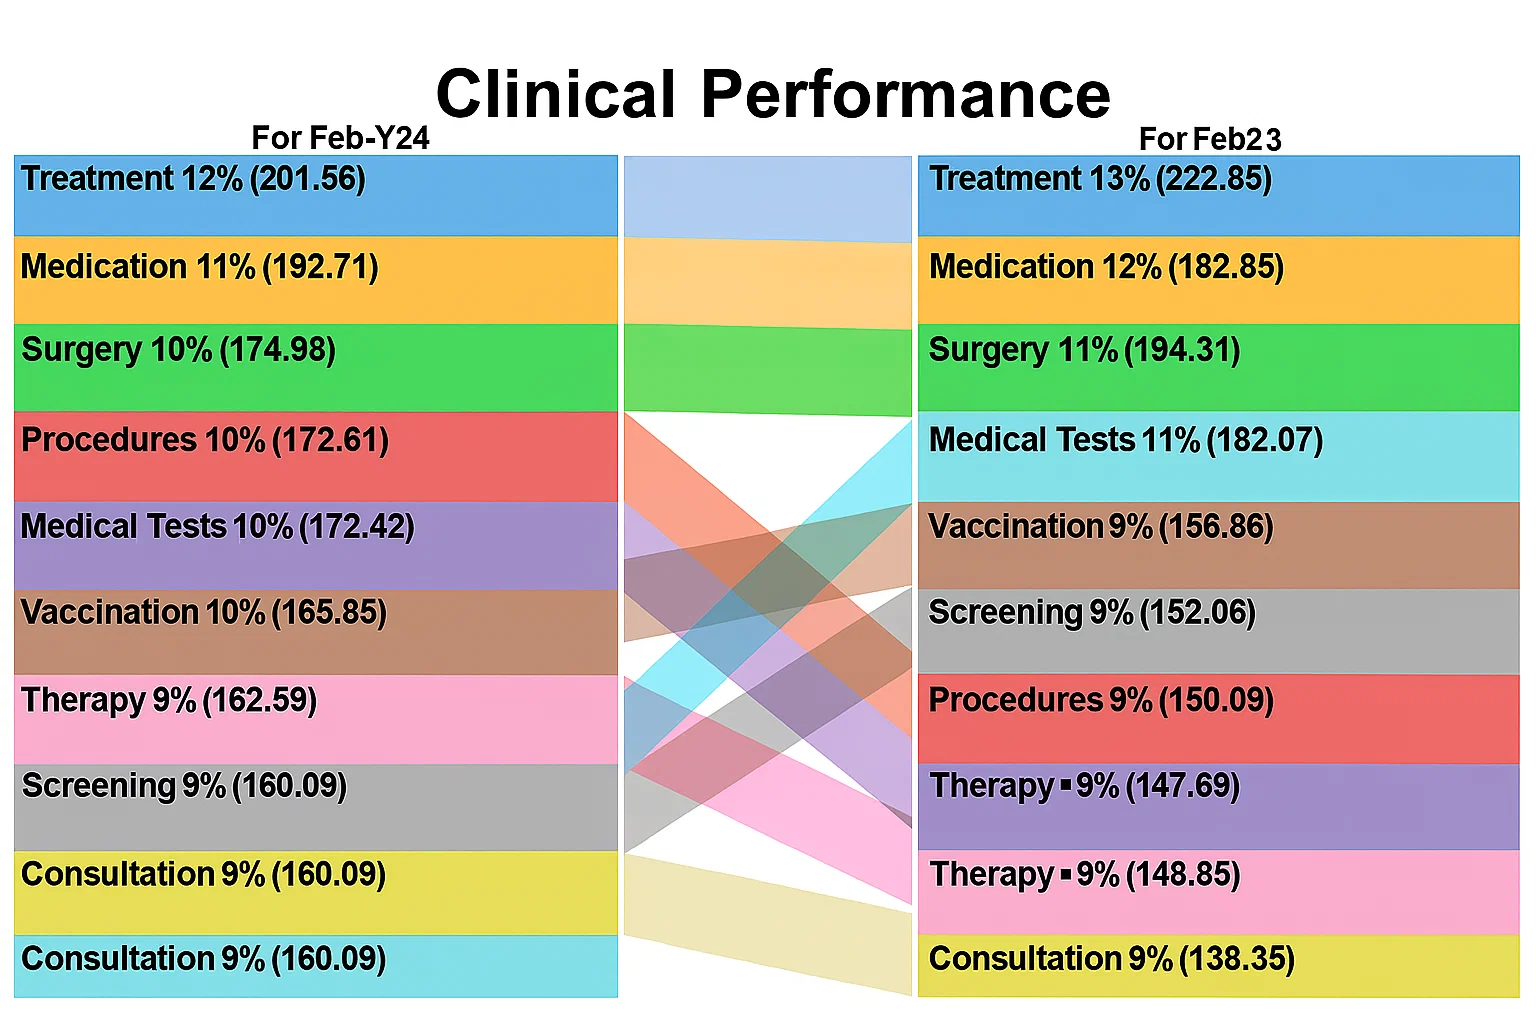
A clinical performance dashboard tracks healthcare quality metrics and treatment outcomes across departments.
Common KPIs include infection rates, readmission rates, medication errors, treatment effectiveness, and patient recovery trends.
These insights help healthcare providers improve clinical performance, maintain compliance standards, and support data-driven patient care decisions.
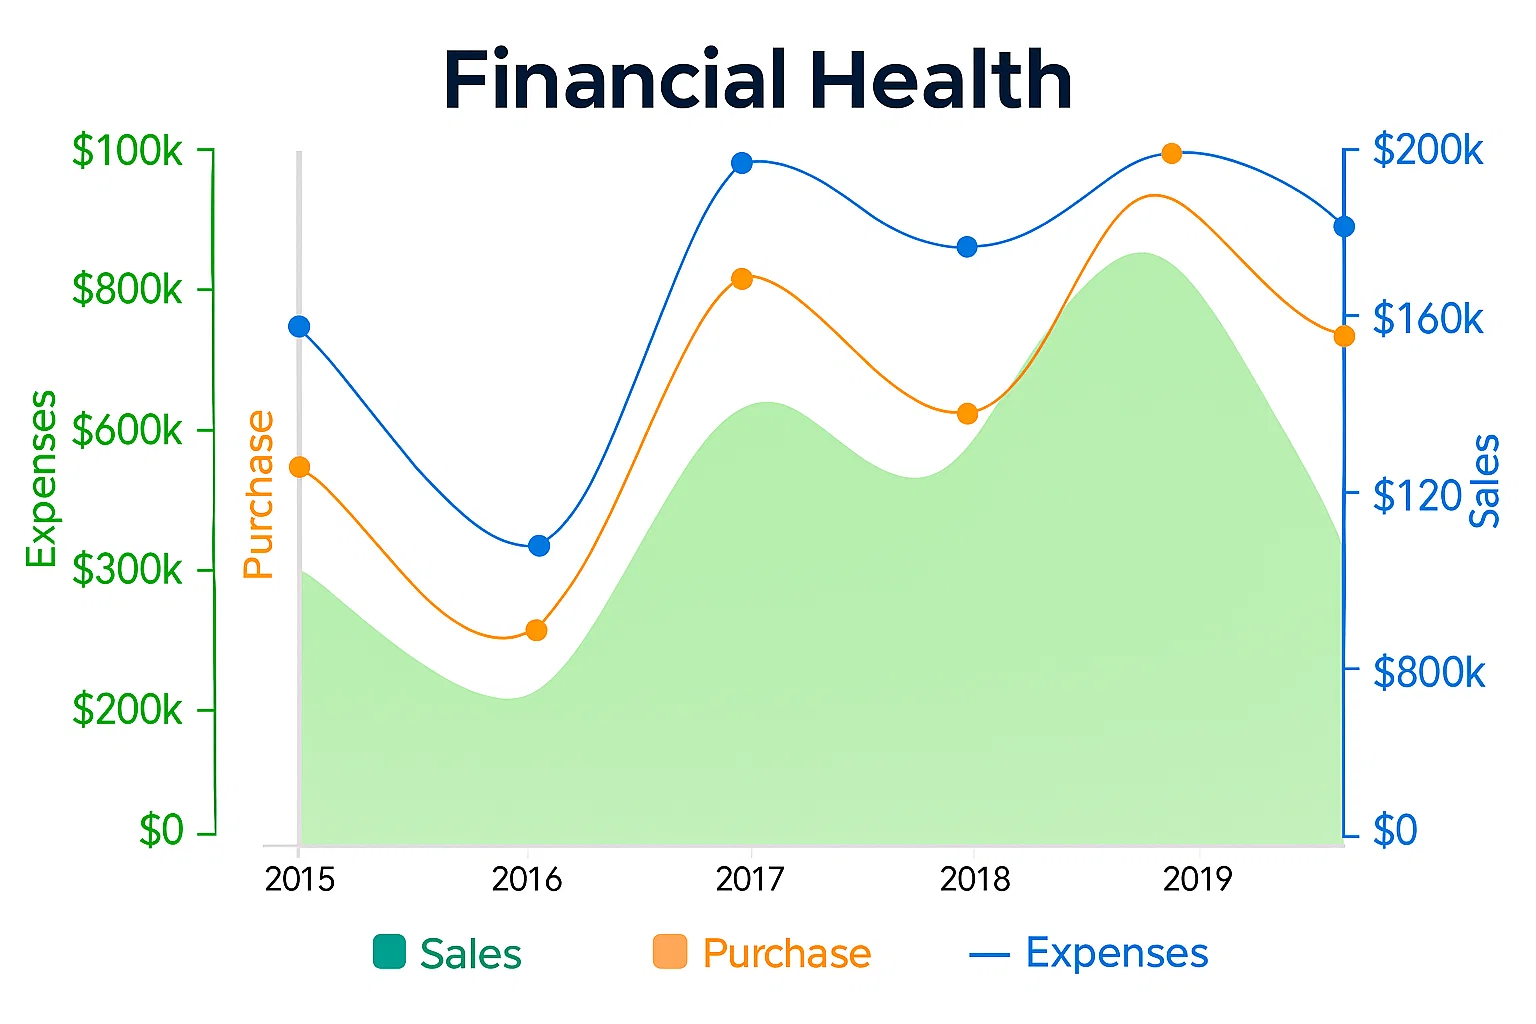
A financial health dashboard provides a centralized view of hospital revenue, expenses, insurance claims, billing performance, and budget trends.
Healthcare leadership teams use this dashboard to monitor financial stability, control operational costs, and evaluate the financial impact of strategic decisions across departments
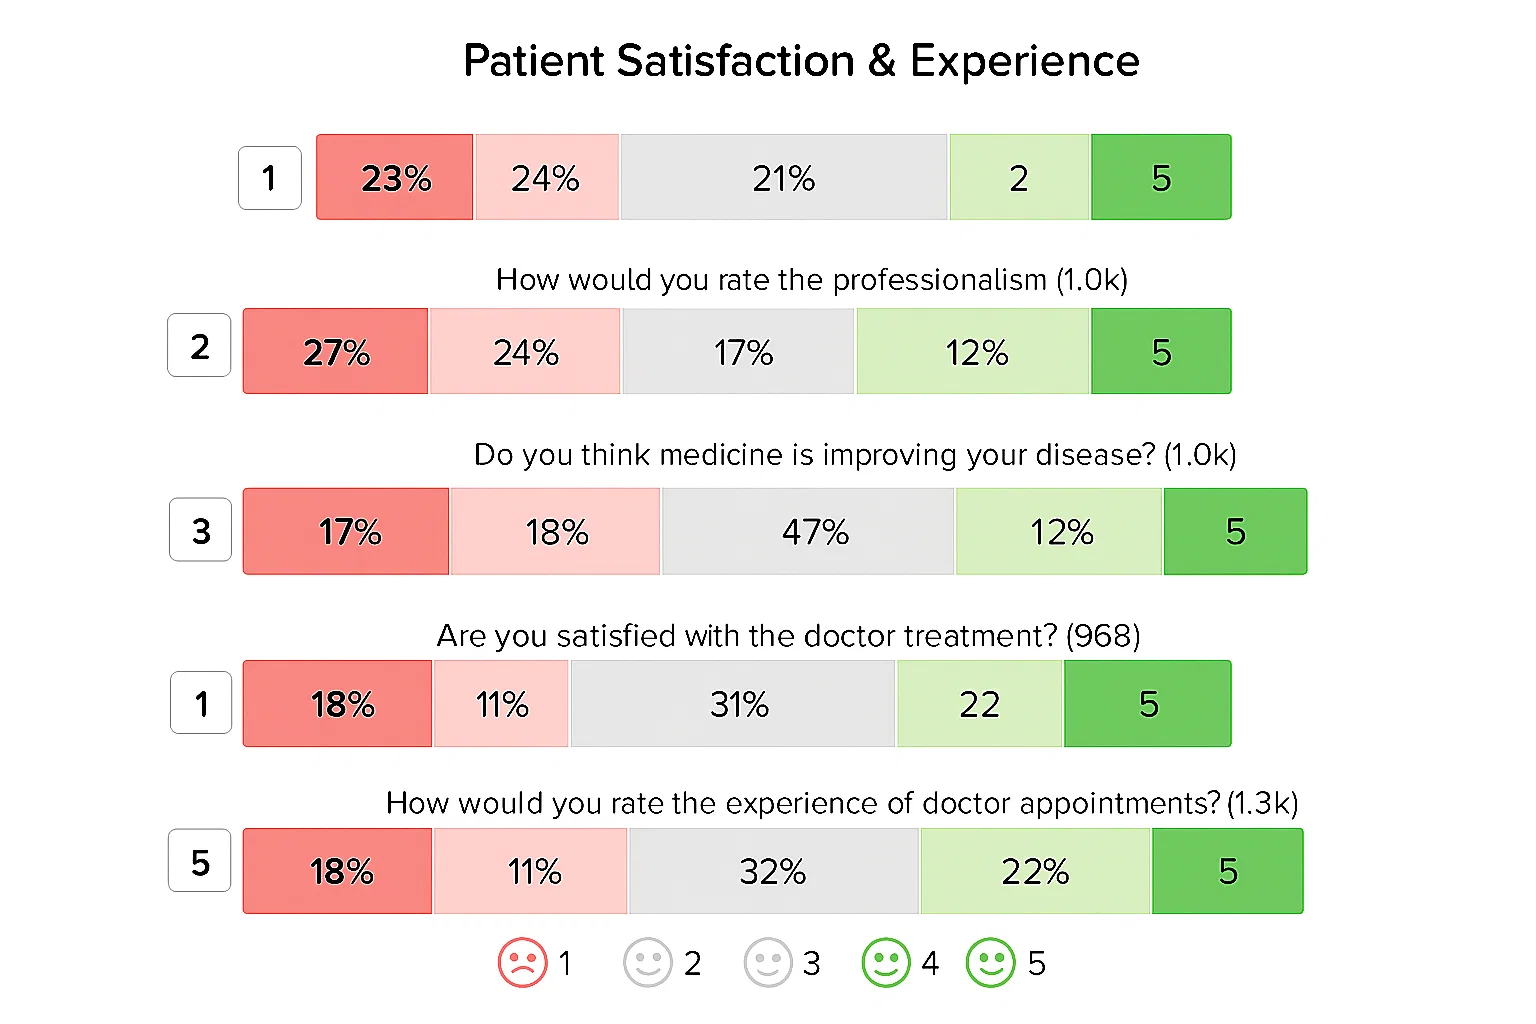
This dashboard analyzes patient feedback, survey responses, and satisfaction scores to measure the overall patient experience.
Healthcare organizations use it to identify service gaps, improve communication, and enhance patient engagement.
Monitoring satisfaction trends also helps hospitals strengthen care quality and long-term patient trust.
Follow these simple steps to create an interactive healthcare dashboard in Power BI for monitoring patient flow, hospital operations, and healthcare KPIs more effectively.
Organize your dataset properly before importing it into Power BI.
Your data may include:
Make sure the dataset is clean, structured, and free from duplicate or missing values.
Open Power BI Desktop and connect your healthcare data source.
After importing, review the data model to ensure relationships between tables are correctly connected.
Use a flow visualization to analyze how patients move across departments, treatment stages, or discharge paths.
This helps healthcare organizations:
You can import advanced custom visuals from the Power BI marketplace to improve reporting flexibility.
Add key healthcare metrics to the dashboard for quick monitoring.
Common KPIs include:
These metrics help decision-makers track operational and clinical performance in real time.
Improve readability by organizing visuals into a clean dashboard structure.
You can:
For faster dashboard creation without heavy manual formatting, tools like ChartExpo can help streamline visualization inside Excel and Power BI workflows.
Remove unnecessary clutter and focus only on insights that support decision-making.
Ensure:
This improves usability for both clinical and administrative teams.
Once the dashboard is finalized:
This allows healthcare teams to access real-time insights, collaborate across departments, and monitor healthcare performance from a centralized reporting environment.

Healthcare dashboard templates help organizations transform healthcare data into clear, actionable insights. They improve visibility across operations, clinical performance, and patient management while reducing manual reporting effort.
A dashboard shows real-time data and detailed visual insights across operations like patient flow, staffing, and clinical performance. A scorecard, on the other hand, focuses on tracking performance against specific goals and KPIs over time, making it more strategic and less operational.
Power BI is used in healthcare to visualize patient data, monitor hospital performance, and track KPIs like admissions, readmissions, and resource utilization. It helps healthcare teams turn complex data into interactive reports for faster and more informed decision-making.
Healthcare dashboards turn complex medical data into clear, actionable insights that support better decision-making across hospitals and healthcare systems.
Instead of working with scattered reports and raw numbers, professionals get a unified view of key metrics that improve speed and accuracy in daily operations.
From monitoring patient flow and clinical performance to tracking compliance and resource utilization, these dashboards play a critical role in improving both efficiency and patient care.
They also enhance transparency, allowing healthcare teams and patients to stay more informed and engaged in the care process.
Another key advantage is benchmarking.
Healthcare organizations can compare performance against internal goals or industry standards to identify gaps and improvement opportunities.
This leads to better planning, optimized resources, and improved service quality.
As healthcare data continues to grow in volume and complexity, dashboard tools are becoming more advanced and intuitive.
Modern visualization solutions like ChartExpo are making it easier to build clear, interactive reports without heavy technical effort.
Overall, healthcare dashboard examples are no longer optional. They are becoming essential for delivering smarter, faster, and more data-driven healthcare outcomes.
How much did you enjoy this article?


Discover diverse and high-quality Power BI report examples for inspiration and insights. Elevate your reporting with strategic visualization techniques.

A Customer Relationship Management Dashboard centralizes data, tracks key metrics, and drives smarter business decisions. Discover now!

Power BI Copilot converts natural language into instant reports, dashboards, and data insights for teams at every level. Read on to learn more!