• Home
  • Tools dropdown img
    • Spreadsheet Charts

      • ChartExpo for Google Sheets
      • ChartExpo for Microsoft Excel
    • Power BI Charts

      • Power BI Custom Visuals by ChartExpo
    • Word Cloud

  • Charts dropdown img
    • Chart Category

      • Bar Charts
      • Circle Graphs
      • Column Charts
      • Combo Charts
      • Comparison Charts
      • Line Graphs
      • PPC Charts
      • Sentiment Analysis Charts
      • Survey Charts
    • Chart Type

      • Box and Whisker Plot
      • Clustered Bar Chart
      • Clustered Column Chart
      • Comparison Bar Chart
      • Control Chart
      • CSAT Survey Bar Chart
      • CSAT Survey Chart
      • Dot Plot Chart
      • Double Bar Graph
      • Funnel Chart
      • Gauge Chart
      • Likert Scale Chart
      • Matrix Chart
      • Multi Axis Line Chart
      • Overlapping Bar Chart
      • Pareto Chart
      • Radar Chart
      • Radial Bar Chart
      • Sankey Diagram
      • Scatter Plot Chart
      • Slope Chart
      • Sunburst Chart
      • Tornado Chart
      • Waterfall Chart
      • Word Cloud
    • Google Sheets
      Microsoft Excel
  • Services
  • Pricing
  • Contact us
  • Blog
  • Support dropdown img
      • Gallery
      • Videos
      • Contact us
      • FAQs
      • Resources
    • Please feel free to contact us

      atsupport@chartexpo.com

Categories
All Data Visualizations Data Analytics Surveys
Add-ons/
  • Google Sheets
  • Microsoft Excel
  • Power BI
All Data Visualizations Data Analytics Surveys
Add-ons
  • Google Sheets
  • Microsoft Excel
  • Power BI

We use cookies

This website uses cookies to provide better user experience and user's session management.
By continuing visiting this website you consent the use of these cookies.

Ok

ChartExpo Survey


Home > Blog > Power BI

Perfect BI Reporting Tools to Simplify Data Analysis

The core definition of business intelligence (BI) has not changed, but how businesses use it has evolved. BI technology has become more user-friendly and accessible, leading to a variety of use cases.

BI Reporting Tools

BI tools automate many processes, making managing and using data easier. Whether you’re a data guru or a newbie, BI reporting tools cater to every analytic need. They remove bottlenecks, reduce grunt work, and validate business growth. With a few clicks, you’ll uncover insights that will leave you spellbound.

That’s not all.

With BI reporting tools, you can effortlessly display data in various insightful, appealing forms. It’s like turning your boring spreadsheets into a vibrant work of art.

Hop on board the BI Reporting tool train to revolutionize your data analysis.

Trust me; it’s a journey you won’t regret.

In the end, you’ll conquer the world of data analysis with a wit sharper than Sherlock Holmes.

Table of Contents:

  1. What are Business Intelligence Reporting Tools?
  2. Why Use Business Intelligence Reporting Tools?
  3. Charts We Can Create Through BI Reporting Tools
  4. How to Use Business Intelligence Reporting Tool?
  5. Wrap Up

What are Business Intelligence Reporting Tools?

Business intelligence reporting tools involve gathering, analyzing, and presenting data to facilitate informed business decision-making. It entails extracting data from diverse sources and transforming it into valuable insights through reports or dashboards. Employing BI reporting enables you to;

  • Get actionable insights.
  • Monitor performance.
  • Identify trends.
  • Make informed business decisions.

Why Use Business Intelligence Reporting Tools?

Are you tired of playing hide and seek with your business data? It’s time to level up your reporting game and unleash the power of BI reporting tools.

Why do we use business intelligence reporting tools?

  • Data-driven decision-making: BI reporting tools provide complete and accurate business data access. This enables data-driven decision-making based on factual insights rather than intuition or incomplete information.
  • Enhanced data analysis: BI reporting tools offer advanced visual analytics, allowing you to dive deep into data and identify patterns, trends, and correlations. As a result, this helps gain valuable insights for strategic planning and forecasting.
  • Improved operational efficiency: BI reporting tools save time and effort by centralizing and automating data collection and report processes. Thus, you can streamline operations, eliminate manual tasks, and focus on analyzing data and making informed decisions.
  • Performance monitoring: Business intelligence reporting tools enable real-time monitoring of key performance indicators (KPIs). This helps you track progress, identify areas for improvement, and take prompt action to address issues.
  • Competitive advantage: Leveraging business intelligence reporting tools facilitate quick analysis of market trends, customer behavior, and competitor performance through competitive analysis. Then, you can appropriately adapt your strategies to stay ahead of the competition with a strong market standing.

Charts We Can Create Through BI Reporting Tools

One crucial element of a comprehensive BI report is the use of charts. Including charts in a BI report enhances readability and helps present data meaningfully. For instance, integrating YouTube analytics can provide valuable insights into video performance and audience engagement. Here are some charts you can use in your BI report to communicate data and insights effectively.

  • Area Chart

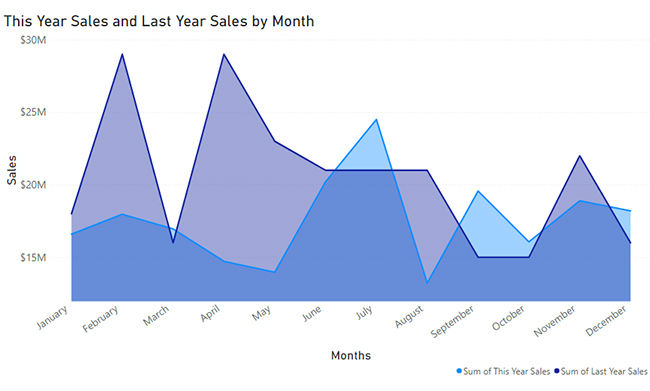
An Area Chart is similar to a Line Chart but emphasizes the cumulative total of a variable. Area charts are commonly used to show trends and compare multiple data series. The filled area between the lines makes it easy to compare the relative contributions of each data series.

The sample Area Chart below emphasizes the total profit of the sales data plotted.

Area Chart ce347
  • Doughnut Chart

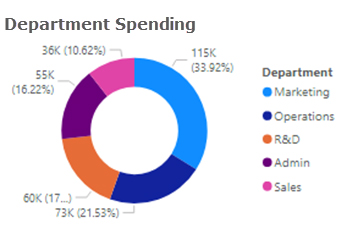
A Doughnut Chart is similar to a Pie Chart but with a hole in the center, creating a “doughnut” shape. It represents data divided into categories or parts, showing the relationship of each part to the whole. The size of each segment represents the proportion or percentage of that category within the total.

Doughnut Chart ce347
  • Treemap

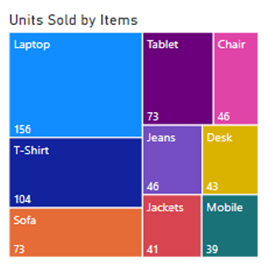
A Treemap displays hierarchical or tree-structured data using nested rectangles. Each rectangle represents a category within the hierarchy. The size or color of the rectangle can be used to represent a quantitative variable. Treemaps are often used in data analysis, information visualization, and disk space analysis.
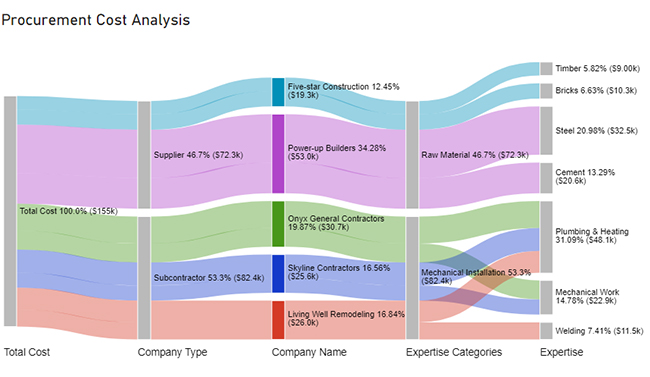
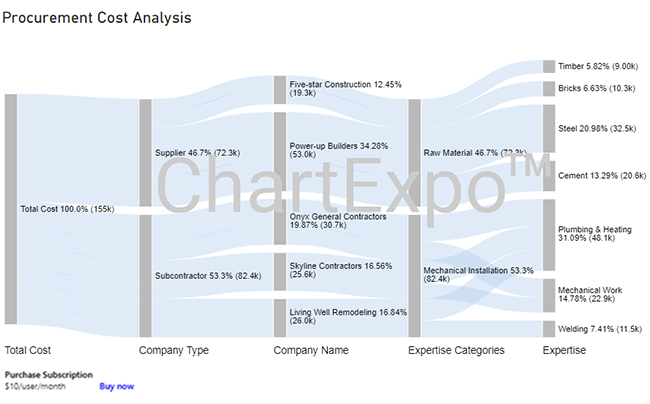
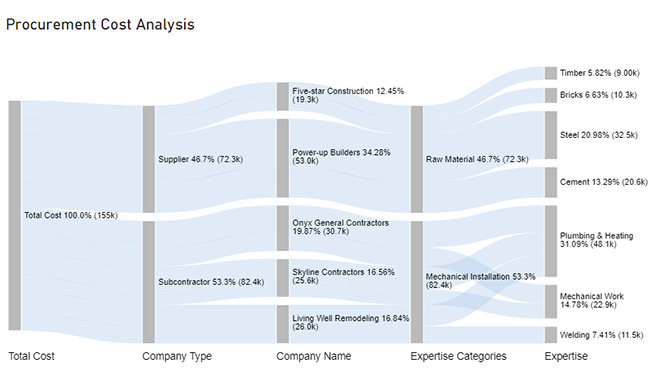
Treemap ce347
  • Sankey Diagram

A Sankey Diagram is a flow diagram that represents the flow of quantities or values through a system. It uses arrows of varying widths to represent the flow quantity. The width of the arrows corresponds to the magnitude of the flow. Sankey diagrams illustrate the flow, facilitating easy identification of the system’s major contributors or bottlenecks, much like a web analytics dashboard highlights key traffic sources and user behavior.

Sankey Diagram ce347

How to Use Business Intelligence Reporting Tool?

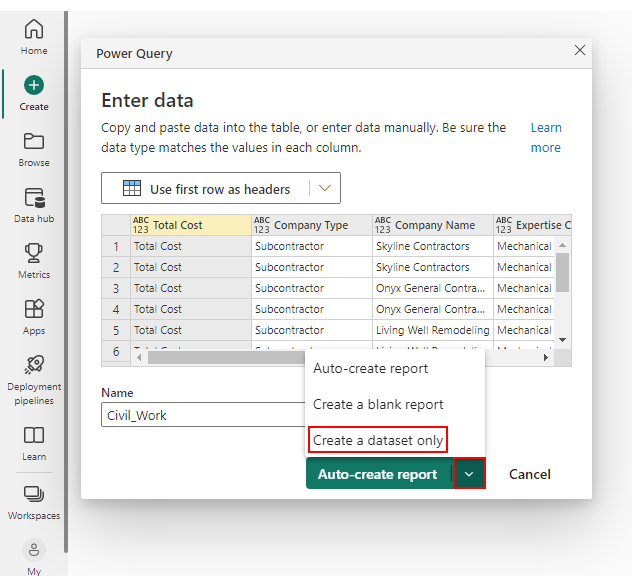
Let’s learn how to use business intelligence reporting software to create a BI report.

Stage 1: Logging in to Power BI

  • Log in to Power BI.
  • Enter your email. Click the “Submit” button.
Enter email to login to Power BI
  • You are redirected to your Microsoft account.
  • Enter your password and click “Sign in”.
Enter Password to login to Power BI
  • Choose whether to stay signed in.
Click on stay signed in
  • Once done, the Power BI home screen will open.

Stage 2: Creating a Data Set and Selecting the Data Set to Use in Your Sankey Chart

  • Click on the “Create” option on the left-side menu.
  • Select ”Paste or manually enter data“.
select Paste or manually enter data in Power BI
  • We’ll use the following cash flow data for this example.
Total Cost Company Type Company Name Expertise Categories Expertise Cost
Total Cost Subcontractor Skyline Contractors Mechanical Installation Plumbing & Heating 15456
Total Cost Subcontractor Skyline Contractors Mechanical Installation Mechanical Work 10159
Total Cost Subcontractor Onyx General Contractors Mechanical Installation Plumbing & Heating 18045
Total Cost Subcontractor Onyx General Contractors Mechanical Installation Mechanical Work 12695
Total Cost Subcontractor Living Well Remodeling Mechanical Installation Plumbing & Heating 14589
Total Cost Subcontractor Living Well Remodeling Mechanical Installation Welding 11456
Total Cost Supplier Power-up Builders Raw Material Cement 20561
Total Cost Supplier Power-up Builders Raw Material Steel 32456
Total Cost Supplier Five-star Construction Raw Material Bricks 10253
Total Cost Supplier Five-star Construction Raw Material Timber 9000
  • Paste the above data table into the “Power Query” window.
  • Select the “Create a dataset only” option.
Create Dataset in Power BI ce347
  • Click on the “Data Hub” option on the left-side menu.
  • Power BI populates the data set list. (If you have not created a data set, refer to the Error! Reference source not found section.)
Click on Data Hub
  • Choose the data set you want to use to create your Sankey diagram.
  • Power BI populates the screen as shown below:
Workspace in Power BI
  • The data set and its fields are shown on the right side. The middle area shows report and data set options.
  • Click on the “Create a report” dropdown.
  • Select “Start from scratch“.
  • You should see the Report Canvas screen as shown below:
Create Report and start from scratch

Stage 3: Adding the Power BI Sankey Diagram Extension by ChartExpo

  • Creating the Sankey Diagram requires us to use an add-in or Power BI visual from AppSource.
  • Navigate to the right side of the Power BI dashboard.
  • Open the Power BI Visualizations panel.
  • Click the ellipsis symbol (…) as highlighted in the diagram below. This will import the Power BI Sankey Diagram extension by ChartExpo.
Report Canvas screen in Power BI
  • The following menu opens:
  • Select the “Get more visuals” option.
  • The following window opens:
click on to get more visuals
  • Enter “Sankey Diagram for Power BI by ChartExpo” in the highlighted search box.
  • You should see the “Sankey Diagram for Power BI by ChartExpo” as shown in the image below.
Sankey Diagram for Power BI by ChartExpo
  • Click the highlighted “Add” button.
Click the Add button
  • Power BI will add the “Sankey Diagram for Power BI by ChartExpo” icon in the visualization panel.
Click on Sankey Diagram Icon

Stage 4: Drawing a Sankey Diagram with ChartExpo’s Power BI extension

  • Select the “Sankey Diagram for Power BI by ChartExpo” icon in the visualization panel.
  • The following window opens in the report section of your dashboard:
Report Section in Dashboard
  • You can resize the visual as needed.
  • Navigate to the right side of your Power BI dashboard.
  • You should see “Fields” next to “Visualizations.”
Fields next to visualizations
  • You’ll select the fields to use in your Sankey chart here.
  • The ChartExpo visual needs to be selected, though. Select the fields in the following sequence:
    • Total Cost
    • Company Type
    • Company Name
    • Expertise Categories
    • Expertise
    • Cost
Select fields for Sankey diagram
  • You’ll be asked for a ChartExpo license key or email address.
enter email for ChartExpo license

Stage 5: Activate your ChartExpo Trial or Apply a Subscription Key

  • Select the ChartExpo visual. You should see three icons below “Build Visual” in the Visualizations panel.
Build visual panel in Power BI
  • Select the middle icon, “Format visual“.
  • The visual properties will be populated as shown below.
visual properties in Power BI
  • If you are a new user,
    • Type in your email under the section titled “Trial Mode”.
    • This should be the email address that you used to subscribe to the ChartExpo add-in. It is where your ChartExpo license key will be sent.
    • Ensure that your email address is valid.
    • Click “Enable Trial“. You’ll get a 7-day trial.
enter email id
  • You should receive a welcome email from ChartExpo.
  • The Sankey Diagram you create under the 7-day trial contains the ChartExpo watermark (see below).
BI Reporting Tools ce347 1
  • If you have obtained a license key:
    • Enter your license key in the “ChartExpo License Key” textbox in the “License Settings” section (see below).
    • Slide the toggle switch next to “Enable License” to “On“.
enter license key
  • Your Sankey diagram should now be ready (see below). Note that it does not have a watermark.
BI Reporting Tools ce347 2
  • Let’s add a Prefix (such as a $ sign) with the numeric values in the chart.
  • Expand the “Stats” properties and include the Prefix value.
BI Reporting Tools ce347 3
  • Let’s add colors to each node. Expand the “Level Colors” properties and select the colors.
coloring Sankey diagram
  • Automatically all changes will be saved.
Final BI Reporting Tools

Insights

  • The total cost of procurement at Level 1 is $155K.
  • At Level 2, out of the $155K cost, $72.3K was spent on suppliers (46.7%), and $82.4K was spent on subcontractors (53.3%).
  • At Level 3;
  • Out of the $72.3K supplier cost;
  • $53.0K was spent on Power-up Builder.
  • $19.3K was spent on Five-star construction.
  • From the $82.4K subcontractor price;
  • $25.6K was spent on Skyline Contactors.
  • $30.7K was spent on Onyx General Contractors.
  • $26.0K was spent on Living Well Remodeling.
  • At Level 4, the suppliers’ companies provided raw materials for procurement, which cost $72.3K. The companies providing Mechanical Installations cost around $82.4K.
  • Out of the $72.3K raw material cost;
  • $20.6K was spent on cement.
  • $32.5K was spent on steel.
  • $10.3K was spent on bricks.
  • $9K was spent on timber.
  • From the $82.4K mechanical installation cost;
  • $48.1K was spent on Plumbing and Heating.
  • $22.9K was spent on Mechanical Work.
  • $11.5K was spent on Welding.

FAQs

Which BI tool is mostly used?

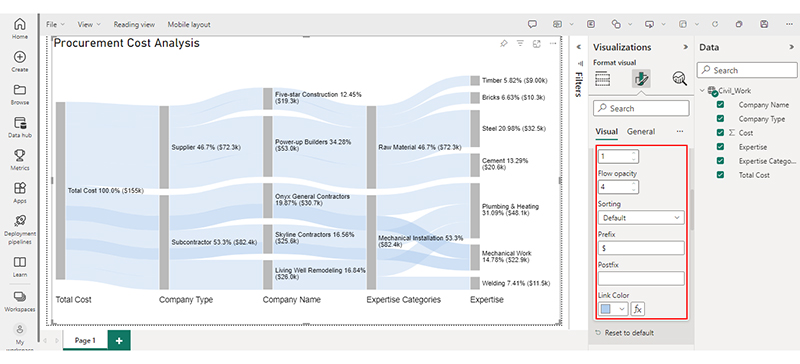
Power BI is the most widely used business intelligence (BI) tool. It offers a user-friendly interface, robust data visualization capabilities, and seamless integration with various data sources. Moreover, Power BI is favored for its versatility, extensive features, and strong community support.

What 4 categories of BI tools are there?

BI tools are categorized into five main categories:

  • Reporting tools.
  • Dashboards and scorecards.
  • Data discovery and visualization tools.
  • Predictive analytics tools.

Wrap Up

BI reporting tools enable businesses to analyze data and make informed decisions. They streamline the process of gathering, dissecting, and presenting data.

The user-friendly interface allows you to easily access and explore data without requiring extensive technical expertise. The ability to generate interactive reports and dashboards enables stakeholders to gain a comprehensive view of the data. Thus, they can quickly identify trends, patterns, and outliers.

Moreover, these tools enhance operational efficiency by automating manual processes and reducing the time spent on data preparation. This allows you to focus more on extracting insights and taking proactive actions.

Power BI provides a centralized platform for sharing and presenting data-driven insights. This enables effective communication and collaboration across teams. Consequently, fostering a data-driven culture within organizations and supporting better decision-making at all levels.

Harnessing the power of BI reporting tools and ChartExpo allows you to unlock the full potential of data. Consequently, gains a competitive edge in the industry.

Don’t be in the dark – shed light on your business with our BI and ChartExpo solutions today.

How much did you enjoy this article?

PBIAd1
Start Free Trial!
127410

Related articles

next previous
Power BI12 min read

How to Create Sankey Diagram in Microsoft Power BI?

Learn How to Create Sankey Diagram in Microsoft Power BI using Desktop & Web Service. What they are and how to use them effectively.

Power BI8 min read

Power BI Artificial Intelligence: Insights Using Visuals

Discover all there is to know about the Power BI artificial intelligence. You'll also discover how AI is used in Power BI, and how to use it for analysis and more.

Power BI9 min read

Budgeting in Healthcare: Use Visuals to Spot Budget Gaps

This guide helps you discover what budgeting in healthcare is. You'll also discover the factors that affect hospital budgets and types of budgeting in healthcare.

Power BI9 min read

Predictive Analytics in Power BI for Making Insightful Visuals

This guide shows you everything you need to know about Predictive Analytics in Power BI. It also shows you how it works, and how to interpret the results.

Power BI8 min read

Quarterly Business Review Template for Optimum Reports

Discover what the quarterly business review template is. This guide also shows you the best practices to consider when using the QBR template.

ChartExpo logo

Turn Data into Visual
Stories

CHARTEXPO

  • Home
  • Gallery
  • Videos
  • Services
  • Pricing
  • Contact us
  • FAQs
  • Privacy policy
  • Terms of Service
  • Sitemap

TOOLS

  • ChartExpo for Google Sheets
  • ChartExpo for Microsoft Excel
  • Power BI Custom Visuals by ChartExpo
  • Word Cloud

CATEGORIES

  • Bar Charts
  • Circle Graphs
  • Column Charts
  • Combo Charts
  • Comparison Charts
  • Line Graphs
  • PPC Charts
  • Sentiment Analysis Charts
  • Survey Charts

TOP CHARTS

  • Sankey Diagram
  • Likert Scale Chart
  • Comparison Bar Chart
  • Pareto Chart
  • Funnel Chart
  • Gauge Chart
  • Radar Chart
  • Radial Bar Chart
  • Sunburst Chart
  • see more
  • Scatter Plot Chart
  • CSAT Survey Bar Chart
  • CSAT Survey Chart
  • Dot Plot Chart
  • Double Bar Graph
  • Matrix Chart
  • Multi Axis Line Chart
  • Overlapping Bar Chart
  • Control Chart
  • Slope Chart
  • Clustered Bar Chart
  • Clustered Column Chart
  • Box and Whisker Plot
  • Tornado Chart
  • Waterfall Chart
  • Word Cloud
  • see less

RESOURCES

  • Blog
  • Resources
  • YouTube
SIGN UP FOR UPDATES

We wouldn't dream of spamming you or selling your info.

© 2025 ChartExpo, all rights reserved.