Categories
Every organization sits on a wealth of data scattered across spreadsheets, cloud applications, databases, and enterprise systems. Turning that raw information into actionable decisions requires a reliable bridge between those systems and your reporting environment.
That bridge is Power BI data sources, and getting it right is the first step toward meaningful business intelligence. When teams connect the right sources, reports transform into live dashboards that reflect real operations as they happen.
From on-premises servers to cloud platforms, each connection feeds structured, validated input into your analytics workflow, enabling sharper tracking, more reliable forecasting, and better decision-making at every level of the organization.
Definition: Power BI data sources are the configured connections that pull raw information from external systems into Power BI for analysis and reporting. They form the foundation of every report, dashboard, and analytical model built within the platform.
Connections in Power BI can reach across cloud environments, on-premises servers, local files, and enterprise databases, delivering the raw input needed to populate visuals, tables, and dashboards.
When teams integrate multiple Power BI data sources, analysts can merge datasets from separate business units, build a unified Power BI data model, and produce advanced reports that strengthen intelligence across the entire organization.
Power BI provides a broad library of connectors that let organizations pull information from nearly any platform.
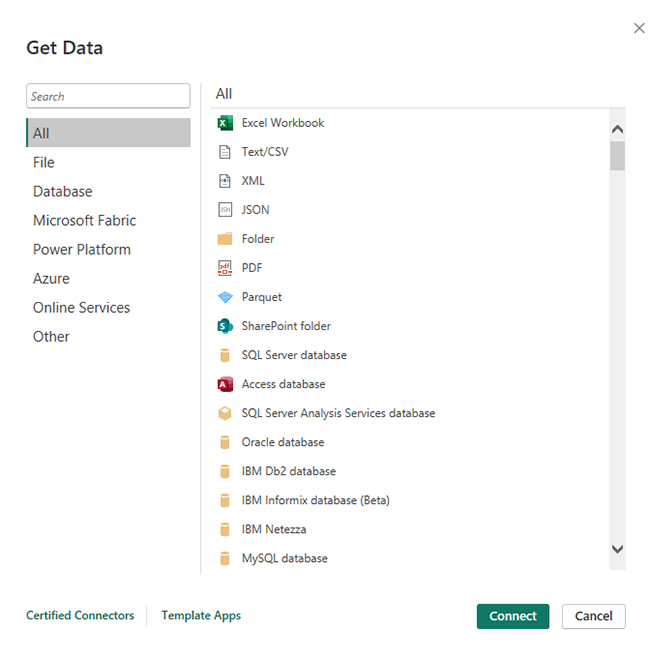
Local file formats such as spreadsheets, CSV, XML, and JSON are supported as connections. Analysts frequently use these as sample data for Power BI when prototyping new reports.
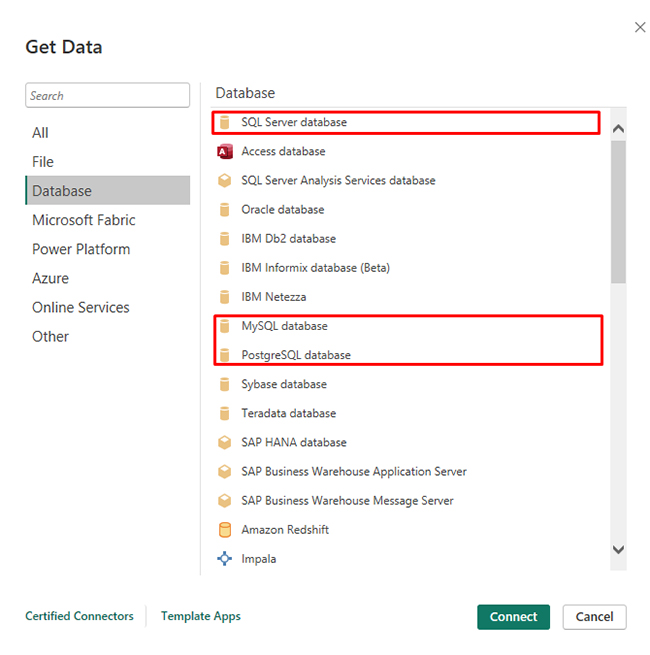
Power BI connects to relational databases, including SQL Server, MySQL, and PostgreSQL, which store the structured enterprise records that drive analytics.
Platforms including Azure, SharePoint, and OneDrive give organizations direct access to data stored in online environments.
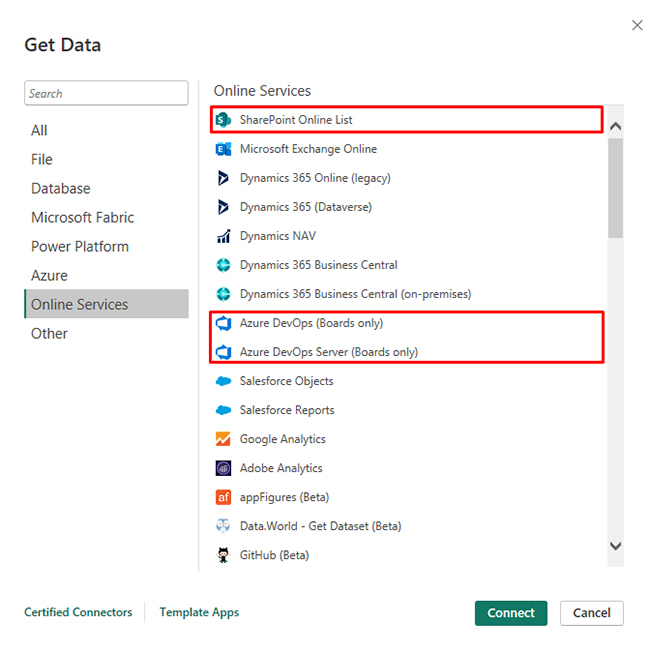
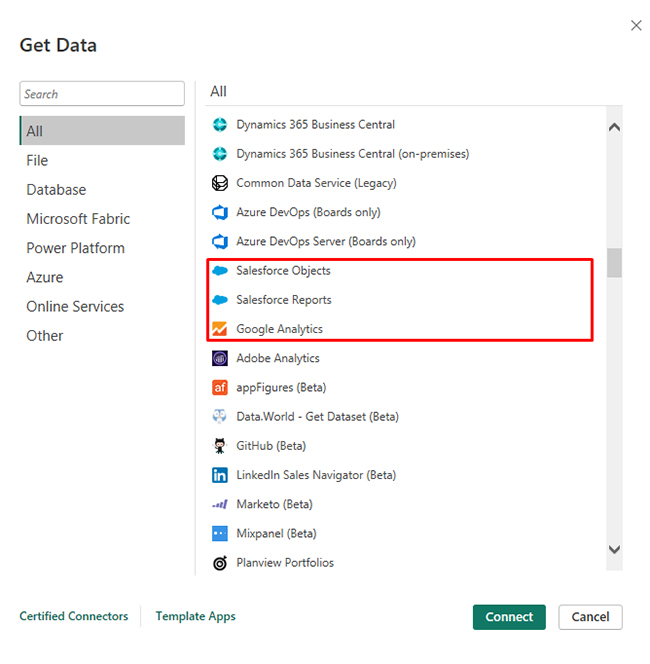
Business applications such as Salesforce and Google Analytics offer native connectors that feed performance metrics straight into Power BI.
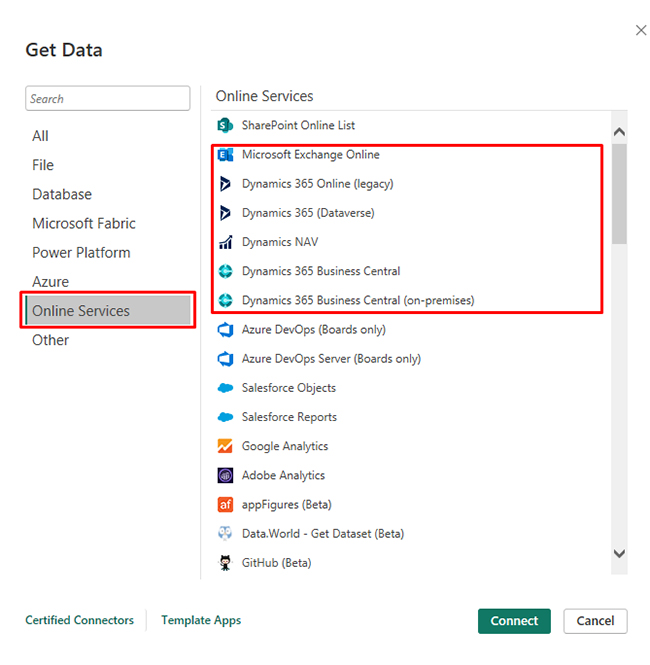
Tools like Dynamics 365 and Microsoft Power Platform integrate seamlessly with Power BI, making it straightforward to analyze workflows and customer operations.
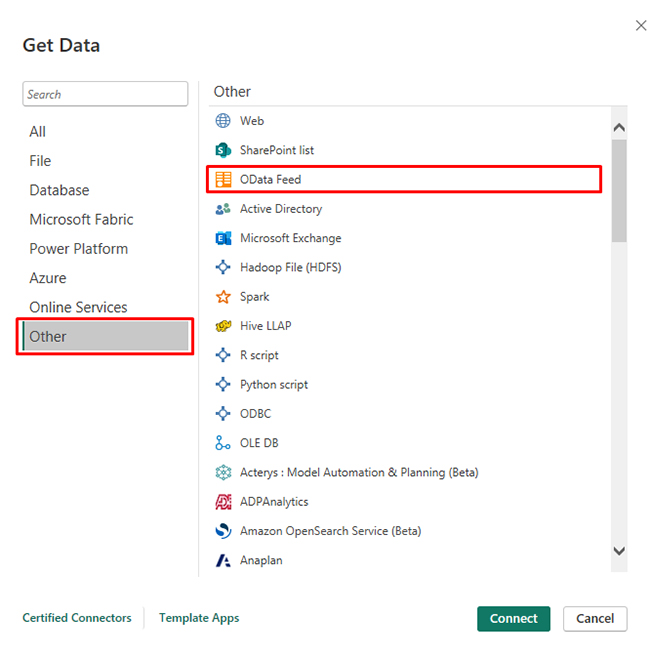
Power BI can pull information from Web APIs, REST endpoints, and OData feeds, extending connectivity to virtually any online system.
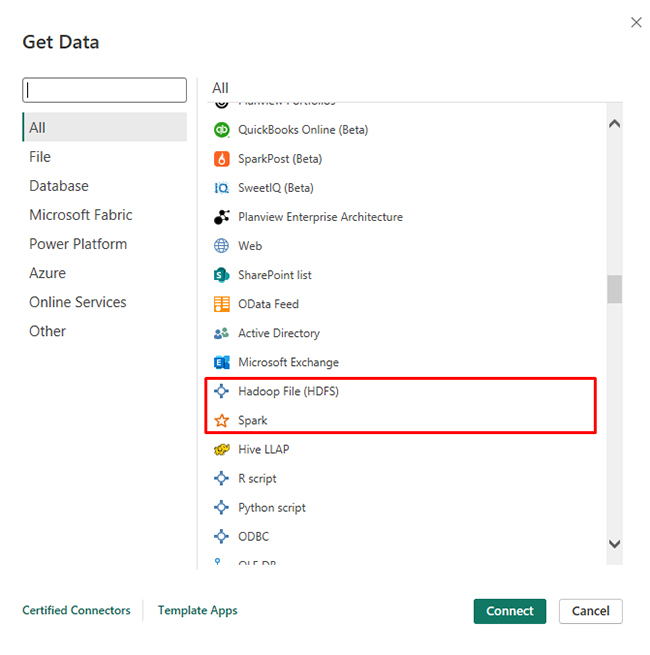
Distributed computing environments such as Hadoop and Apache Spark serve as Power BI data sources when organizations need to process and analyze high-volume datasets.
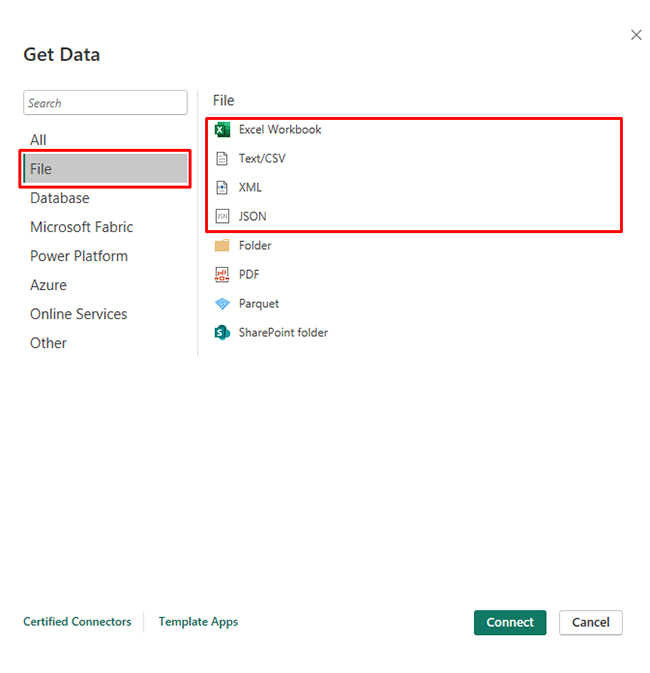
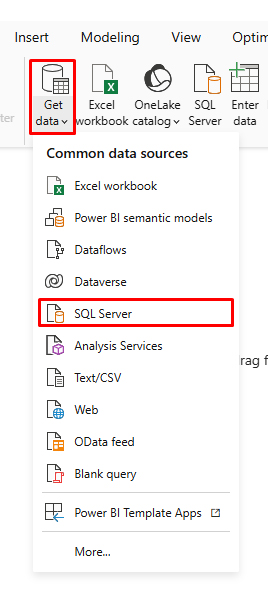
Locating data sources in Power BI Desktop takes just a few clicks. The Get Data button on the Home ribbon opens the full connector library.
The Power BI connectors library organizes options into categories, including files, databases, online services, and cloud platforms. Users can search by name or browse categories to locate any system.
Familiarity with these connectors is particularly valuable for Power BI advanced reporting scenarios. Once selected, Power BI prompts for connection details and credentials before loading the data.
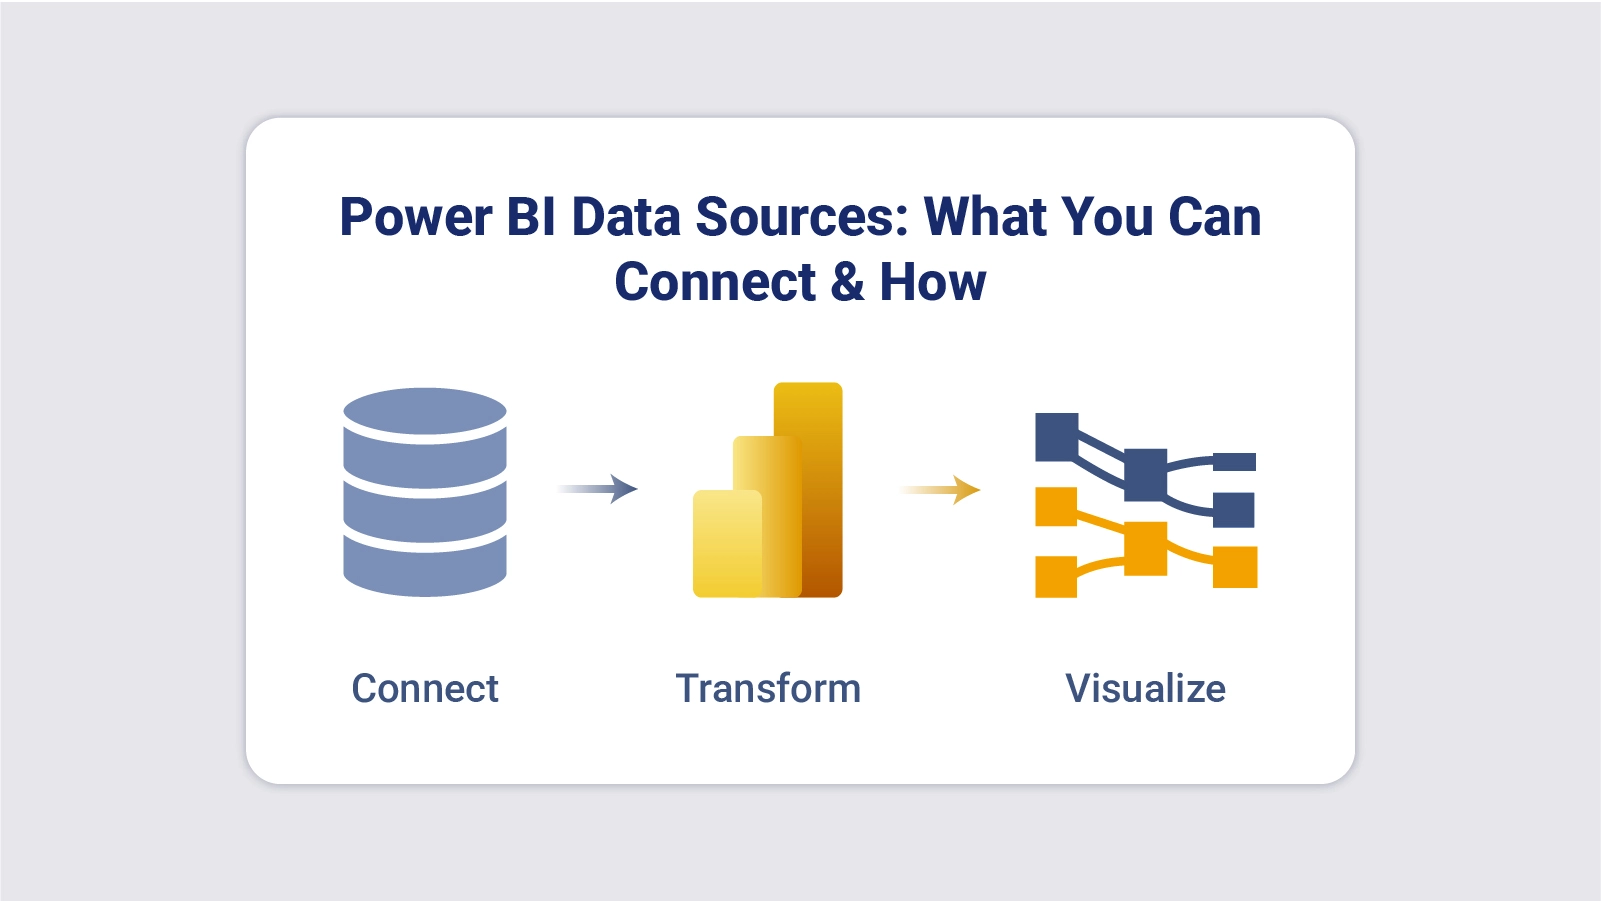
Setting up Power BI data sources follows a repeatable workflow that brings source data into a ready-to-report state.
Open Power BI Desktop and click Get Data. Choose the category that matches your data location, such as file, database, or cloud service.
Provide connection details such as server name, file path, or API endpoint, depending on the selected data source in Power BI.
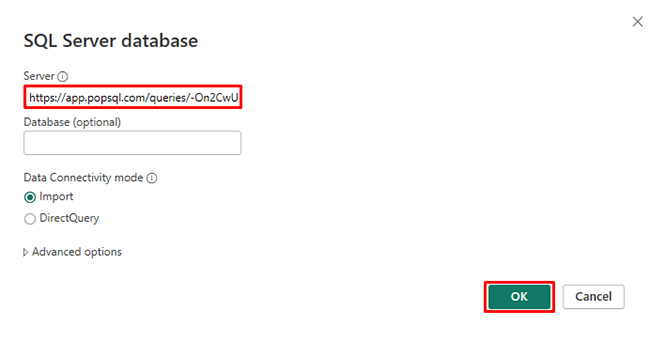
Power BI requests authentication using login credentials, API tokens, or organizational accounts.
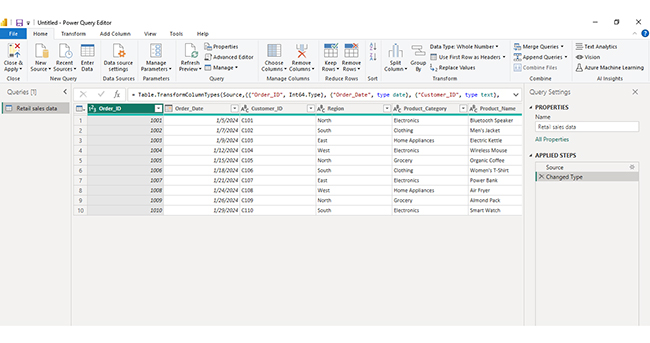
Power Query allows users to clean and structure Power BI source data before loading it into the analytics environment.
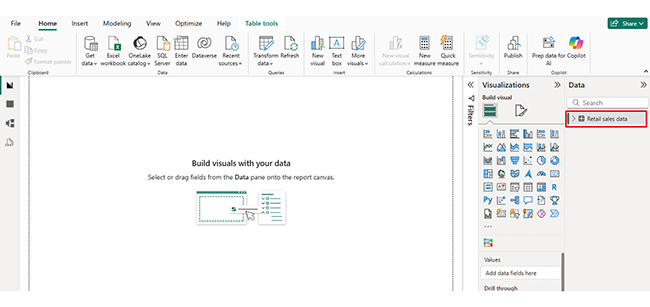
After transformation, the data is loaded and becomes available for building reports and dashboards, including formatted outputs created using the Power BI report builder.
Analyzing a data source in Power BI allows you to transform raw data into meaningful insights by exploring relationships, trends, and performance metrics. Follow these steps to perform effective analysis:
Start by connecting Power BI to your data source, such as Excel, databases, or cloud platforms. Ensure the data is loaded correctly and all relevant tables are included.
Use Power Query to clean your dataset by removing duplicates, handling missing values, and formatting columns properly. A clean dataset ensures accurate analysis and reliable results.
Define relationships between tables in the model view. Proper connections between datasets help Power BI deliver meaningful insights across different data sources.
Use DAX to create key measures such as totals, averages, and performance indicators. These calculations help summarize large datasets and uncover important metrics.
Create charts and dashboards such as bar charts, line charts, and KPI visuals to explore your data. For more advanced and visually appealing dashboards, you can use ChartExpo to simplify complex data visualization.
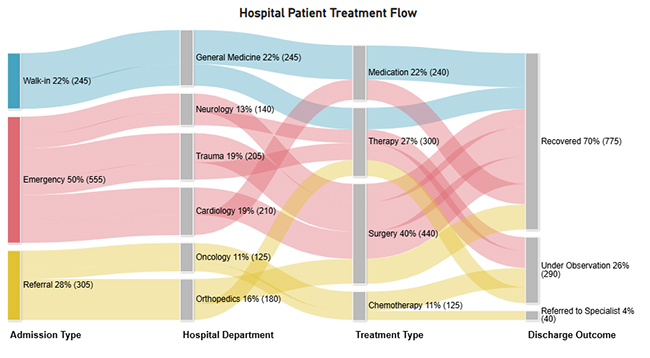
Review your visuals to identify patterns, relationships, and flows between different data points. This helps in understanding how data moves across categories and where key insights lie.
Include a final visualization, such as a Sankey diagram, to show how data flows across stages or categories. For example, the image can show the flow from initial input to different processes and final outcomes, helping stakeholders clearly understand relationships and overall data distribution.
Connecting multiple data sources lets organizations draw on diverse information to build richer, more complete analytical views.
Keeping Power BI data sources well-organized and properly governed protects report accuracy and long-term reliability.
Power BI supports hundreds of connectors, covering files, Power BI data sources from relational databases, cloud services, SaaS platforms, and online APIs.
Proprietary systems that expose no API and offer no data export capability typically cannot connect to Power BI directly.
In Power BI, a source refers to the originating system where records reside, while a dataset is the prepared, transformed version of that data used to build reports.
Power BI data sources are the foundation of every meaningful report and dashboard built in Power BI. Selecting the right connections, from flat files to enterprise databases and cloud platforms, determines how quickly and reliably your organization can access the information it needs to operate and compete effectively.
By maintaining those connections with consistent governance, scheduled refreshes, and well-chosen visualization tools, teams move from raw data to clear, shareable insight with far less manual effort. The result is a reporting environment that scales alongside the organization and supports better, faster decisions at every level of the business.
How much did you enjoy this article?


Learn how to use KPI visuals in Power BI to track performance against targets, understand trends, and make faster, data-driven decisions.
Power BI Calculated Columns transform raw data into structured DAX-driven insights. Learn to create, apply, and optimize them. Read on!
Power BI Dashboards vs Reports: key differences, use cases, and when to use each for monitoring KPIs and analyzing data in depth.