• Home
  • Tools dropdown img
    • Spreadsheet Charts

      • ChartExpo for Google Sheets
      • ChartExpo for Microsoft Excel
    • Power BI Charts

      • Power BI Custom Visuals by ChartExpo
    • Word Cloud

  • Charts dropdown img
    • Chart Category

      • Bar Charts
      • Circle Graphs
      • Column Charts
      • Combo Charts
      • Comparison Charts
      • Line Graphs
      • PPC Charts
      • Sentiment Analysis Charts
      • Survey Charts
    • Chart Type

      • Box and Whisker Plot
      • Clustered Bar Chart
      • Clustered Column Chart
      • Comparison Bar Chart
      • Control Chart
      • CSAT Survey Bar Chart
      • CSAT Survey Chart
      • Dot Plot Chart
      • Double Bar Graph
      • Funnel Chart
      • Gauge Chart
      • Likert Scale Chart
      • Matrix Chart
      • Multi Axis Line Chart
      • Overlapping Bar Chart
      • Pareto Chart
      • Radar Chart
      • Radial Bar Chart
      • Sankey Diagram
      • Scatter Plot Chart
      • Slope Chart
      • Sunburst Chart
      • Tornado Chart
      • Waterfall Chart
      • Word Cloud
    • Google Sheets
      Microsoft Excel
  • Services
  • Pricing
  • Contact us
  • Blog
  • Support dropdown img
      • Gallery
      • Videos
      • Contact us
      • FAQs
      • Resources
    • Please feel free to contact us

      atsupport@chartexpo.com

Categories
All Data Visualizations Data Analytics Surveys
Add-ons/
  • Google Sheets
  • Microsoft Excel
  • Power BI
All Data Visualizations Data Analytics Surveys
Add-ons
  • Google Sheets
  • Microsoft Excel
  • Power BI

We use cookies

This website uses cookies to provide better user experience and user's session management.
By continuing visiting this website you consent the use of these cookies.

Ok

ChartExpo Survey


Home > Blog > Surveys

Thurstone Scales: Key Concepts and Practical Insights

Thurstone scales? You’ve probably heard the term, but what are they? These psychological measurement tools have revolutionized how we quantify attitudes and opinions. Developed by Louis Thurstone in the 1920s, Thurstone scales offer a unique approach to assessing subjective experiences.

I’m trying to imagine measuring something as intangible as people’s beliefs. This sounds challenging, right? That’s where Thurstone scales come in handy. They provide a method to convert qualitative data into quantitative scores. This allows researchers to analyze and compare attitudes across different groups or over time.

Thurstone Scales

But how do Thurstone scales work? The process involves a series of statements about a particular topic. Judges rate these statements on a scale, typically from 1 to 11. The final scale includes items representing a range of attitudes, from strongly negative to strongly positive.

Here’s a fascinating fact: Thurstone scales have been used in various fields beyond psychology. They have been used in marketing, education, and even political science. A 2019 study, for example, employed Thurstone scales to gauge public opinion on climate change policies.

One key advantage of Thurstone scales is their ability to reduce bias. By using multiple judges to rate statements, the method minimizes individual prejudices. This results in a more objective measurement tool.

However, creating Thurstone scales can be time-consuming. It requires a careful selection of statements and a thorough analysis of judge ratings. But the payoff is worth it. These scales provide valuable insights into complex human attitudes.

Let’s explore them further.

Table of Contents:

  1. What are Thurstone Scales?
  2. Why Are Thurstone Scales Important?
  3. When to Use the Thurstone Scales Temperament Survey?
  4. What are the Characteristics of a Thurstone Scale Question?
  5. How to Develop a Thurstone Scale for Survey Research?
  6. How to Conduct a Thurstone Attitude Scale Survey?
  7. How Do You Interpret the Results of Thurstone Scales?
  8. How to Analyze Thurstone Scales Results in Excel?
  9. Best Practices for Thurstone Scale of Attitude Measurement
  10. Wrap Up

First…

What are Thurstone Scales?

Definition: Thurstone scales are a psychological measurement tool. They assess attitudes by asking respondents to agree or disagree with various statements.

Each statement has a pre-assigned numerical value reflecting its favorability toward the subject. These values are summed to produce an overall score representing the respondent’s attitude, often used in psychographic segmentation to categorize individuals based on their beliefs or opinions.

Psychologist Louis Thurstone developed the Thurstone scales method in the 1920s. It is used in social science research to quantify subjective opinions or beliefs in a structured way.

Why Are Thurstone Scales Important?

Thurstone scales play a crucial role in psychological research, offering valuable insights into attitudes. Here’s why they are so important:

  • Precision and bias reduction: Thurstone scales provide precise measurements of attitudes using carefully crafted statements. This helps reduce potential bias in responses.
  • Differentiation of responses: They effectively distinguish between varying levels of agreement or disagreement, capturing subtle differences in respondents’ attitudes.
  • Versatility across contexts: These scales are adaptable and can be applied in various research contexts. Thus, they are flexible tools for different studies.
  • Foundation for advanced techniques: Thurstone scales have laid the groundwork for the development of more complex scaling methods, influencing modern psychological measurement tools.

When to Use the Thurstone Scales Temperament Survey?

Thurstone scales are ideal for situations where understanding nuanced attitudes is key. Here’s when to use them:

  • Measuring complex attitudes with precision: Use Thurstone scales when you need to capture and measure complex attitudes with high accuracy.
  • Handling non-binary responses: They’re perfect for surveys requiring more than simple yes/no answers, allowing for a range of responses.
  • Applicable in various fields: Ideal for psychology, social sciences, and market research, Thurstone scales are versatile tools for in-depth analysis.

What are the Characteristics of a Thurstone Scale Question?

Thurstone scales are known for their unique structure and measurement approach. Here are the key characteristics of a Thurstone scale question:

  1. Calculation of mean or median: After responses are collected, the mean or median of the assigned values is calculated to determine the overall attitude score.
  2. Two-step process: The scale is created in two steps: first, experts assign values to statements. Then, respondents agree or disagree with each statement.
  3. Agree or disagree options: Respondents typically choose between simple agree or disagree options, making the scale straightforward yet effective in capturing attitudes.

How to Develop a Thurstone Scale for Survey Research?

Creating a Thurstone scale for survey research may seem daunting at first, but it’s easy. Let’s walk through the steps together to make it a manageable and even exciting process!

  1. Define the construct: Clearly define what you want to measure. This could be attitudes, opinions, or perceptions on a specific topic.
  2. Generate statements: Create a range of statements related to your construct. Make sure they cover the full spectrum, from very positive to very negative.
  3. Judge ratings: Ask a group of judges to rate each statement. They should indicate how favorable or unfavorable each statement is on a scale (e.g., 1 to 11).
  4. Calculate median values: Calculate the median score for each statement. This shows where each statement falls in terms of favorability.
  5. Select statements: Pick questions that represent the full range of median scores. This ensures your scale covers all possible attitudes.
  6. Test and validate:
    • Test the scale with a small group.
    • Make sure it’s clear and reliable.
    • Adjust any confusing statements.
  1. Administer survey: Once validated, use the scale in your survey. Respondents will rate their agreement with each statement, helping you measure their attitudes.

How to Conduct a Thurstone Attitude Scale Survey?

Conducting a Thurstone attitude scale survey is a structured and systematic process. It allows you to measure people’s attitudes with precision. Let’s break it down into simple steps.

  1. Develop the Scale:

    • Define the attitude: Clearly define what attitude you want to measure. This could be attitudes towards a product, a policy, or a social issue.
    • Create statements: Write a series of statements that reflect different opinions about the attitude. These should range from very positive to very negative.
    • Judge ratings: Ask a group of judges to rate each statement. They’ll score each one on how favorable or unfavorable it is.
    • Select statements: Choose the statements that cover the full range of opinions. Ensure you have a balanced set representing all attitudes.
  1. Administer the Survey:

    • Participant selection: Identify and select your target group. Ensure they represent the population you’re studying.
    • Survey distribution: Distribute the survey to participants. Make sure they understand how to rate each statement.
    • Score calculation: Collect the surveys. Calculate each participant’s score based on their responses.
  1. Analyze Data:

    • Analyze the scores to identify trends and patterns. This will show you the overall attitude of your group.
  2. Report Findings:

    • Summarize your findings in a report. Highlight key insights and trends from the data.

How Do You Interpret the Results of Thurstone Scales?

Interpreting Thurstone scale results helps you understand the attitudes or opinions of your respondents. It’s a straightforward process. Let’s walk through it step by step.

  1. Calculate the mean score: Find the average score of all respondents to gauge the overall attitude.
  2. Analyze the distribution: Look at how the scores are spread out to identify trends or clusters in attitudes.
  3. Compare with scale benchmarks: Compare the mean score against predefined benchmarks to see where the group’s attitude falls.
  4. Consider item weights: Account for the importance of each statement by considering its weight in the final interpretation.

How to Analyze Thurstone Scales Results in Excel?

Data analysis is the bane of every researcher’s existence; Numbers are everywhere, and brain cells are crying for mercy.

Enter Thurstone scales, adding another layer of complexity.

But wait! There’s hope – data visualization. It transforms mind-numbing figures into eye-catching graphics.

What about Excel charts? They are basic. Its visuals? Meh.

But don’t worry, we have ChartExpo. It’s the Robin to Excel’s Batman, only better. It conquers Excel’s limitations and turns Thurstone-scale results into visual masterpieces.

Say goodbye to data headaches. Say hello to insights that pop!

Let’s learn how to install ChartExpo in Excel.

  1. Open your Excel application.
  2. Open the worksheet and click the “Insert” menu.
  3. You’ll see the “My Apps” option.
  4. In the Office Add-ins window, click “Store” and search for ChartExpo on my Apps Store.
  5. Click the “Add” button to install ChartExpo in your Excel.

ChartExpo charts are available both in Google Sheets and Microsoft Excel. Please use the following CTAs to install the tool of your choice and create beautiful visualizations with a few clicks in your favorite tool.

Thurstone Scale Example

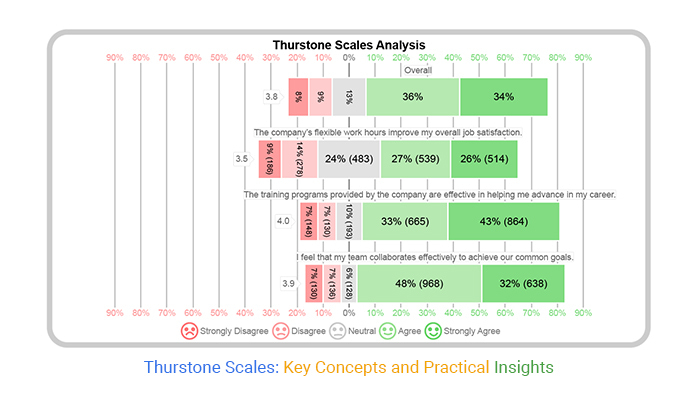
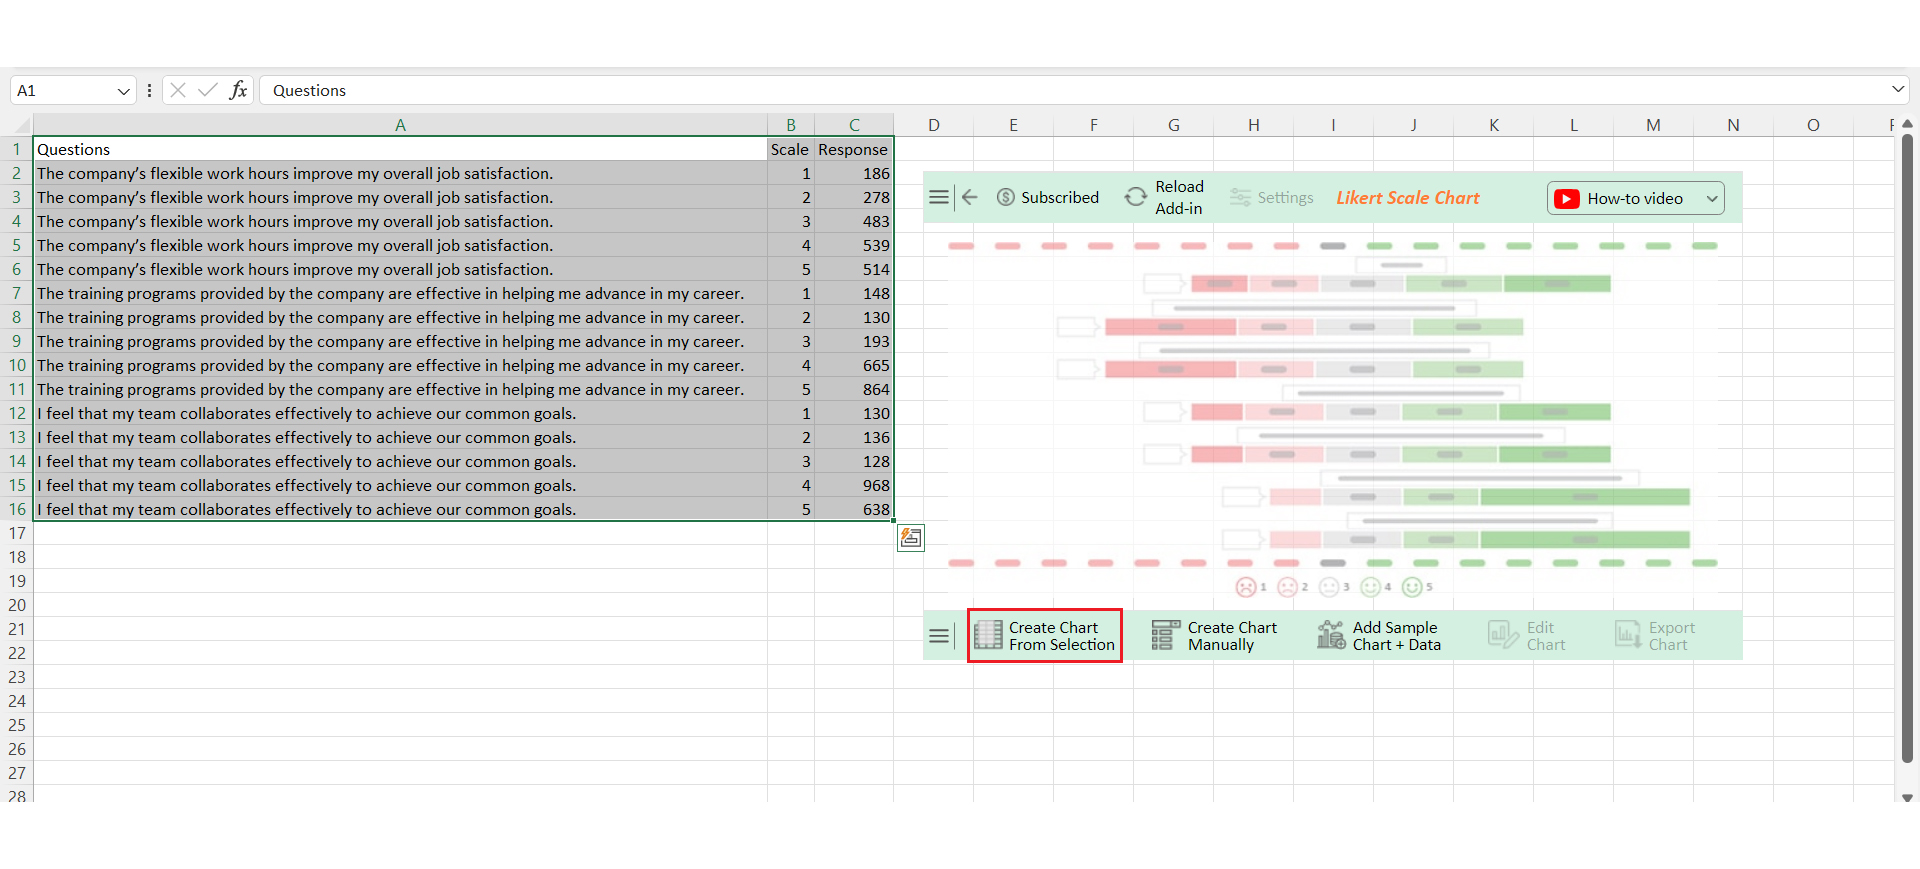
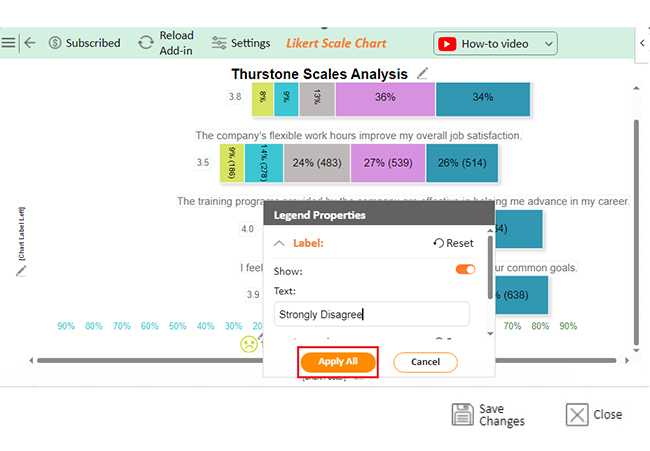
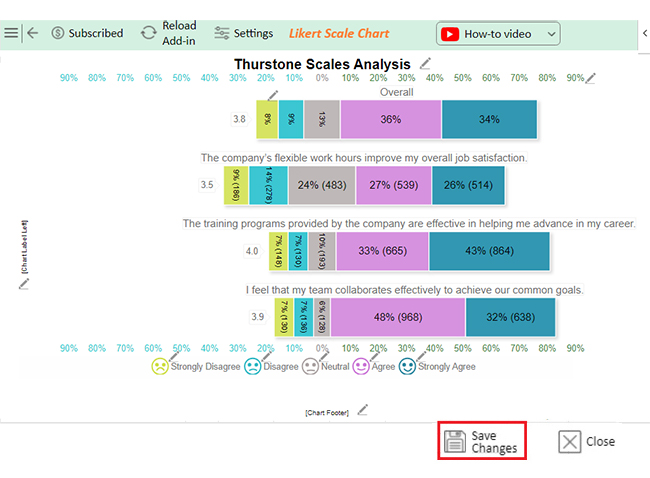
Let’s analyze the Thurstone scale data below using ChartExpo.

Questions Scale Response
The company’s flexible work hours improve my overall job satisfaction. 1 186
The company’s flexible work hours improve my overall job satisfaction. 2 278
The company’s flexible work hours improve my overall job satisfaction. 3 483
The company’s flexible work hours improve my overall job satisfaction. 4 539
The company’s flexible work hours improve my overall job satisfaction. 5 514
The training programs provided by the company are effective in helping me advance in my career. 1 148
The training programs provided by the company are effective in helping me advance in my career. 2 130
The training programs provided by the company are effective in helping me advance in my career. 3 193
The training programs provided by the company are effective in helping me advance in my career. 4 665
The training programs provided by the company are effective in helping me advance in my career. 5 864
I feel that my team collaborates effectively to achieve our common goals. 1 130
I feel that my team collaborates effectively to achieve our common goals. 2 136
I feel that my team collaborates effectively to achieve our common goals. 3 128
I feel that my team collaborates effectively to achieve our common goals. 4 968
I feel that my team collaborates effectively to achieve our common goals. 5 638
  • To get started with ChartExpo, install ChartExpo in Excel.
  • Now Click on My Apps from the INSERT menu.
insert chartexpo in excel
  • Choose ChartExpo from My Apps, then click Insert.
open chartexpo in excel
  • Once it loads, choose the “Likert Scale Chart” from the charts list.
search likert scale chart in excel
  • Click the “Create Chart From Selection” button after selecting the data from the sheet, as shown.
Click Create Chart From Selection for Making Visualization Thurstone Scales
  • ChartExpo will generate the visualization below for you.
Initial Visual for Making Visualization Thurstone Scales
  • If you want to have the chart’s title, click Edit Chart, as shown in the above image.
  • Click the pencil icon next to the Chart Header to change the title.
  • It will open the properties dialog. Under the Text section, you can add a heading in Line 1 and enable Show.
  • Give the appropriate title of your chart and click the Apply button.
Add Chart Header for Making Visualization Thurstone Scales
  • You can change the colors of Axis values as follows:
Change Colors of Axis for Making Visualization Thurstone Scales
  • You can change the colors of Bars as follows:
Change Colors of Bars for Making Visualization Thurstone Scales
  • You can disable the Grid lines as follows:
Disable Gird Lines for Making Visualization Thurstone Scales
  • You can change the font size of Questions as follows:
Change Font Size of Questions for Making Visualization Thurstone Scales
  • You can change the legend Scale into Descriptive form by clicking on a Small pencil icon like 1=Strongly Disagree, 2=Disagree, 3= Neutral, 4=Agree, 5=Strongly Agree
Change Legend Scale Into Descriptive Form for Making Visualization Thurstone Scales
  • Click the “Save Changes” button to persist the changes.
Click Save Changes for Making Visualization Thurstone Scales
  • Your final chart will appear below.
Final Visualization Thurstone Scales

Insights

  • Most respondents believe flexible work hours and training boost job satisfaction and career growth.
  • Team collaboration receives high ratings, especially among those with higher satisfaction levels.

Best Practices for Thurstone Scale of Attitude Measurement

Using Thurstone scales effectively requires careful planning and execution. Here are some best practices to ensure accurate attitude measurement:

  1. Define clear objectives: Clearly outline what you want to measure and ensure the scale aligns with your research goals.
  2. Develop reliable statements: Create well-crafted statements that accurately reflect different attitudes, covering the full spectrum of opinions.
  3. Assign appropriate weights: Carefully assign weights to each statement, reflecting their intensity and relevance to the attitude measured.
  4. Pre-test the scale: Before full deployment, pre-test the scale with a sample group to identify any issues and make necessary adjustments.
  5. Ensure validity: Regularly assess the scale’s validity to confirm it measures what it’s intended to, ensuring the results are trustworthy.
  6. Analyze and interpret carefully: After collecting responses, analyze the data and interpret results in the context of your objectives.
  7. Revise and update: Continuously review and update the scale to keep it relevant and accurate for future studies.

FAQs

How is data collected using Thurstone scales?

Data is collected by asking respondents to agree or disagree with a set of statements. Each statement reflects different attitudes. Respondents’ answers are then scored based on predetermined values. These scores are analyzed to assess overall attitudes.

Can Thurstone scales be used in Likert scale charts?

No, Thurstone scales and Likert scales are different methods. Thurstone scales focus on measuring attitudes with weighted statements. Likert scales measure agreement on a scale, like 1 to 5. While both assess attitudes, they are not directly interchangeable in charts.

What are some common applications of Thurstone scales?

Thurstone scales measures are used for:

  • Attitude measurement
  • Social issue surveys
  • Customer satisfaction studies
  • Employee attitude assessments
  • Psychological testing
  • Market research
  • Educational assessments

Wrap Up

Thurstone scales are powerful tools for measuring attitudes, developed by psychologist Louis Thurstone in the 1920s. These scales are unique because they allow for a more nuanced understanding of people’s opinions.

The Thurstone scales method involves carefully crafted statements. Experts assign each statement a numerical value. Respondents then agree or disagree with these statements. The numerical values are summed to produce an overall attitude score, which represents the respondent’s position on the issue studied.

One of Thurstone scales’ key strengths is its precision. It reduces bias by using statements that reflect various levels of favorability, ensuring the results are accurate and reliable.

Thurstone scales are versatile. They can be used in different fields, such as psychology, social sciences, and market research. Their ability to capture subtle differences in attitudes makes them ideal for complex studies.

However, creating a Thurstone scale requires careful planning. It involves generating and selecting statements, assigning appropriate weights, and validating the scale. This process ensures the scale is effective in measuring the intended attitudes.

In conclusion, Thurstone scales remain a valuable tool in survey research. Their structured approach and ability to measure complex attitudes with precision make them indispensable in understanding human opinions.

Do not hesitate.

Start using Thurstone scales today with ChartExpo to make sense of diverse viewpoints.

How much did you enjoy this article?

PBIAd1
Start Free Trial!
140556

Related articles

next previous
Surveys13 min read

5 Point Likert Scale Analysis, Interpretation & Examples

Dive deep into the realm of 5-point Likert Scale Analysis and Interpretation to unravel the sentiments behind your responses. Gain actionable insights today.

Surveys11 min read

3-Point Likert Scale: Range Interpretation & Analysis

Learn the basics of the 3-point Likert scale, including examples, benefits, and when it's best applied in research and feedback forms.

Surveys16 min read

Survey Data Collection: Definition, Methods and Analysis

Find the best methods of Survey data collection. Elevate your research game with practical tips for gathering, analyzing, and leveraging valuable information.

Surveys11 min read

5-Point Performance Rating Scale With Examples: Quick Guide

Discover how the 5-Point Performance Rating Scale helps organizations evaluate employee performance with clarity, consistency, and fairness across teams.

Surveys11 min read

How to Interpret 4-Point Likert Scale Results?

Click to learn How to Create, Gather and Analyze Data Using the 4-Point Likert Scale? A complete guide with definition, examples, uses, and applications.

ChartExpo logo

Turn Data into Visual
Stories

CHARTEXPO

  • Home
  • Gallery
  • Videos
  • Services
  • Pricing
  • Contact us
  • FAQs
  • Privacy policy
  • Terms of Service
  • Sitemap

TOOLS

  • ChartExpo for Google Sheets
  • ChartExpo for Microsoft Excel
  • Power BI Custom Visuals by ChartExpo
  • Word Cloud

CATEGORIES

  • Bar Charts
  • Circle Graphs
  • Column Charts
  • Combo Charts
  • Comparison Charts
  • Line Graphs
  • PPC Charts
  • Sentiment Analysis Charts
  • Survey Charts

TOP CHARTS

  • Sankey Diagram
  • Likert Scale Chart
  • Comparison Bar Chart
  • Pareto Chart
  • Funnel Chart
  • Gauge Chart
  • Radar Chart
  • Radial Bar Chart
  • Sunburst Chart
  • see more
  • Scatter Plot Chart
  • CSAT Survey Bar Chart
  • CSAT Survey Chart
  • Dot Plot Chart
  • Double Bar Graph
  • Matrix Chart
  • Multi Axis Line Chart
  • Overlapping Bar Chart
  • Control Chart
  • Slope Chart
  • Clustered Bar Chart
  • Clustered Column Chart
  • Box and Whisker Plot
  • Tornado Chart
  • Waterfall Chart
  • Word Cloud
  • see less

RESOURCES

  • Blog
  • Resources
  • YouTube
SIGN UP FOR UPDATES

We wouldn't dream of spamming you or selling your info.

© 2025 ChartExpo, all rights reserved.