• Home
  • Tools dropdown img
    • Spreadsheet Charts

      • ChartExpo for Google Sheets
      • ChartExpo for Microsoft Excel
    • Power BI Charts

      • Power BI Custom Visuals by ChartExpo
    • Word Cloud

  • Charts dropdown img
    • Chart Category

      • Bar Charts
      • Circle Graphs
      • Column Charts
      • Combo Charts
      • Comparison Charts
      • Line Graphs
      • PPC Charts
      • Sentiment Analysis Charts
      • Survey Charts
    • Chart Type

      • Box and Whisker Plot
      • Clustered Bar Chart
      • Clustered Column Chart
      • Comparison Bar Chart
      • Control Chart
      • CSAT Survey Bar Chart
      • CSAT Survey Chart
      • Dot Plot Chart
      • Double Bar Graph
      • Funnel Chart
      • Gauge Chart
      • Likert Scale Chart
      • Matrix Chart
      • Multi Axis Line Chart
      • Overlapping Bar Chart
      • Pareto Chart
      • Radar Chart
      • Radial Bar Chart
      • Sankey Diagram
      • Scatter Plot Chart
      • Slope Chart
      • Sunburst Chart
      • Tornado Chart
      • Waterfall Chart
      • Word Cloud
    • Google Sheets
      Microsoft Excel
  • Services
  • Pricing
  • Contact us
  • Blog
  • Support dropdown img
      • Gallery
      • Videos
      • Contact us
      • FAQs
      • Resources
    • Please feel free to contact us

      atsupport@chartexpo.com

Categories
All Data Visualizations Data Analytics Surveys
Add-ons/
  • Google Sheets
  • Microsoft Excel
  • Power BI
All Data Visualizations Data Analytics Surveys
Add-ons
  • Google Sheets
  • Microsoft Excel
  • Power BI

We use cookies

This website uses cookies to provide better user experience and user's session management.
By continuing visiting this website you consent the use of these cookies.

Ok

ChartExpo Survey


Home > Blog > Microsoft Excel

How to Create Sales Forecast (Examples & Templates)?

Predicting the future in the fast-paced business environment is like trying to hit a bullseye in the dark. A good sales forecast example is the flashlight that helps companies navigate uncertainties. Without it, you’re essentially gambling with your profits.

sales forecast example

Statistics reveal that globally, companies lose an estimated $1 trillion every year due to poor sales forecasting. That’s a staggering figure, right? It’s like leaving money on the table and then watching it disappear into thin air.

But fear not because here’s where the sales forecast example comes into play again. It provides a roadmap, guiding businesses through market trends, customer behaviors, and economic shifts. Without this compass, companies are left wandering in a maze with no exit in sight.

It’s not exactly a winning strategy, right?

A sales forecast example with accurate predictions can lead to a 10% increase in annual revenue.

Yes, you read that right a mere prediction can significantly impact your bottom line.

So, join us as we unravel the intricacies of sales forecasting. We’ll uncover how this seemingly mundane task is key to unlocking your business’s full potential.

Table of Contents:

  1. What is a Sales Forecast?
  2. Why is Sales Forecasting Important?
  3. Factors That Can Impact a Sales Forecast
  4. Sales Forecasting Methods
  5. How to Calculate a Sales Forecast?
  6. Formula For Sales Forecast 
  7. Sales Forecast Templates
    1. Simple Sales Forecast Template
    2. Monthly Sales Forecast Template
    3. Annual Sales Forecast Template
  8. How To Create a Sales Forecast: Step-By-Step
  9. Sales Forecasting Tools
  10. How to Create a Sales Forecast Report?
  11. Sales Forecast Practical Example
  12. Common Sales Forecasting Challenges
  13. Sales Forecasting Best Practices
  14. FAQs About Sales Forecast
  15. Wrap Up

Let’s get started.

What is a Sales Forecast?

Definition: A sales forecast is a predictive analysis of future sales performance for a specific period. It involves estimating the quantity of products/services a business expects to sell, often expressed in monetary terms. This projection is crucial for strategic planning, budgeting, and resource allocation.

Sales forecast examples meticulously analyze market trends, historical data, and external influences. They serve as invaluable tools for businesses, aiding in the anticipation of demand, goal setting, and informed decision-making regarding inventory, staffing, and marketing strategies.

Furthermore, precise sales forecast examples play a pivotal role in optimizing operations and financial modeling, empowering organizations to proactively adapt to market fluctuations and enhance overall performance.

Why is Sales Forecasting Important?

Sales forecast examples transcend mere financial exercises; they are strategic imperatives woven into every aspect of organizational function. From strategic planning to customer satisfaction, the significance of sales forecast examples reverberates throughout various facets of organizational dynamics:

  • Strategic planning: Sales forecast examples lay the groundwork for strategic planning by offering insights into future revenue streams. They empower organizations to align their long-term objectives with anticipated market trends, fostering a proactive and well-informed approach.
  • Resource allocation: Accurate sales forecast examples empower businesses to allocate resources efficiently. By anticipating demand, organizations can optimize inventory, staffing, and other resources, mitigating shortages and excesses that could hinder operational efficiency.
  • Budgeting: Integral to the budgeting process, sales forecast examples provide the necessary data for crafting realistic and achievable financial plans. This alignment ensures that budgets accurately reflect expected revenues, fostering financial stability and responsible fiscal management.
  • Decision-making: Informed decision-making is a byproduct of accurate sales forecast examples. By leveraging tools like Tornado charts, business leaders can make strategic choices regarding product development, marketing campaigns, and market expansion based on a comprehensive understanding of the anticipated sales trends.
  • Risk management: Sales forecasts help to identify potential challenges and uncertainties. From this, you can develop proactive risk management strategies to navigate market fluctuations and unforeseen circumstances more effectively.
  • Performance evaluation: Sales forecasts are a yardstick for evaluating performance against targets. Regularly comparing actual sales with projected figures provides insights into the effectiveness of strategies. This, as a result, helps organizations adapt and improve over time.
  • Investor confidence: Investors seek assurance and predictability. Accurate sales forecasting demonstrates a clear understanding of market dynamics and the ability to achieve projected financial goals. This instills confidence in stakeholders, fostering trust and investment.
  • Market understanding: Sales forecasts deepen your understanding of market dynamics. Analyzing trends and patterns allows you to adapt to evolving customer preferences, emerging competitors, and changing industry landscapes. Ultimately, this ensures relevance and competitiveness.
  • Sales team motivation: Transparent communication of sales forecasts can motivate sales teams. Clear targets and expectations create a sense of purpose and urgency. This drives performance and fosters a results-oriented culture within the sales force.
  • Customer satisfaction: Anticipating demand through sales forecasting ensures businesses can promptly meet customer expectations. This prevents stockouts, enhances customer satisfaction, and helps build lasting relationships, contributing to brand loyalty and positive customer experiences.

Factors That Can Impact a Sales Forecast

1. Market Trends

Shifts in market demand, consumer preferences, and industry trends can significantly influence sales. Staying updated on these trends is essential for accurate forecasting.

2. Economic Conditions

Economic factors, such as inflation rates, unemployment levels, and overall economic growth, can affect consumer spending and purchasing behavior, impacting sales forecasts.

3. Seasonality

Certain products or services may experience fluctuations in demand based on seasonal trends, holidays, or events. Understanding these patterns is crucial for precise forecasting.

4. Competition

Actions taken by competitors, including new product launches, pricing changes, or marketing campaigns, can affect market share and alter sales projections.

5. Internal Factors

Changes within the company, such as product availability, marketing strategies, sales team performance, or operational efficiencies, can impact the accuracy of sales forecasts.

6. Technological Advancements

Emerging technologies or innovations can disrupt markets, change consumer behavior, and influence the demand for certain products or services.

Sales Forecasting Methods

Sales forecast examples entail the prediction of future sales by analyzing historical data, market insights, and qualitative assessments. A holistic approach to sales forecasting encompasses diverse methods, with each offering unique perspectives to augment accuracy:

  1. Historical sales data: Utilizing historical sales data forms the foundation of sales forecasting. Analyzing past sales trends, patterns, and seasonality provides valuable insights into how products or services perform over time.
  2. Qualitative forecasting: Qualitative forecasting relies on expert judgment and subjective inputs. This method is handy when dealing with new products, emerging markets, or limited historical data. Expert opinions, discussions, and surveys contribute to a nuanced understanding.
  3. Time series analysis: Time series analysis involves using historical data to identify trends and patterns. Statistical techniques are applied to analyze the data chronologically, considering seasonality and cyclicality. This method helps in making predictions based on past performance.
  4. Market research: Thorough market research is indispensable for crafting accurate sales forecast examples. Delving into customer behavior, competitor activities, and industry trends offers an external viewpoint crucial for refining sales forecasts. This broader perspective ensures that sales forecast examples effectively incorporate dynamic market dynamics.
  5. Opportunity stage forecasting: A more granular approach involves tracking sales opportunities through different funnel stages. Assigning probabilities to each stage enhances accuracy by predicting the likelihood of deals progressing and closing.
  6. Regression analysis: Regression analysis explores relationships between variables to understand the factors influencing sales. By quantifying these relationships, you can make predictions based on changing variables, enhancing the precision of forecasts. Using tools like a Slope chart, you can visually represent these relationships and trends, making it easier to interpret the data.
  7. Predictive analytics: Advanced analytics and machine learning techniques fall under predictive analytics. This method continuously adapts by analyzing vast datasets, providing dynamic and accurate predictions in evolving business landscapes.
  8. Scenario analysis: Scenario analysis involves considering various hypothetical situations that may impact sales. Preparing for different outcomes helps you make informed decisions based on anticipated challenges and opportunities.
  9. Salesforce feedback: Frontline sales teams can provide real-time insights. Gathering feedback from sales representatives offers valuable information on customer interactions, market trends, and potential obstacles. This enriches the forecasting process with practical, on-the-ground perspectives.
  10. Customer feedback: Direct input from customers through surveys or feedback mechanisms aids in understanding their preferences and predicting future buying behavior. This customer-centric approach ensures that forecasts align with actual market needs.
  11. Delphi method: The Delphi method involves soliciting anonymous opinions from a panel of experts. Through iterative feedback, forecasts are refined, minimizing biases and incorporating diverse expert perspectives.
  12. Leading indicators: Identifying leading indicators, such as website traffic or social media engagement, provides early signals for future sales trends. These indicators serve as proactive measures, offering insights into upcoming market shifts.

How to Calculate a Sales Forecast?

  1. Gather Historical Sales Data
    Collect past sales data over a specific period to establish a baseline.
  2. Analyze Trends
    Identify patterns, seasonal fluctuations, and growth rates in the historical data.
  3. Choose a Forecasting Method
    Select a method, such as straight-line forecasting, moving averages, or weighted forecasting.
  4. Adjust for External Factors
    Consider upcoming changes like marketing campaigns or market conditions that may impact sales.
  5. Create the Forecast
    Calculate expected sales for the upcoming period based on your chosen method and adjustments.
  6. Monitor and Adjust
    Regularly compare actual sales to your forecast and make necessary adjustments based on performance.

Formula For Sales Forecast

A simple formula to calculate a sales forecast can be represented as:

Sales Forecast=Historical Sales+(Historical Sales × Growth Rate)

Where:

  • Historical Sales: The total sales from a previous period (e.g., last year or last quarter).
  • Growth Rate: The expected percentage increase in sales based on historical trends or market analysis (expressed as a decimal).

Sales Forecast Templates

1. Simple Sales Forecast Template

This basic template includes columns for the month/quarter, historical sales figures, expected growth rate, and forecasted sales. It’s ideal for businesses looking for a straightforward and easy-to-use format for quick calculations.

Sales Forcast Example 1

2. Monthly Sales Forecast Template

Designed for detailed monthly projections, this template breaks down sales by product or service, allowing businesses to account for seasonality and specific marketing campaigns. It provides a more granular view of sales trends and helps in identifying peak sales periods.

Sales Forcast Example 2

3. Annual Sales Forecast Template

This comprehensive template summarizes projected sales over a full year, with quarterly breakdowns and overall yearly goals. It’s useful for long-term planning and helps organizations set realistic targets based on previous performance and anticipated market conditions.

Sales Forcast Example 3

How To Create a Sales Forecast: Step-By-Step

Creating a sales forecast involves several key steps to ensure accuracy and reliability. Here’s a concise guide:

1. Gather Historical Data

Collect sales data from previous periods (e.g., monthly or quarterly) to understand past performance. Identify patterns and trends within this data.

2. Identify Trends and Seasonality

Examine historical data to uncover trends (both upward and downward) and seasonal patterns that influence sales. This helps in making informed predictions.

3. Select a Forecasting Method

Choose an appropriate forecasting method based on your data and business needs. Common methods include:

  • Straight-Line Method: Projects future sales based on past averages.
  • Moving Averages: Uses the average of a set number of past periods.
  • Weighted Forecasting: Assigns more weight to recent data.

4. Incorporate External Factors

Consider any external factors that might impact sales, such as economic conditions, market trends, or upcoming promotions. Adjust your forecast accordingly.

5. Create the Forecast

Using your selected method, calculate the expected sales for the upcoming period. This can be done in a spreadsheet for easy calculations.

6. Review and Validate

Share the forecast with team members from sales, marketing, and finance to gather feedback. Their insights can help refine the forecast.

7. Monitor Performance

After implementing the forecast, regularly compare actual sales against your predictions. Adjust future forecasts based on performance and new data.

Sales Forecasting Tools

1. Excel

Microsoft Excel is a widely used tool for sales forecasting due to its flexibility and extensive functionalities. Users can create customized spreadsheets with formulas, charts, and pivot tables to analyze sales data.

2. Google Sheets

Similar to Excel, Google Sheets allows for collaborative forecasting in real-time. Its cloud-based platform enables teams to work together from different locations and easily share insights.

3. ChartExpo

ChartExpo is a powerful visualization tool that integrates seamlessly with Excel and Google Sheets. It provides advanced charting capabilities to present sales data visually, making it easier to identify trends and patterns, which aids in more accurate forecasting.

4. Power BI

Power BI is a business analytics tool by Microsoft that allows users to create interactive reports and dashboards. It can pull data from various sources and provides advanced visualization options to help businesses analyze sales data and forecast future performance effectively.

How to Create a Sales Forecast Report?

Data analysis can feel like navigating a maze with a blindfold, hoping to stumble upon hidden treasures. But don’t worry: When it comes to sales forecasting, data visualization us through the complex terrain of numbers. It helps us unlock insights and trends crucial for informed decision-making.

Yet, within the confines of Excel, data visualization is akin to painting a masterpiece with shades of gray. While tools like forecasting a Side-By-Side Bar Chart offer some structure, they are functional but lack the vibrancy and clarity needed to understand the story behind the numbers.

This is where ChartExpo steps in, ready to revolutionize how we perceive and analyze sales forecasting.

Let’s learn how to Install ChartExpo in Excel.

  1. Open your Excel application.
  2. Open the worksheet and click the “Insert” menu.
  3. You’ll see the “My Apps” option.
  4. In the Office Add-ins window, click “Store” and search for ChartExpo on my Apps Store.
  5. Click the “Add” button to install ChartExpo in your Excel.

ChartExpo charts are available both in Google Sheets and Microsoft Excel. Please use the following CTA’s to install the tool of your choice and create beautiful visualizations in a few clicks in your favorite tool.

Sales Forecast Practical Example

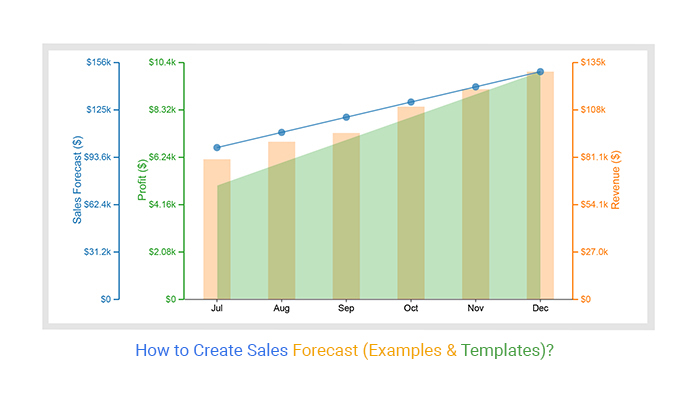
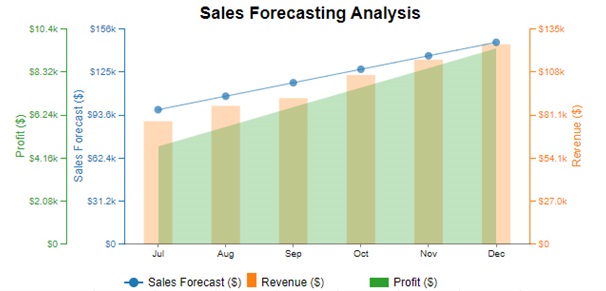
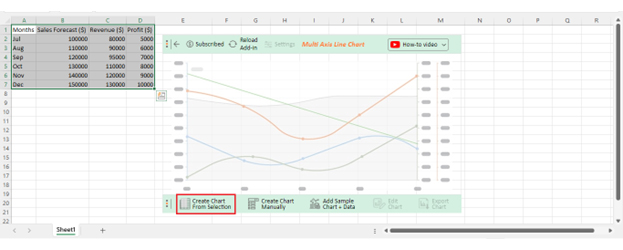
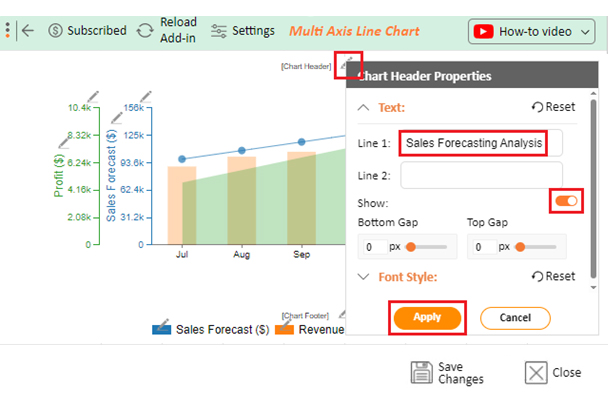
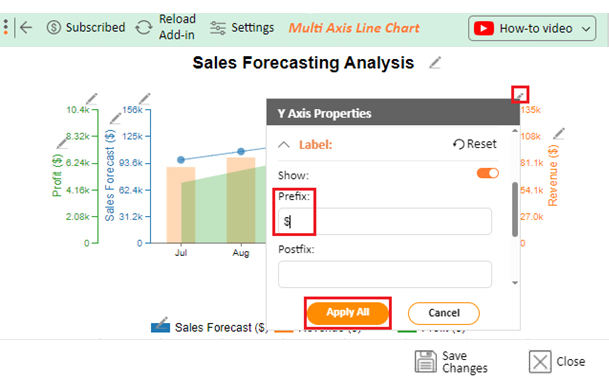
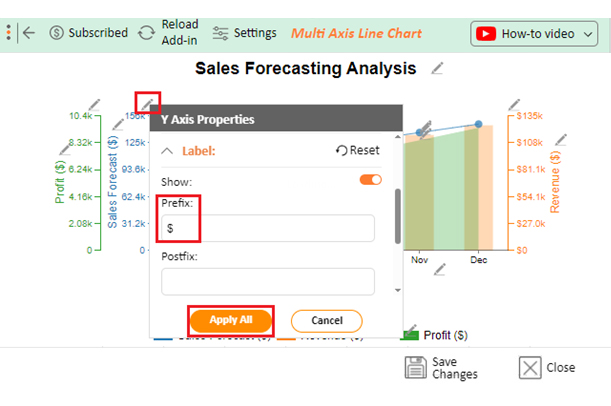
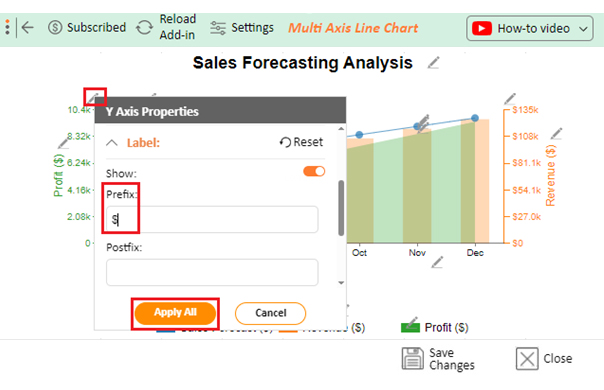
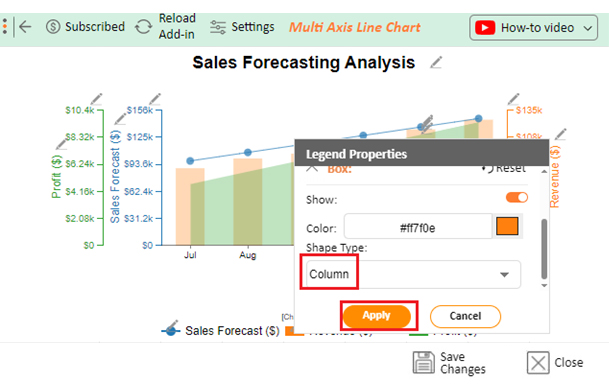
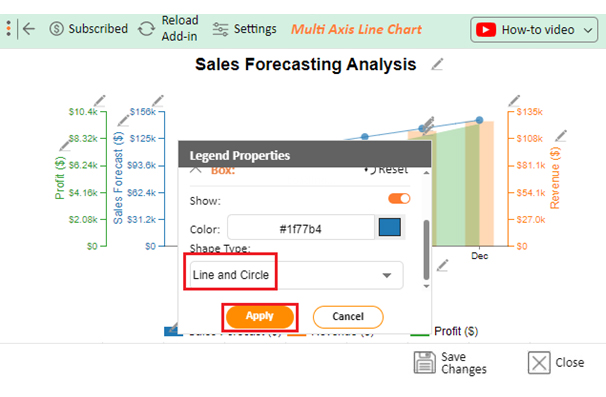
Let’s say you have the sales forecast example data below.

Months Sales Forecast ($) Revenue ($) Profit ($)
Jul 100000 80000 5000
Aug 110000 90000 6000
Sep 120000 95000 7000
Oct 130000 110000 8000
Nov 140000 120000 9000
Dec 150000 130000 10000

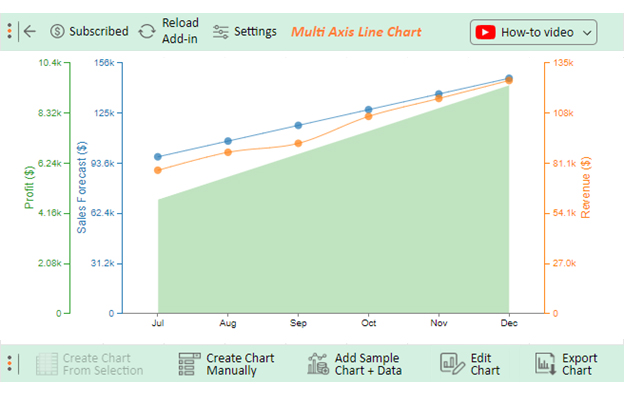
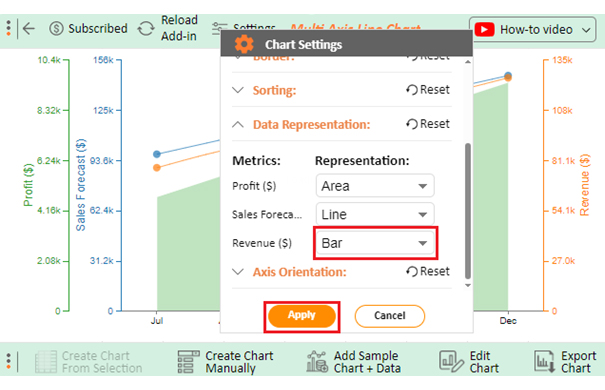
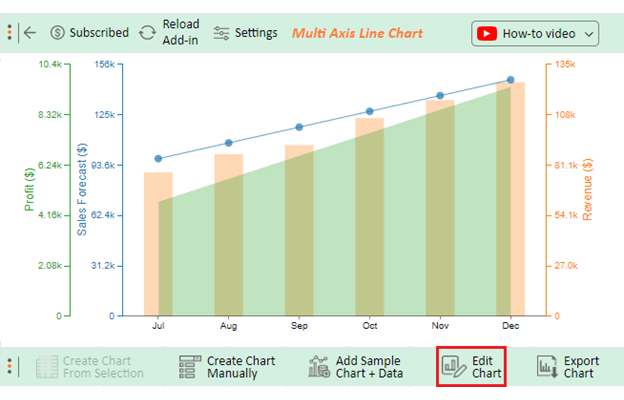
Follow the steps below to learn to use ChartExpo for Excel as a sales forecasting tool.

  • To get started with ChartExpo, install ChartExpo in Excel.
  • Now Click on My Apps from the INSERT menu.
insert chartexpo in excel
  • Choose ChartExpo from My Apps, then click Insert.
open chartexpo in excel
  • Once it loads, scroll through the charts list to locate and choose the “Multi-Axis Line Chart”.
search multi axis line chart in excel
  • Click the “Create Chart From Selection” button after selecting the data from the sheet, as shown.
Create Chart From Selection ce527
  • ChartExpo will generate the visualization below for you.
sales forecast example design template
  • Click on Settings and change the “Data Representation” as follows.
Data Representation ce527
  • If you want to add anything to the chart, click the Edit Chart button:
Edit Chart ce527
  • Click the pencil icon next to the Chart Header to change the title.
  • It will open the properties dialog. Under the Text section, you can add a heading in Line 1 and enable Show.
  • Give the appropriate title of your chart and click the Apply button.
Apply Tittle on Chart ce527
  • Add the dollar sign with “Revenue” as shown below:
Add dollar sign with Revenu ce527
  • Add the dollar sign with “Sales Forecast” as shown below:
Add dollar sign with Sales Forecast ce527
  • Add the dollar sign with “Profit” as follows:
Add dollar sign with Profit ce527
  • Change the Legend shape of “Revenue” to Column and click the “Apply” button.
Change Legend shape of Revenue ce527
  • Change the Legend shape of “Sales Forecast” into a Line and Circle and click the “Apply” button.
Change Legend shape of Sales Forecast ce527
  • Click the “Save Changes” button to persist the changes made to the chart.
Save Changes ce527
  • Your final Multi Axis Line Chart will look like the one below.
Final sales forecast example

Insights

  • From July to December, the sales forecast shows a consistent rise.
  • Revenue mirrors this upward trend each month, indicating the company is likely meeting or surpassing its sales targets.
  • The profit margin remains steady at around 6-7% of revenue. This suggests effective cost management relative to sales throughout the period.

Common Sales Forecasting Challenges

  1. Data Quality Issues: Inaccurate data can lead to unreliable forecasts.
  2. Changing Market Conditions: Economic shifts and consumer behavior can affect sales predictions.
  3. Over-Reliance on Historical Data: Solely using past data may ignore current trends.
  4. Subjectivity in Predictions: Biases can skew forecasts, resulting in unrealistic expectations.
  5. Lack of Collaboration: Poor communication across departments can lead to misaligned forecasts.

Sales Forecasting Best Practices

  1. Use Historical Data: Analyze past sales data to identify trends and patterns for more accurate predictions.
  2. Incorporate Market Research: Stay informed about market trends, consumer behavior, and economic conditions to adjust forecasts accordingly.
  3. Utilize Multiple Forecasting Methods: Combine different forecasting techniques (e.g., qualitative and quantitative methods) for a more comprehensive view.
  4. Collaborate Across Departments: Engage sales, marketing, and finance teams to gather diverse insights and ensure alignment in forecasting efforts.
  5. Regularly Review and Adjust Forecasts: Continuously monitor actual sales against forecasts and make adjustments as needed to improve accuracy.

FAQs About Sales Forecast

How do you calculate sales forecast?

To calculate a sales forecast, analyze historical sales data, consider market trends, and identify influencing factors. Use quantitative methods like time series or regression analysis and qualitative inputs, like expert opinions. Regularly review and adjust the forecast based on evolving market dynamics.

What is a sales forecasting tool?

A sales forecasting tool is a software or system that automates and streamlines the process of predicting future sales. It leverages historical data, statistical models, and sometimes machine learning algorithms to provide accurate and data-driven sales predictions.

What is sales forecasting in CRM?

Sales forecasting in Customer Relationship Management (CRM) refers to predicting future sales performance using CRM data. It involves analyzing customer interactions, sales history, and other CRM insights to project sales. This aids businesses in strategic planning and resource allocation.

Wrap Up

Sales forecasting is more than predicting numbers. It’s a dynamic tool influencing decision-making, resource allocation, and overall organizational success.

Accurate sales forecasts empower businesses to plan for the future strategically, aligning objectives with anticipated market trends. This proactive approach enhances agility, allowing you to navigate the complex landscape of consumer preferences and industry dynamics.

Efficient resource allocation hinges on the insights provided by sales forecasting. Anticipating demand enables you to optimize inventory, personnel, and other resources, preventing shortages and excesses. The result is operational efficiency and cost-effectiveness.

Informed decision-making is a direct outcome of accurate sales forecasts. Armed with comprehensive insights, leaders can make strategic choices regarding product development, marketing, and market expansion. This ability to foresee trends positions businesses ahead of the curve.

Furthermore, sales forecasts provide a metric for evaluating performance against targets. Transparent communication of forecasts motivates sales teams, driving performance and cultivating a results-oriented environment.

For stakeholders, be they, investors or customers, sales forecasts instill confidence. The ability to predict and meet market demands builds trust, attracts investments, and ensures customer satisfaction.

In essence, sales forecasting is not just a numerical exercise. It’s a strategic imperative that guides organizations toward sustained growth and competitiveness. Embrace it today with ChartExpo to shape your company’s financial future.

How much did you enjoy this article?

ExcelAd2
Start Free Trial!
133831

Related articles

next previous
Microsoft Excel8 min read

Excel Task Tracker Template for Smarter Task Insights

Task tracker template in Excel organizes tasks, tracks deadlines, and boosts efficiency. Learn its benefits, and explore expert tips to simplify task management.

Microsoft Excel10 min read

Invoice Tracker Template in Excel for Better Insights

An invoice tracker Excel template helps track invoices, due dates, and payments. Learn how to use this template for better financial management.

Microsoft Excel12 min read

Key Performance Indicators in Healthcare for Better Insights

Key Performance Indicators in healthcare track patient care and efficiency. Learn about these KPIs, top examples, and how to use them to improve outcomes.

Microsoft Excel10 min read

BMI Calculation Formula in Excel for Better Fitness Insights

The BMI calculation formula in Excel helps track and analyze body mass index. Explore step-by-step instructions and tips to simplify BMI tracking in Excel.

Microsoft Excel29 min read

How to Create a Tornado Chart in Excel? A Complete Guide

Click to learn how to plot a Tornado Chart in Excel using easy-to-follow steps. Also, we’ll address the following question: what is a Tornado Diagram?

ChartExpo logo

Turn Data into Visual
Stories

CHARTEXPO

  • Home
  • Gallery
  • Videos
  • Services
  • Pricing
  • Contact us
  • FAQs
  • Privacy policy
  • Terms of Service
  • Sitemap

TOOLS

  • ChartExpo for Google Sheets
  • ChartExpo for Microsoft Excel
  • Power BI Custom Visuals by ChartExpo
  • Word Cloud

CATEGORIES

  • Bar Charts
  • Circle Graphs
  • Column Charts
  • Combo Charts
  • Comparison Charts
  • Line Graphs
  • PPC Charts
  • Sentiment Analysis Charts
  • Survey Charts

TOP CHARTS

  • Sankey Diagram
  • Likert Scale Chart
  • Comparison Bar Chart
  • Pareto Chart
  • Funnel Chart
  • Gauge Chart
  • Radar Chart
  • Radial Bar Chart
  • Sunburst Chart
  • see more
  • Scatter Plot Chart
  • CSAT Survey Bar Chart
  • CSAT Survey Chart
  • Dot Plot Chart
  • Double Bar Graph
  • Matrix Chart
  • Multi Axis Line Chart
  • Overlapping Bar Chart
  • Control Chart
  • Slope Chart
  • Clustered Bar Chart
  • Clustered Column Chart
  • Box and Whisker Plot
  • Tornado Chart
  • Waterfall Chart
  • Word Cloud
  • see less

RESOURCES

  • Blog
  • Resources
  • YouTube
SIGN UP FOR UPDATES

We wouldn't dream of spamming you or selling your info.

© 2025 ChartExpo, all rights reserved.