• Home
  • Tools dropdown img
    • Spreadsheet Charts

      • ChartExpo for Google Sheets
      • ChartExpo for Microsoft Excel
    • Power BI Charts

      • Power BI Custom Visuals by ChartExpo
    • Word Cloud

  • Charts dropdown img
    • Chart Category

      • Bar Charts
      • Circle Graphs
      • Column Charts
      • Combo Charts
      • Comparison Charts
      • Line Graphs
      • PPC Charts
      • Sentiment Analysis Charts
      • Survey Charts
    • Chart Type

      • Box and Whisker Plot
      • Clustered Bar Chart
      • Clustered Column Chart
      • Comparison Bar Chart
      • Control Chart
      • CSAT Survey Bar Chart
      • CSAT Survey Chart
      • Dot Plot Chart
      • Double Bar Graph
      • Funnel Chart
      • Gauge Chart
      • Likert Scale Chart
      • Matrix Chart
      • Multi Axis Line Chart
      • Overlapping Bar Chart
      • Pareto Chart
      • Radar Chart
      • Radial Bar Chart
      • Sankey Diagram
      • Scatter Plot Chart
      • Slope Chart
      • Sunburst Chart
      • Tornado Chart
      • Waterfall Chart
      • Word Cloud
    • Google Sheets
      Microsoft Excel
  • Services
  • Pricing
  • Contact us
  • Blog
  • Support dropdown img
      • Gallery
      • Videos
      • Contact us
      • FAQs
      • Resources
    • Please feel free to contact us

      atsupport@chartexpo.com

Categories
All Data Visualizations Data Analytics Surveys
Add-ons/
  • Google Sheets
  • Microsoft Excel
  • Power BI
All Data Visualizations Data Analytics Surveys
Add-ons
  • Google Sheets
  • Microsoft Excel
  • Power BI

We use cookies

This website uses cookies to provide better user experience and user's session management.
By continuing visiting this website you consent the use of these cookies.

Ok

ChartExpo Survey


Home > Blog > Microsoft Excel

KPIs for Accounting: Effective Performance Insights

So, you want to understand the KPIs for accounting, huh?

Well, you’re in for a ride! The accounting sector is rapidly changing, with new technology driving productivity improvements and complexity. Therefore, the need for well-defined and quantifiable measures has soared. The best KPIs for accounting are similar to signposts guiding you through the financial maze.

KPIs for Accounting

Now, let’s talk numbers. Are you aware that businesses with clearly defined KPIs for accounting are 46% more likely to outperform competitors? Accounting KPIs are more than a sophisticated instrument for people working with numbers. They are crucial factors that can determine a company’s success or failure.

However, not every key performance indicator is of the same importance. Picture having a GPS that guides you through a picturesque route instead of the quickest one. Not exactly what you want, is it? The situation is similar to accounting KPIs. To be successful, they must be selected with care, customized for particular business objectives, and targeted on essential aspects.

Now, this is where things start to get interesting. Effective accounting KPIs go beyond monitoring income and costs. They look into more than just the financial statements, examining the details of activities. Using appropriate KPIs, you can detect patterns, identify opportunities, and drive your business towards increased profits.

So, buckle up! This blog post demystifies KPIs for accounting. Let’s transform your numbers from figures on a spreadsheet to powerful drivers of success.

Table of Contents:

  1. What are KPIs in Accounting?
  2. What Does KPI Stand For in Accounting?
  3. What is the Importance of Accounting KPIs?
  4. What is a List of KPIs in Accounting?
  5. What Makes the Best KPIs for the Accounting Department?
  6. What Type of Key Performance Indicators are used by Accounting Staff?
  7. How to Measure or Track KPI in Accounting?
  8. How to Evaluate KPIs for Accounting?
  9. Wrap Up

First…

What are KPIs in Accounting?

Definition: Key Performance Indicators (KPIs) in accounting are measurable values that demonstrate how effectively a company achieves its financial and operational objectives. They provide a clear and concise way to assess a business’s performance in critical areas. They are essential for evaluating an organization’s financial health and efficiency.

Common accounting KPI examples include:

  • Profit Margin: Indicates the profitability of the company.
  • Return on Investment (ROI): Measures the return on capital investments.
  • Accounts Receivable Turnover: Reflects the efficiency of collecting payments from customers.
  • Inventory Turnover: This shows how effectively inventory is managed.
  • Revenue Growth Rate: Indicates the increase in sales over a specific period.

Tracking these KPIs helps businesses make informed decisions, identify areas for improvement, and monitor progress toward long-term financial goals. KPIs play a vital role in assisting companies to stay competitive and financially sound.

What Does KPI Stand For in Accounting?

Definition: KPI is short for Key Performance Indicator in accounting. KPIs are measurable indicators used to assess the effectiveness of a company or specific endeavor in meeting its goals. The KPIs and metrics can change based on the type of company and its objectives. However, they typically involve indicators like revenue growth, profitability, ROI, customer satisfaction, and efficiency ratios.

KPIs assist companies in monitoring progress and making educated choices to enhance their financial well-being and operational efficiency.

What is the Importance of Accounting KPIs?

Key Performance Indicators (KPIs) for accounting are like the scorecard of a business. They provide insights into its financial health and operational efficiency. Here’s why they matter:

  • Performance measurement: KPIs offer a straightforward way to measure how well a company performs financially and operationally.
  • Decision-making: They provide valuable data for making informed investment decisions, cost management, and overall business strategies.
  • Goal setting and monitoring: KPIs are directly linked to specific business objectives. They help set realistic financial goals and monitor progress toward achieving them.
  • Identifying trends and patterns: KPIs help identify patterns and trends in financial performance, which can be crucial for forecasting and planning.
  • Performance benchmarking: KPIs allow businesses to compare their performance against industry standards and competitors. This benchmarking provides valuable insights into areas where the company excels and where improvements are needed.
  • Accountability and transparency: KPIs for accounting promote accountability and transparency in financial reporting and management. They ensure stakeholders can access accurate financial information, fostering trust and confidence.
  • Resource allocation: KPIs help allocate resources effectively. They guide resources to areas that yield the best returns and identify areas for improvement. Utilizing tools like a Pyramid chart can visually enhance this process by highlighting key performance areas and facilitating better resource distribution.

What is a List of KPIs in Accounting?

Accounting Key Performance Indicators (KPIs) may differ based on the organization’s goals and objectives. Below is a compilation of various accounting KPIs used in different sectors.

Revenue-related KPIs:

  • Revenue Growth Rate
  • Gross Profit Margin
  • Net Profit Margin
  • Average Revenue per Customer/Client
  • Revenue by Product/Service Line
  • Revenue by Geographic Region

Expense-related KPIs:

  • Operating Expense Ratio
  • Cost of Goods Sold (COGS)
  • Selling, General, and Administrative (SG&A) Expenses as a Percentage of Revenue
  • Total Expense Ratio
  • Employee Expense Ratio

Profitability KPIs:

  • Return on Investment (ROI)
  • Return on Assets (ROA)
  • Return on Equity (ROE)
  • Earnings Before Interest and Taxes (EBIT)
  • Earnings Before Interest, Taxes, Depreciation, and Amortization (EBITDA)
  • Gross Margin Return on Investment (GMROI)

Cash Flow KPIs:

  • Operating Cash Flow
  • Free Cash Flow
  • Cash Conversion Cycle
  • Working Capital Ratio
  • Debt to Equity Ratio
  • Debt Service Coverage Ratio

Asset Management KPIs:

  • Inventory Turnover Ratio
  • Accounts Receivable Turnover Ratio
  • Accounts Payable Turnover Ratio
  • Fixed Asset Turnover Ratio
  • Asset Turnover Ratio

Efficiency and Productivity KPIs:

  • Cost per Unit Produced
  • Labor Productivity Ratio
  • Efficiency Ratio
  • Capacity Utilization Rate
  • Order Fulfillment Cycle Time

Risk Management KPIs:

  • Current Ratio
  • Quick Ratio (Acid-Test Ratio)
  • Debt Ratio
  • Interest Coverage Ratio
  • Inventory to Sales Ratio
  • Debt to total assets ratio

Customer-related KPIs (if applicable):

  • Customer Acquisition Cost (CAC)
  • Customer Lifetime Value (CLV)
  • Customer Churn Rate
  • Customer Satisfaction Score (CSAT)
  • Net Promoter Score (NPS)

What Makes the Best KPIs for the Accounting Department?

Several key characteristics must be considered when identifying the best KPIs for an accounting department. Here are the characteristics that make the best KPIs for accounting departments:

  1. Aligned with organizational goals: The best KPIs for accounting departments are aligned with the organization’s broader strategic goals and objectives. This ensures that financial performance supports overall success.
  2. Measurable and quantifiable: Effective KPIs are measurable and quantifiable. They allow precise tracking and performance assessment against set targets and industry standards.
  3. Relevant to accounting functions: The most effective KPIs pertain to the particular accounting tasks. They offer knowledge on topics such as accounts receivable, accounts payable, and internal operations.
  4. Actionable: Key performance indicators (KPIs) should offer insights that can be acted upon. They help accounting managers make informed choices and implement changes to enhance performance.
  5. Timely: Timeliness is essential for KPIs. It ensures real-time or periodic information is accessible to aid in proactive management and decision-making.
  6. Benchmarked: The Best Key Performance Indicators are measured against industry benchmarks or past performance. They offer a background for evaluating the organization’s financial well-being and effectiveness.
  7. Simple and understandable: KPIs must be straightforward, clear, and easy to understand, helping stakeholders understand their importance and consequences.
  8. Integrated with other departments: Efficient Key Performance Indicators in accounting departments are linked with other operational areas. This encourages teamwork and synchronization throughout the organization.
  9. Responsive to change: KPIs should be adaptable and responsive to changes in the business environment. This allows for dynamic measurement and management of financial performance.
  10. Linked to incentives: Where applicable, the best KPIs are linked to incentives, motivating accounting staff to achieve and exceed performance targets.

What Type of Key Performance Indicators are used by Accounting Staff?

Here are the types of Key Performance Indicators for accounting staff:

Accuracy of Financial Reporting

  • Error Rate in Financial Reports
  • Number of Audit Adjustments

Timeliness

  • Close Cycle Time
  • On-Time Reporting Percentage

Efficiency

  • Invoices Processed per Day
  • Cost per Invoice Processed
  • Transaction Processing Time

Compliance and Control

  • Compliance Rate with Policies and Regulations
  • Number of Compliance Issues

Reconciliation and Accuracy

  • Bank Reconciliation Time
  • Number of Unreconciled Transactions

Accounts Receivable and Payable

  • Days Sales Outstanding (DSO)
  • Days Payable Outstanding (DPO)
  • Accounts Receivable Turnover
  • Accounts Payable Turnover

Cash Flow Management

  • Cash Flow Forecast Accuracy
  • Operating Cash Flow Ratio

Expense Management

  • Budget Variance
  • Expense Report Processing Time

Customer Service (Internal and External)

  • Response Time to Financial Queries
  • Internal Customer Satisfaction Score

Continuous Improvement

  • Training Hours
  • Process Improvement Initiatives Implemented

How to Measure or Track KPI in Accounting?

Measuring and tracking KPIs in accounting involves a series of steps. Here’s a breakdown of how to effectively measure and track KPIs in accounting:

  1. Define KPIs: Start by defining the key performance indicators (KPIs) aligning with the accounting department’s goals and objectives.
  2. Set targets: Establish specific, measurable targets for each KPI, providing a clear benchmark for performance assessment.
  3. Collect data: Gather relevant financial and operational data related to the defined KPIs, ensuring accuracy and completeness.
  4. Automate reporting: Use automated tools and systems to streamline KPI data collection and reporting. This reduces manual effort and improves efficiency.
  5. Monitor regularly: Monitor KPI performance in real-time or at regular intervals to track progress and identify trends.
  6. Analyze results: Conduct in-depth analysis of KPI data to gain insights into financial performance, efficiency, and areas for improvement.
  7. Report findings: Communicate KPI findings and insights to stakeholders, including management, to foster transparency and informed decision-making.
  8. Adjust and improve: Based on KPI analysis, make necessary adjustments and improvements to accounting processes and strategies to optimize performance.

How to Evaluate KPIs for Accounting?

Data analysis can be a maze of numbers, a puzzle of trends, and a jungle of outliers. Making sense of it all is exhausting. Excel, while powerful, sometimes falls short in making this data dance to reveal its secrets. This is where data visualization swoops in as the hero of the story. It turns complex KPIs into captivating visual narratives.

However, when Excel’s capabilities reach their limits, ChartExpo emerges as the knight in shining armor. It unlocks the true potential of big data and effortlessly transforms it into actionable insights.

With ChartExpo, your data won’t just be a wallflower; it’ll be the life of the party, dancing with insights.

Let’s learn how to install ChartExpo in Excel.

  1. Open your Excel application.
  2. Open the worksheet and click the “Insert” menu.
  3. You’ll see the “My Apps” option.
  4. In the Office Add-ins window, click “Store” and search for ChartExpo on my Apps Store.
  5. Click the “Add” button to install ChartExpo in your Excel.

ChartExpo charts are available both in Google Sheets and Microsoft Excel. Please use the following CTAs to install the tool of your choice and create beautiful visualizations with a few clicks in your favorite tool.

Example

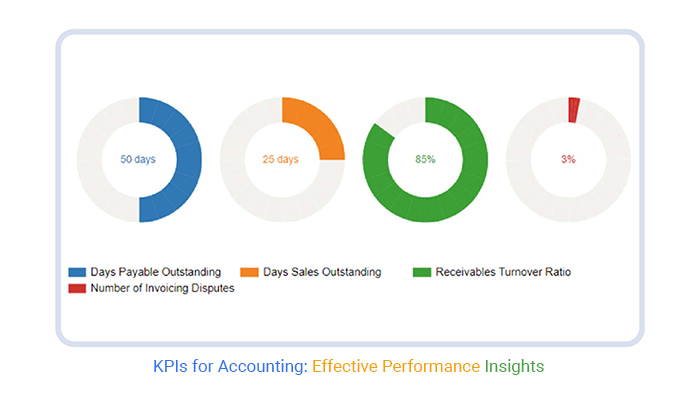
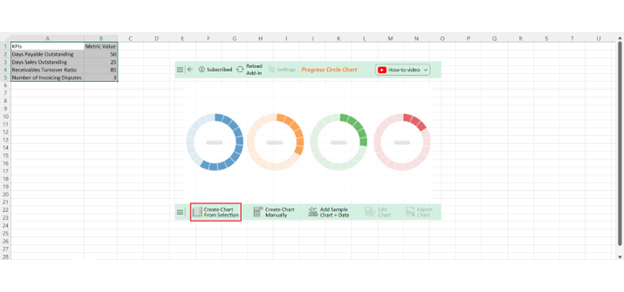
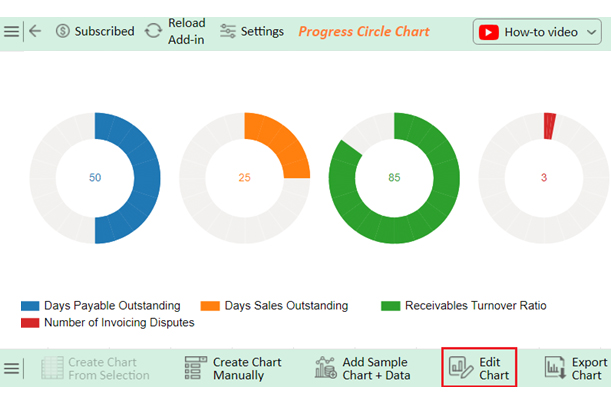
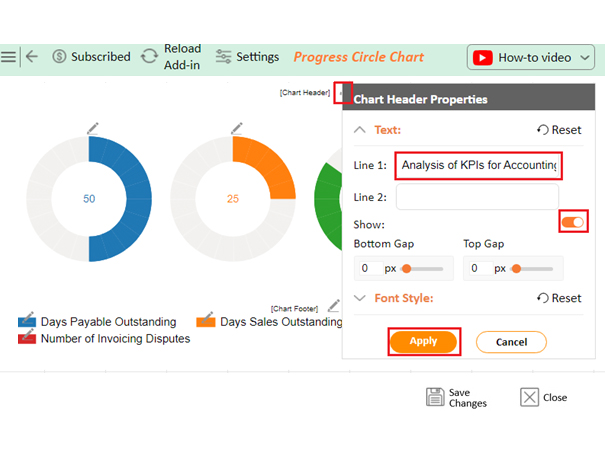
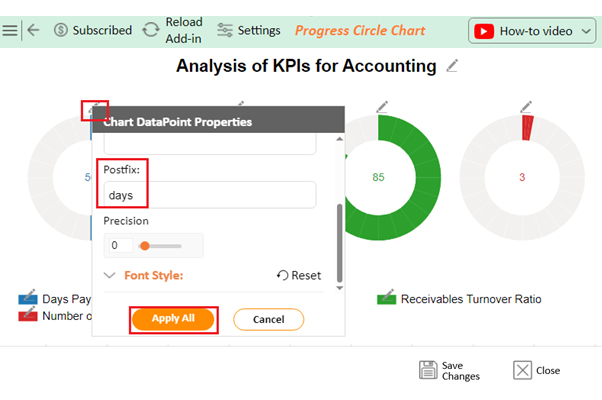
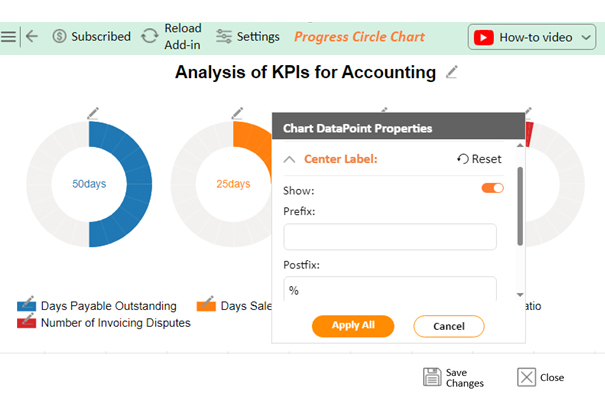
Let’s analyze the KPIs for accounting example data below using ChartExo.

KPIs Metric Value
Days Payable Outstanding 50
Days Sales Outstanding 25
Receivables Turnover Ratio 85
Number of Invoicing Disputes 3
  • To get started with ChartExpo, install ChartExpo in Excel.
  • Now Click on My Apps from the INSERT menu.
insert chartexpo in excel
  • Choose ChartExpo from My Apps, then click Insert.
open chartexpo in excel
  • Once it loads, scroll through the charts list to locate and choose the “Progress Circle Chart”.
search Progress Circle Chart in Excel
  • Click the “Create Chart From Selection” button after selecting the data from the sheet, as shown.
Create Chart From Selection for KPIs for Accounting
  • ChartExpo will generate the visualization below for you.
Edit Chart for KPIs for Accounting
  • If you want to add anything to the chart, click the Edit Chart button:
  • Click the pencil icon next to the Chart Header to change the title.
  • It will open the properties dialog. Under the Text section, you can add a heading in Line 1 and enable Show.
  • Give the appropriate title of your chart and click the Apply button.
Add Chart Header for KPIs for Accounting
  • You can add the word “days” with the first two fields:
Add Days Word First Two Fields for KPIs for Accounting
  • You can add the percentage sign with the next two fields:
Add Percentage Sign in Two Fields for KPIs for Accounting
  • Click the Save Changes button to persist the changes made to the chart.
Save Changes for KPIs for Accounting
  • Your final Progress Circle Chart will look like the one below.
Final KPIs for Accounting

Insights

  • The data indicates effective financial processes with short Days Payable Outstanding (DPO) and Days Sales Outstanding (DSO). This shows fast payment receipt and successful credit control.
  • A high Receivables Turnover Ratio indicates effective management of cash flow.
  • Few invoicing conflicts suggest efficient billing procedures and satisfied customers.

FAQs

What is a key performance indicator for the accounting department?

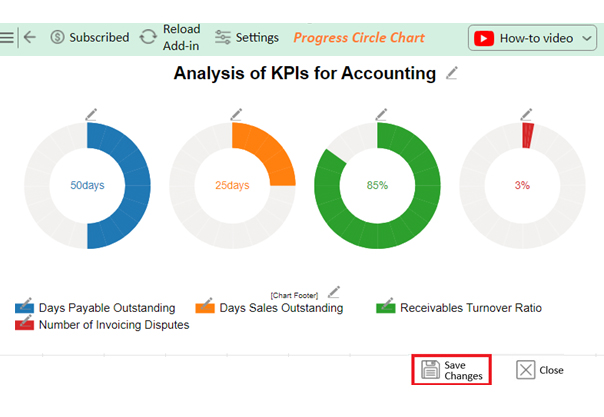
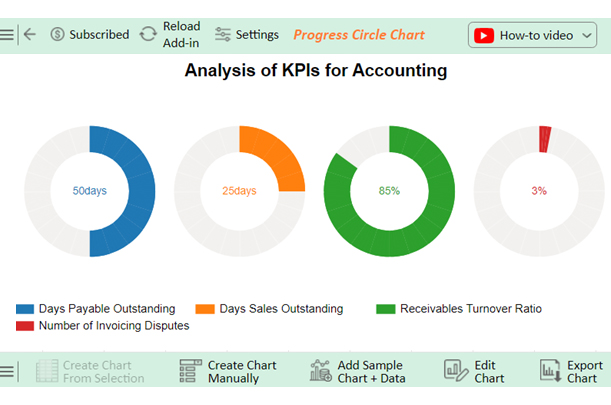
One key performance indicator for the accounting department is “Days Sales Outstanding (DSO)”. DSO measures the average days it takes to collect payment after a sale. It reflects the efficiency of the accounts receivable process and the management of credit policies.

How do you measure the performance of an accounting department?

To measure the performance of an accounting department:

  • Use specific Key Performance Indicators (KPIs) tailored to accounting functions
  • Collect and analyze data
  • Monitor regularly
  • Communicate results
  • Review the effectiveness of the KPIs to ensure they align with the organization’s goals and foster accountability.

What are the KPIs for account management?

Key Performance Indicators (KPIs) for account management include:

  • Customer satisfaction
  • Customer retention rate
  • Upsell and cross-sell revenue
  • Response time to customer queries
  • Account growth rate
  • Overall account profitability

These KPIs help measure the effectiveness of account management in maintaining and growing customer relationships.

Wrap Up

Effective Key Performance Indicators (KPIs) for accounting align with the organization’s strategic goals. They provide a clear link between daily operations and overarching objectives.

These KPIs should be specific, measurable, achievable, relevant, and time-bound (SMART). They provide a clear understanding of what is being measured and the target to be achieved.

Additionally, the best KPIs have clearly defined data sources, ensuring transparency in measuring and tracking each indicator. Consistent reporting frequency is crucial, as it provides insights into performance trends and areas that require attention.

Furthermore, every KPI should have clear ownership, ensuring accountability for tracking, reporting, and refining specific indicators. This promotes a sense of responsibility within the organization.

To prevent overwhelming stakeholders, the best KPIs are limited in number, typically ranging from 5 to 7. This limitation prevents confusion and ensures attention is focused on the most critical indicators.

By adhering to these principles, organizations can effectively measure progress and make data-driven decisions to achieve long-term goals.

How much did you enjoy this article?

ExcelAd2
Start Free Trial!
136423

Related articles

next previous
Microsoft Excel8 min read

Excel Task Tracker Template for Smarter Task Insights

Task tracker template in Excel organizes tasks, tracks deadlines, and boosts efficiency. Learn its benefits, and explore expert tips to simplify task management.

Microsoft Excel10 min read

Invoice Tracker Template in Excel for Better Insights

An invoice tracker Excel template helps track invoices, due dates, and payments. Learn how to use this template for better financial management.

Microsoft Excel12 min read

Key Performance Indicators in Healthcare for Better Insights

Key Performance Indicators in healthcare track patient care and efficiency. Learn about these KPIs, top examples, and how to use them to improve outcomes.

Microsoft Excel10 min read

BMI Calculation Formula in Excel for Better Fitness Insights

The BMI calculation formula in Excel helps track and analyze body mass index. Explore step-by-step instructions and tips to simplify BMI tracking in Excel.

Microsoft Excel29 min read

How to Create a Tornado Chart in Excel? A Complete Guide

Click to learn how to plot a Tornado Chart in Excel using easy-to-follow steps. Also, we’ll address the following question: what is a Tornado Diagram?

ChartExpo logo

Turn Data into Visual
Stories

CHARTEXPO

  • Home
  • Gallery
  • Videos
  • Services
  • Pricing
  • Contact us
  • FAQs
  • Privacy policy
  • Terms of Service
  • Sitemap

TOOLS

  • ChartExpo for Google Sheets
  • ChartExpo for Microsoft Excel
  • Power BI Custom Visuals by ChartExpo
  • Word Cloud

CATEGORIES

  • Bar Charts
  • Circle Graphs
  • Column Charts
  • Combo Charts
  • Comparison Charts
  • Line Graphs
  • PPC Charts
  • Sentiment Analysis Charts
  • Survey Charts

TOP CHARTS

  • Sankey Diagram
  • Likert Scale Chart
  • Comparison Bar Chart
  • Pareto Chart
  • Funnel Chart
  • Gauge Chart
  • Radar Chart
  • Radial Bar Chart
  • Sunburst Chart
  • see more
  • Scatter Plot Chart
  • CSAT Survey Bar Chart
  • CSAT Survey Chart
  • Dot Plot Chart
  • Double Bar Graph
  • Matrix Chart
  • Multi Axis Line Chart
  • Overlapping Bar Chart
  • Control Chart
  • Slope Chart
  • Clustered Bar Chart
  • Clustered Column Chart
  • Box and Whisker Plot
  • Tornado Chart
  • Waterfall Chart
  • Word Cloud
  • see less

RESOURCES

  • Blog
  • Resources
  • YouTube
SIGN UP FOR UPDATES

We wouldn't dream of spamming you or selling your info.

© 2025 ChartExpo, all rights reserved.