Categories
Tracking how quickly customers pay their invoices is one of the most reliable ways to gauge a company’s financial health.
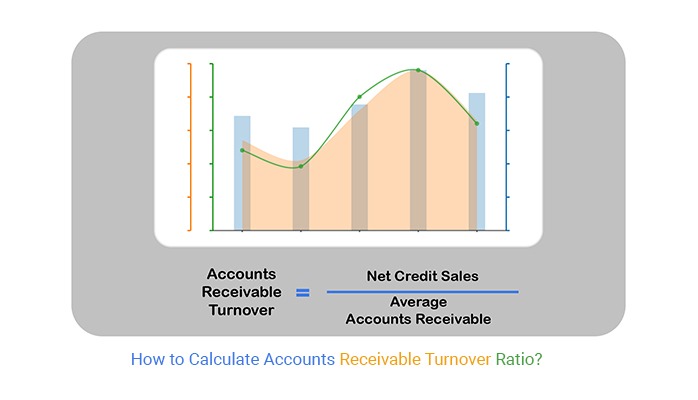
To calculate accounts receivable turnover ratio, finance teams divide net credit sales by the average receivable balance, producing a single figure that captures how efficiently the business converts outstanding invoices into cash.
This guide walks through the formula step by step, demonstrates the full calculation inside Excel, and illustrates results across small, medium, and large business scenarios.
Whether you manage a growing enterprise or a large corporation, the techniques covered here will sharpen your receivables management and support stronger credit decisions.
Definition: To calculate accounts receivable turnover ratio, divide net credit sales by the average accounts receivable balance for the same period. The result shows how many times a business fully collects its outstanding receivables within that timeframe.
The metric centers on credit transactions only. Cash sales are excluded because they carry no receivable balance. Analysts use the ratio to judge whether customers honor payment terms and whether the company’s credit policy produces timely revenue conversion.
Most organizations calculate accounts receivable turnover ratio monthly, quarterly, or annually. Tracking it across multiple periods reveals efficiency trends and flags early signs of deteriorating cash flow.
Every business that extends credit needs a reliable way to judge how well its payment collection process is working. That is exactly why finance teams calculate accounts receivable turnover ratio regularly.
To calculate the accounts receivable turnover ratio, you need two figures from the company’s financial statements: net credit sales and the average accounts receivable balance for the same period.
Accounts Receivable Turnover Ratio = Net Credit Sales Average \ Average Accounts Receivable
Net credit sales cover only revenue earned on credit terms. Average accounts receivable is the mean of the opening and closing receivable balances for the period. Analysts frequently pair this ratio with the margin of safety ratio to put collection risk in a broader financial context.
Excel is a practical environment to calculate accounts receivable turnover ratio because all inputs remain visible in a single worksheet, and any change in figures triggers an instant recalculation.
Follow the steps below:
Open Excel and create a table.
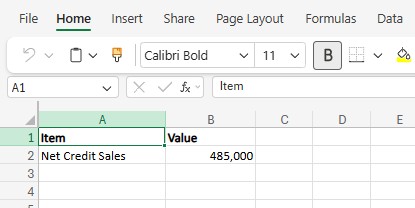
In cell B2, enter the total net credit sales for the year.
Example:
Net Credit Sales = 485,000
This value should include only credit sales, not cash sales. You can usually find this number in the sales report or income statement.
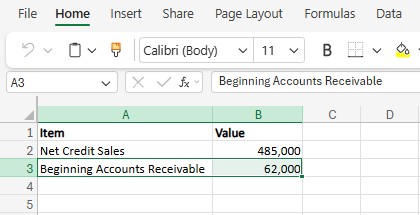
In cell B3, enter the accounts receivable balance at the start of the year.
Example:
Beginning Accounts Receivable = 62,000
This number comes from the previous year’s balance sheet.
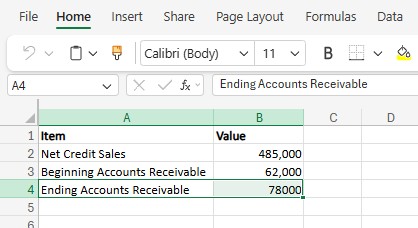
In cell B4, enter the accounts receivable balance at the end of the year.
Example:
Ending Accounts Receivable = 78,000
This represents the amount customers still owe at the end of the period.
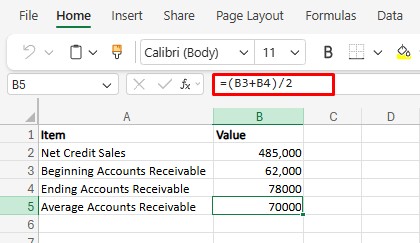
In cell B5, calculate the average using the formula:
=(B3+B4)/2
Result:
Average Accounts Receivable = 70,000
Using the average balance gives a more accurate result because receivables change during the year.
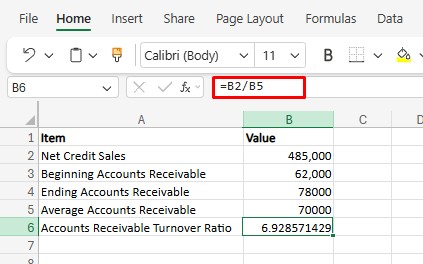
In cell B6, enter the formula:
=B2/B5
Result:
485,000 / 70,000 = 6.93
This means the company collected its receivables about 7 times during the year.
This calculation is often done when reviewing an income statement template in Excel to verify how quickly revenue is converted into cash.
The following scenarios show how to calculate accounts receivable turnover ratio across different business sizes, using the accounts receivable turnover ratio formula in each case.
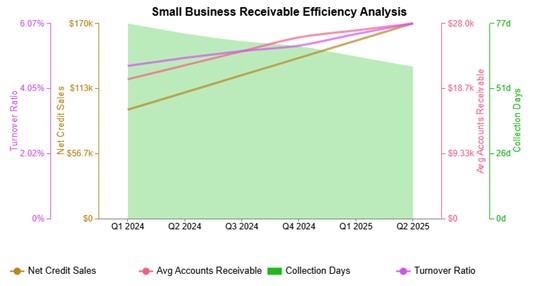
The small business example shows how to calculate accounts receivable turnover ratio at a smaller scale: modest credit sales paired with improving payment follow-up produce a climbing ratio as collection days shorten.
Example Insight: Tracks how quickly a small operation converts receivables and supports short-term cash flow decisions.
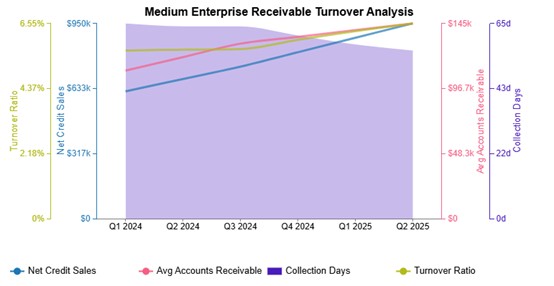
The medium enterprise scenario shows steady sales growth alongside controlled receivable balances. The ratio rises quarter over quarter, reflecting balanced credit management and improved liquidity as the business scales. Analysts may compare these figures with the debt-to-total assets ratio analysis to place collection performance in a solvency context.
Example Insight: Monitors how receivable management keeps pace with revenue growth while maintaining financial stability.
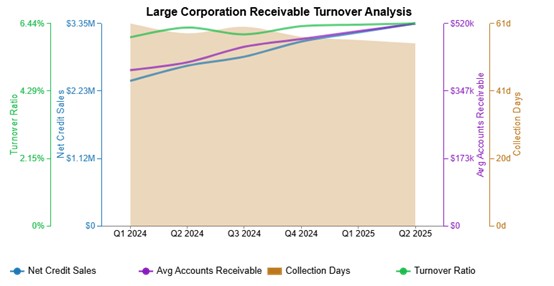
The large corporation example shows how to calculate accounts receivable turnover ratio at scale: high credit sales paired with stable receivable balances produce a strong, consistent result.
The figures point to efficient enterprise-level collection and reliable cash flow. Executives often cross-reference results with return on assets vs. return on equity to assess how collection efficiency contributes to overall profitability.
Example Insight: Evaluates collection efficiency at enterprise scale and informs long-range financial planning.

To calculate accounts receivable turnover ratio accurately, you need clean data, consistent period definitions, and formulas applied uniformly. The steps below use a large corporation dataset as the working example.
Tip: Use separate columns for each period so formulas can calculate averages without errors.
The central indicator is the accounts receivable ratio, which counts how many times the business collects its average receivable balance within the measurement period. Large corporations typically review this figure monthly or quarterly across business units.
You can also track related indicators such as:
Tip: Use the same time period for sales and receivables to keep the analysis accurate.
First, calculate the average receivable, then apply the ratio formula.
Average Receivable = (Beginning Receivable + Ending Receivable) / 2
Turnover Ratio = Net Credit Sales / Average Receivables
For example, a large corporation reports:
Net Credit Sales = 2,400,000
Beginning Receivable = 350,000
Ending Receivable = 450,000
Average Receivable = 400,000
Turnover Ratio = 2,400,000 / 400,000 = 6
Tip: Apply the formula for multiple periods to compare yearly or quarterly performance.
Once the ratio is calculated, determine whether the figure signals strong or weak collection performance.
Large corporations often compare results between divisions to find delays.
Tip: Use conditional formatting to highlight low ratios so problem areas become visible quickly.
Visual representations make the accounts receivable ratio far easier to communicate, particularly when presenting large-scale corporate data to stakeholders.
You can create:
Dedicated charting tools can generate advanced visualizations that surface collection trends and highlight performance gaps across departments or periods.
Companies that calculate accounts receivable turnover ratio gain valuable operational insights, but the metric also carries limitations that analysts should keep in mind.
Finance professionals often pair this ratio with the debt service coverage ratio to build a more complete picture of a company’s payment capacity.
A low result when you calculate accounts receivable turnover ratio signals a need for action. The following measures can strengthen collection performance.
To calculate the accounts receivable ratio, divide net credit sales by average accounts receivable. The average is calculated using beginning and ending receivable balances for the period.
A ratio of 12 means the company collects its average receivables 12 times in a year, which usually indicates fast collection and efficient credit management, depending on the industry.
Accountants, financial analysts, and managers should track accounts receivable to monitor cash flow, control credit risk, and ensure customers pay on time.
Knowing how to calculate accounts receivable turnover ratio gives finance professionals a clear, measurable view of collection efficiency and overall liquidity health. A strong ratio signals that customers are honoring payment terms and that cash is cycling through the business at a consistent pace, reducing the risk of cash flow gaps.
Regular monitoring of this ratio, supported by the formula, Excel steps, and real-world examples in this guide, equips any finance team to detect performance shifts early and act before small issues grow. Pairing it with related financial metrics deepens the analysis and leads to better-informed credit decisions over time.
How much did you enjoy this article?


Change Management KPIs are the key to tracking adoption, performance, and ROI during transitions. Find out which metrics matter. Read on!

Data collection methods and techniques determine the quality of every insight you act on. Explore key approaches for gathering reliable data. Read on!

Measuring Workforce Productivity helps businesses track performance and boost efficiency. Explore key methods, formulas, and metrics. Read on!