Categories
By ChartExpo Content Team
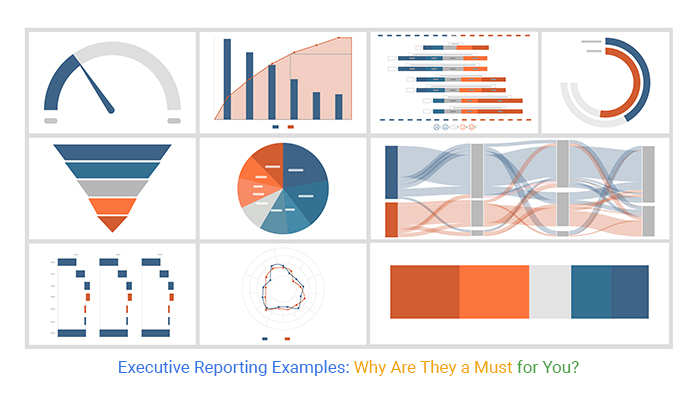
Are your reports helping or hindering decisions? Executive reporting examples show how to present data that leaders can act on immediately.
Data is everywhere, but not all data drives action. Executive reporting examples focus on showing what’s working, what’s not, and where to focus next.


These reports highlight critical metrics, cutting through the clutter to give leaders the insights they need.
Think of these examples as a bridge between raw numbers and decisions. From quarterly updates to financial snapshots, these reports ensure your message gets across clearly and effectively. Learn how to create reports that guide strategy and align goals.
Let’s focus on what makes these examples stand out and how they can shape smarter decisions for your organization.
First…
Executive reporting examples are concise reports. They offer high-level overviews of key business metrics. These reports focus on delivering strategic insights. They help leaders make data-driven decisions swiftly.
Typically, these reports include financial summaries, KPIs, and other critical data. They omit the granular details often found in standard operational reports.
Executive reports are brief and focus on key insights. They aim to inform strategic decisions. Standard reports are often more detailed and technical. They cater to those who manage day-to-day operations.
Executive reports use visuals to convey complex information quickly. Standard reports may include more text and fewer visual elements.
Common examples include financial performance summaries. These are crucial in industries like finance and retail.
Another example is marketing campaign overviews. These are used extensively in the advertising sector.
Health care executives often review patient care and safety reports.
These examples show how executive reports are tailored to industry needs. They highlight the most relevant information to aid strategic planning and assessment.
Executive reports need a clear layout. Start with a title page. Include the report’s title, date, and author details. Next, an executive summary outlines key points. It provides a snapshot of the content for fast decision-making. Use headings for each section to guide readers.
End with appendices for detailed data or extra information. This structure ensures readability and accessibility.
An effective executive summary highlights the main conclusions. Start with the purpose of the report. Briefly discuss the data and methods used. Summarize the findings in a few sentences. End by noting the suggested actions based on the report. This section must be concise yet comprehensive enough to stand alone.
Visuals aid in clearer communication. Use graphs to show trends and comparisons. Tables are great for presenting raw data succinctly. Infographics can explain complex processes simply and vividly. Ensure each visual element has a caption explaining its relevance.
These tools help executives grasp the report’s findings quickly and effectively.
To simplify complex data, start with clear goals. What does your audience need to know? Use bullet points to break down data into manageable chunks. This makes complex information more digestible.
Charts and graphs can also clarify complex data. Choose the right type of chart for the data you have. For example, use bar charts for comparisons and line charts for trends. This helps viewers grasp the information quickly.
Finally, use color coding. Color can highlight important data points. It draws the eye to key information without overwhelming the reader.
A balanced tone is essential in executive reporting. Your tone should be professional yet clear. Avoid slang and maintain formal language, which conveys respect and seriousness.
Clarity is also crucial. Use short sentences and simple words. This ensures that all readers understand the report, regardless of their expertise.
Moreover, be direct in your communication. Avoid roundabout phrases. Direct statements help maintain the attention of busy executives.
Visuals are powerful in executive reports and should balance well with text. For instance, pair a concise paragraph with a supporting graph, such as a Scatter plot chart, to highlight key patterns. This balance aids quick comprehension.
Ensure visuals are relevant. Each chart or graph should have a clear purpose, as irrelevant visuals can distract from the main message.
Text should also be concise. Use bullet points or numbered lists to present key information. This format is easy to scan, allowing executives to grasp the essentials quickly.
In executive reports, identifying key metrics is vital. These metrics guide decision-making. They focus on areas impacting business performance. For instance, a retail manager tracks daily sales, customer foot traffic, and inventory turnover. These metrics provide a snapshot of business health.
Metrics should align with strategic goals. If a company aims to boost customer satisfaction, relevant metrics might include customer service response times and satisfaction scores. This alignment ensures that executives focus on strategic targets, not just operational data.
Choose metrics that are actionable. Metrics should inform decision-making and prompt specific actions. If customer satisfaction scores dip, it could trigger a review of service policies or staff training sessions. This focus prevents executives from drowning in data, instead spotlighting paths to improvement.
Data must be organized logically in reports. This organization aids in understanding and action. Group similar data together. For example, financial data like revenue, costs, and profit margins should be in one section. This grouping helps in quickly assessing financial health.
Use headings and subheadings to direct attention. They act as signposts, guiding readers through the report. This structure makes it easier for executives to find the information they need without searching.
Present data consistently. Use the same formats and scales for similar types of data. Consistency reduces confusion, making it easier for readers to compare data and track trends over time.
Box and whisker plots are effective in executive reports. They show data distribution at a glance. This type of chart highlights medians, quartiles, and outliers. For example, it can show the distribution of customer wait times. This insight is valuable for identifying service efficiency and areas needing improvement.
The box in the chart represents the interquartile range. It shows where the middle 50% of data lies. The line inside the box marks the median. Lines extending from the box indicate variability outside the upper and lower quartiles.
Use this chart when you need to show variations in data sets across different categories or times. It’s especially useful for spotting outliers or unusual fluctuations. This can prompt further investigation or immediate action, depending on the findings.
The following video will help you to create a Sankey Chart in Microsoft Excel.
The following video will help you to create the Sankey Chart in Google Sheets.
Executives need clear, concise reports. Here’s a look at how to structure them. Start with a brief overview. Highlight key points early. This grabs attention. Next, delve into specifics. Use bullet points for clarity. Finish with data visuals. Charts and graphs work well.
Real-world examples include quarterly earnings reports. These often start with financial highlights. They then detail operational challenges and successes. Another example is project status updates. These reports focus on milestones, risks, and next steps.
Templates make report creation easier. Start with a standard header. Include sections for financial, operational, and strategic content. Use footers for page numbers and confidentiality notes. Templates ensure consistency across reports.
Strategic decisions require detailed reports. These reports should start with market analysis. Include competitive landscape and consumer trends. Next, present strategic options. Use clear headings for each option. Discuss potential impacts and risks.
A real-world example is a market expansion report. It might start with an analysis of market size and growth. It then outlines entry strategies and potential barriers. Finally, it evaluates financial implications. This helps executives make informed decisions.
Another example is a technology upgrade proposal. Begin with current tech limitations. Detail proposed upgrades and expected benefits. Include a cost-benefit analysis. This supports strategic investment decisions.
Marketing reports highlight campaign performance. Start with campaign goals. Were they met? Use data to show outcomes. Include customer feedback for depth. Conclude with future marketing strategies. This informs ongoing efforts.
Finance reports focus on financial health. Begin with a summary of financial statements. Discuss key figures like revenue and expenses. Analyze trends over time. End with financial forecasts. This aids in budget planning and financial strategy.
Each industry has unique focus areas. Tailor summaries to reflect this. Use industry-specific language and metrics. This enhances relevance and usefulness.
Clustered bar charts are great for comparison. They show data for multiple groups side by side. This makes differences clear. Use different colors for each group. This aids in visual distinction.
Start with choosing the right data. Sales figures over several quarters are a good choice. Next, set up your chart. Label axes clearly. Place time on the horizontal axis and performance metrics on the vertical.
Include a legend. This explains what each color represents. Use the chart to highlight trends and outliers. This visual tool aids in quick analysis and decision-making.
KPIs are the stars of the business world. They guide firms, just like constellations guided ancient sailors. But stars alone aren’t enough; you need to read them correctly. That’s where insights come into play. They translate data into a language that decision-makers understand.
First, identify the critical KPIs. What metrics reflect business health? Sales, customer satisfaction, operational efficiency? Each industry has its stars; find yours. Next, link these KPIs with data insights. This connection is where the magic happens. It turns abstract numbers into a roadmap for action.
The process doesn’t stop with linking. It’s about ongoing adjustment and alignment. As goals shift, so should your focus. This flexibility keeps businesses agile and responsive. It’s not just about setting a course; it’s about adjusting it as winds change.
Project updates can drown in details. An executive summary is your lifeboat. It keeps you afloat, focusing on what matters. These summaries provide a snapshot, capturing the essence of the project at a glance. They highlight progress, issues, and next steps in a crisp, clean format.
Start with the basics: What is the project? Why does it matter? Then, dive into progress. What milestones have been reached? What obstacles have emerged? This section should be brief but bold. It’s the heart of your update.
Finally, outline the next steps. What’s the immediate focus? This forward-looking section is crucial. It ensures everyone is aligned and moving toward the same goals. It’s not just an update; it’s a call to action.
Visuals can speak louder than words, especially in reporting. A Sankey diagram is a brilliant example. It doesn’t just show data; it shows flow. Inputs, outputs, and transformations are laid out in a way that anyone can understand.
The strength of a Sankey diagram lies in its clarity. Complex processes are broken down into clear paths. The width of each line in the diagram is proportional to the flow quantity. This visual weighting makes it easy to spot significant trends and bottlenecks.
Use this tool to map out workflows, energy transfers, or budget allocations. Seeing the flow helps pinpoint efficiency losses and highlight areas for improvement. It’s not just a chart; it’s a diagnostic tool.
Selecting the right tools for executive reporting is vital. What tools do we use? There are many, but focus on compatibility and features. It matters that they align with your data systems.
Consider the tool’s ability to handle data integration. Does it sync well with your existing databases? This is key for accurate reporting. Also, look at the security features. You want your data safe and secure.
Finally, assess the user interface. Is it easy to navigate? A good UI helps avoid confusion and saves time. These points guide you in choosing the right tools.
Automated dashboards are lifesavers. Why? They provide real-time data at a glance. This means no waiting for weekly updates. Instant insights guide quick decision-making.
Think about the time you save with automation. No more manual data entries. This means fewer errors and more time for strategy. Automated reports also ensure consistency in data presentation.
The efficiency of automated systems is clear. They streamline processes and enhance productivity. Embrace these tools to save time and reduce workload.
Histograms are effective for trend analysis. What do histograms show? They display frequency distributions in a visual format. This makes it easier to spot patterns and outliers.
Why use histograms in executive reporting? They simplify complex data sets. This clarity helps in understanding key trends. Decision-makers can see the big picture at a glance.
Histograms also support comparative analysis. Compare different time periods or product performances. This visual tool aids in making informed strategic decisions.
Jargon can confuse readers. It’s common in executive reports. Reports should be clear. Use simple language to explain terms. This approach aids understanding. Define all acronyms first. Follow with their full forms.
This method ensures clarity. Avoid industry-specific terms without explanation. Replace complex terms with simpler alternatives. This helps keep the report accessible. Aim for clarity to communicate effectively. Clear reports save time. They make decision-making easier.
Reports often overflow with data. This can overwhelm readers. Focus on key takeaways to avoid this. Start with the main points. Support them with necessary data only. This strategy prevents information overload.
Use bullet points for clarity. They highlight important information. Summarize data insights concisely. This enhances understanding. Avoid adding all data collected. Select data that supports your conclusions. This method keeps the report focused and useful.
Visual tools enhance report clarity. A Pareto chart is effective. It shows the most significant factors. This chart uses bars and lines. Bars represent individual values. Lines indicate cumulative totals.
This visual helps identify priority areas. Focus on the left side of the chart. It usually contains critical issues. Use colors to differentiate data. This makes the chart easier to understand. Pareto charts simplify complex data. They make priorities clear at a glance.
SaaS and tech industries thrive on rapid innovation and data-driven decisions. These sectors often use reports that highlight key performance indicators (KPIs). Metrics like monthly recurring revenue (MRR) and churn rate are common.
Dashboards often display real-time data, aiding quick decision-making. This real-time approach supports agile management practices prevalent in tech industries.
Retail and nonprofit sectors require different data focuses in their executive summaries. Retail reports might focus on sales growth, inventory turnover, and customer acquisition costs.
For nonprofits, the emphasis could be on fundraising efficiency, program expenses, and outreach impact. These reports are vital for stakeholders to assess organizational health and guide future strategies.
A tree map is an excellent tool for displaying hierarchical data as nested rectangles. Each branch of the tree is given a rectangle, which is then tiled with smaller rectangles representing sub-branches. This visual tool is effective in executive reports for showing proportions.
For instance, a company’s product lines can be visualized, showing each product’s revenue contribution at a glance. This helps in quickly identifying which products are performing well and which are not, without sifting through complex tables or spreadsheets.
When assessing executive summaries, key metrics stand out. First, clarity measures how easily an executive can grasp the main points. Next, conciseness checks if the summary is brief yet complete.
Relevance ensures all included information aids decision-making. Timeliness evaluates if the data reflects the most current scenarios. Finally, actionable insights gauge if the report prompts strategic decisions.
Feedback is vital for enhancing executive reports. Start by gathering input from all report users, not just top executives. Identify common issues they highlight, and prioritize these for adjustments.
Implement changes in the next report iteration and track if feedback improves understanding and usability. This process makes reports more effective tools for informed decision-making.
A double bar graph effectively compares two metrics side by side. This visual tool is perfect for displaying performance against two distinct variables.
For example, it can compare this year’s sales to last year’s in each region. Make sure to use contrasting colors for clarity. Always label each axis clearly, and provide a brief legend to aid interpretation.
This type of graph can instantly highlight trends and discrepancies, aiding swift executive decisions.
Reports for internal audiences should focus on operational details and team performance. These details help internal stakeholders make informed decisions quickly.
In contrast, reports for external audiences must prioritize compliance, financial metrics, and market position. These elements reassure external stakeholders of the company’s stability and growth potential.
Always ensure that data shared externally aligns with regulatory requirements and protects sensitive information.
For board meetings, synthesize complex data into strategic insights. Boards need to understand potential impacts on company direction and policy. Use scenarios to show how different decisions might play out.
For CEOs, focus on critical issues, opportunities, and threats. CEOs need concise, actionable insights that drive quick decision-making. Tailor these reports to reflect the CEO’s priorities and the strategic goals of the business.
Likert Scale charts are excellent for presenting survey data. They show how stakeholders feel about specific issues, from strongly agree to strongly disagree. Customize these charts to highlight the most relevant feedback for the audience.
For instance, if presenting to HR, focus on employee satisfaction. For product development teams, concentrate on customer feedback about product features. This customization makes the visual data more relevant and actionable for the viewer.
Simplicity is key in modern executive report designs. Busy executives need to grasp data with a quick glance. Clean layouts with bold headings are in. Cluttered pages are out.
Responsive design is also crucial. Reports must look good on any device, from desktops to smartphones. This flexibility ensures executives can access data anytime, anywhere.
Lastly, personalization features are growing. Reports now tailor information to individual preferences. This makes them more relevant and useful to each user.
Storytelling transforms dry data into compelling narratives. It’s about connecting data with the real world. This approach makes reports more engaging and memorable.
Good storytelling in reports often involves case studies. These provide concrete examples of data in action. They show how numbers affect real business outcomes.
Visual storytelling is also effective. It uses images and graphics to represent data. This can make complex information more accessible and easier to understand.
The Waterfall chart is excellent for showing sequential data. They display the cumulative effect of sequentially introduced values. This can reveal hidden trends in the data.
These charts are particularly useful for financial reporting. They can show how initial values are influenced by gains and losses over time. This offers a clear picture of financial health.
Waterfall charts are also adaptable. They can be used to represent any data that accumulates over time. This makes them a versatile tool in executive reporting.
Strategic planning relies on accurate, concise data. Executive summaries provide this essential information. They offer insights into market trends and company performance.
Leaders use these summaries to set long-term goals. They also help identify opportunities for growth and innovation. This drives strategic alignment across the organization.
Transparent reporting fosters a culture of trust. It ensures all team members are on the same page. Clear, concise executive reports eliminate confusion. They make responsibilities and expectations clear.
This boosts collaboration as teams work towards common goals. Enhanced communication leads to increased productivity and morale.
Radar charts are effective for displaying performance metrics. They allow quick comparison across various parameters. Teams can see strengths and areas for improvement. This visual tool helps in assessing balance across multiple factors.
It supports better decision-making by highlighting trends and discrepancies.
Consider a merger between two leading tech firms. The executive summary highlighted key synergy areas. It focused on combined tech strengths and market reach.
The summary was direct. It showed financial benefits and possible risks. This helped stakeholders make informed decisions quickly.
Such summaries are vital in M&As. They offer a snapshot of key benefits and challenges. This aids executives in navigating complex decisions.
Crisis management requires fast, effective decision-making. Executive reports provide essential data quickly. For example, during a product recall, timely reports can track recall progress. They also monitor public responses and media coverage.
Another scenario involved a data breach at a bank. Executive reports tracked the breach’s impact. They also guided the communication strategy to maintain customer trust.
In crises, these reports are lifelines. They offer real-time data that is crucial for quick responses.
The sunburst chart is excellent for showing hierarchical data. It’s like a pie chart but provides deeper layers. This is useful in industries with complex structures.
For example, in healthcare, a sunburst chart can display patient data. It shows types of illnesses, treatments, and outcomes by region. This helps in managing resources effectively.
In finance, it can show revenue streams. It breaks them down by sectors, products, and regions. This aids in pinpointing areas for growth.
Sunburst charts are powerful tools. They turn complex data into understandable visuals. This helps executives make better decisions based on solid data insights.
Achieving balance is key. Start by outlining the main points. What must readers take away? Use visuals to highlight these points. Graphs and charts are effective. They show trends and comparisons quickly. Pair each visual with a short, descriptive text. This text should explain the ‘why’ behind the data.
Do not let visuals overshadow the text. Each element should complement the other. Use text to provide context. It explains what the data means in practical terms. This is critical for decision-making. Visuals catch the eye, but the text drives the message home.
Ensure each page has a focal point. What is the most important part? Design the layout to draw the eye here. Use spacing and color to guide readers. This strategic use of design can enhance comprehension. It makes reports easier to navigate.
Dashboards must be user-friendly. They should provide key metrics at a glance. Start with understanding what executives need to know. What decisions do they make? Tailor the dashboard to these needs. Include only the most relevant metrics. Too much information can be as bad as too little.
Use clear labels and easy-to-read fonts. Executives should not struggle to understand what they are seeing. Test different designs with real users. Collect feedback. What works? What doesn’t? Continuous refinement based on feedback is key. It ensures the dashboard remains useful.
Consider mobile accessibility. Executives often need information on the go. Make sure the dashboard performs well on mobile devices. This may mean simplifying some elements. The goal is to maintain functionality without sacrificing clarity.
Multi-axis line charts are powerful. They can show relationships between different data sets. This is useful when the data varies in scale. Use one axis for each data type. For example, revenue might be on one axis and units sold on another. This allows for comparison without confusion.
Choose colors wisely. Each line should be distinct. This helps in distinguishing data sets. Avoid colors that are too similar. They can make charts hard to read. Also, consider the color vision deficiencies. Some color combinations can be problematic.
Label each axis clearly. What does each one represent? This reduces misinterpretation. Legends are helpful. They guide the reader in understanding the chart. Place legends near the corresponding lines. This minimizes eye movement and speeds up comprehension.
Executive reporting examples bring clarity to decision-making. They simplify data into actionable insights, helping leaders focus on what matters most. These examples highlight essential metrics like revenue, customer retention, and operational efficiency, giving decision-makers the tools they need to act confidently.
By focusing on what works and identifying what doesn’t, executive reports eliminate guesswork. They transform complex data into clear, concise summaries that support effective strategies. Leaders can quickly assess performance, address challenges, and seize opportunities.
The value of executive reporting examples lies in their precision and relevance. They guide businesses by connecting data to meaningful decisions. Start using them to align your goals and drive better outcomes.
Because when decisions matter, clarity isn’t optional—it’s essential.
How much did you enjoy this article?


Calculate accounts receivable turnover ratio to measure credit collection speed, improve cash flow, and strengthen your financial strategy. Read on!

Change Management KPIs are the key to tracking adoption, performance, and ROI during transitions. Find out which metrics matter. Read on!

Data collection methods and techniques determine the quality of every insight you act on. Explore key approaches for gathering reliable data. Read on!


