Categories
Understanding direct vs. indirect cash flow is crucial. The clarity in this distinction enables you to track and determine how money comes in and exits your business.


As a business owner, critical decision-making is necessary. You’ll want to understand the amount of money coming in and going out. This approach does precisely that.
Why does this matter?
You can make informed choices by understanding indirect vs direct method accounting. The Financial Executives Research Foundation reveals that 82% of CFOs believe cash flow visibility is essential for success.
Imagine this. Understanding direct vs. indirect cash flow allows you to analyze the financial health of your business comfortably. Then, plan for the future and make well-informed decisions. Amazing!
So, let’s delve deeper into this essential aspect of financial management and explore its significance.
First…
Definition: The direct cash flow method tracks the actual cash inflows and outflows from a company’s core operating activities. It records real-time transactions like cash received from sales, payments made to suppliers, employee wages, and inventory purchases. Unlike other methods, the direct approach excludes investing and financing activities, providing a focused view of the business’s day-to-day liquidity.
Analyzing the cash flow statement using the direct method helps businesses assess their ability to meet short-term obligations, operate without relying on external funding, and maintain financial stability. Understanding this method is essential for efficient cash management and informed decision-making at the operational level.
Definition: Indirect cash flow is a method used to prepare the statement of cash flows. This approach starts with the company’s net income and then adjusts for non-cash items and changes in working capital. It is primarily used to reconcile net income with the cash generated from operating activities. Key adjustments include depreciation, changes in accounts receivable and payable, and inventory fluctuations.
The cash flow statement using the indirect method offers insights into how net income translates into actual cash flow from operations. By adjusting for non-cash expenses and working capital changes it helps reveal the true cash impact of business activities.
Analyzing indirect cash flow is essential for understanding a company’s liquidity, financial stability, and operational efficiency. It highlights the connection between reported earnings and real cash movement, supporting better financial analysis and decision-making.
Common Adjustments in Cash Flow Statement Using Indirect Method Include:
We use both the direct and indirect cash flow methods to understand how money flows in and out of a business through its operating activities, but each serves a different purpose.
Here we discuss the direct vs indirect cash flow example:
Imagine a coffee shop. For one month, it earns $20,000 in cash from customers. It spends $7,000 on coffee beans, $2,000 on utilities, and $3,000 on employee wages. In the direct cash flow statement, you will see:
Now, let’s look at the same coffee shop using the indirect method. Start with a net income of $8,000 for the month. Account for non-cash items and adjustments in working capital:
So, the indirect cash flow statement would show:
Both methods aim to reconcile net income with cash flow from operating activities, but follow different paths. Let’s find out how the statement of cash flow, direct vs indirect method, differs.
| Aspect | Direct Cash Flow | Indirect Cash Flow |
| Starting Point | Begins with cash receipts and payments related to operating activities. | Starts with net income and adjusts it for non-cash items and changes in working capital. |
| Transparency | Provides a detailed breakdown of cash inflows and outflows from operating activities. | Offers a reconciliation between net income and cash flows from operating activities. |
| Complexity | Requires comprehensive tracking of cash transactions, offering transparency into operational cash flows. | Relies on adjustments to reconcile net income with operating cash flows, making it less transparent regarding individual cash transactions. |
| Preference | Preferred by users seeking clarity and straightforwardness in depicting cash movements. | Commonly used by companies due to its alignment with accounting standards and simplicity in preparation. |
| Suitability | Useful for businesses with straightforward cash flow patterns or those seeking a detailed analysis of cash flows. | Suitable for companies with complex transactions. Or those looking to adhere to accounting standards while preparing the statement of cash flows. |
Analyzing direct vs. indirect cash flow is akin to a financial tug-of-war. It involves dissecting the cash movements within a business in a battle for clarity. Here, data visualization becomes the unsung hero, turning uninspiring numbers into a captivating narrative.
Yet, Excel, our everyday companion, falls short in the art of visual storytelling. Its charts and graphs, while serviceable, lack the flair needed to engage an audience.
Enter ChartExpo, the champion of data visualization. Its arsenal of captivating visuals transforms cash flow analysis into an enthralling saga. Bid farewell to lackluster charts and embrace the visual revolution with ChartExpo. After all, in the indirect vs direct method accounting analysis, a picture is worth a thousand words.
Let’s learn how to install ChartExpo in Excel.
ChartExpo charts are available both in Google Sheets and Microsoft Excel. Please use the following CTAs to install the tool of your choice and create beautiful visualizations with a few clicks in your favorite tool.


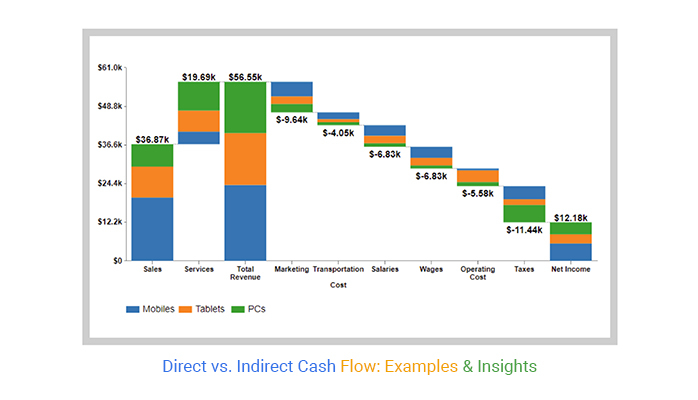
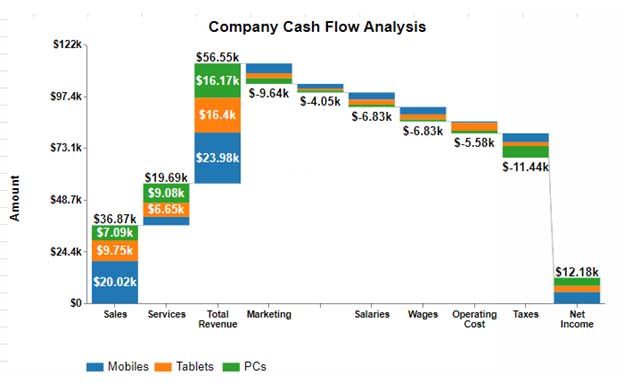
Let’s say you want to analyze the direct vs indirect cash flow data below.
| Stack | Bridge | Value |
| Sales | Mobiles | 20025 |
| Sales | Tablets | 9746 |
| Sales | PCs | 7095 |
| Services | Mobiles | 3959 |
| Services | Tablets | 6650 |
| Services | PCs | 9077 |
| Total Revenue | Mobiles | 23984 |
| Total Revenue | Tablets | 16396 |
| Total Revenue | PCs | 16172 |
| Marketing | Mobiles | -4630 |
| Marketing | Tablets | -2360 |
| Marketing | PCs | -2650 |
| Transportation Cost | Mobiles | -2150 |
| Transportation Cost | Tablets | -935 |
| Transportation Cost | PCs | -965 |
| Salaries | Mobiles | -3360 |
| Salaries | Tablets | -2340 |
| Salaries | PCs | -1130 |
| Wages | Mobiles | -3510 |
| Wages | Tablets | -2390 |
| Wages | PCs | -930 |
| Operating Cost | Mobiles | -640 |
| Operating Cost | Tablets | -3700 |
| Operating Cost | PCs | -1240 |
| Taxes | Mobiles | -4180 |
| Taxes | Tablets | -1800 |
| Taxes | PCs | -5460 |
| Net Income | Mobiles | 5514 |
| Net Income | Tablets | 2871 |
| Net Income | PCs | 3797 |
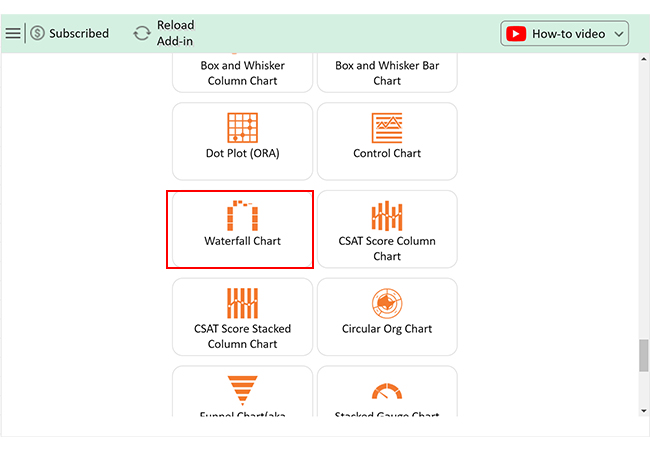
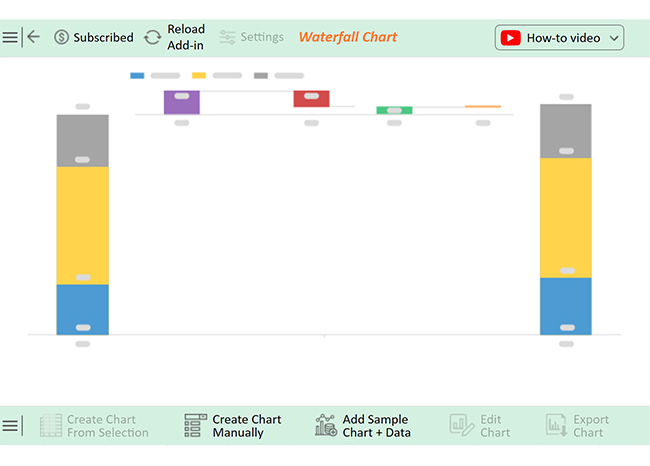
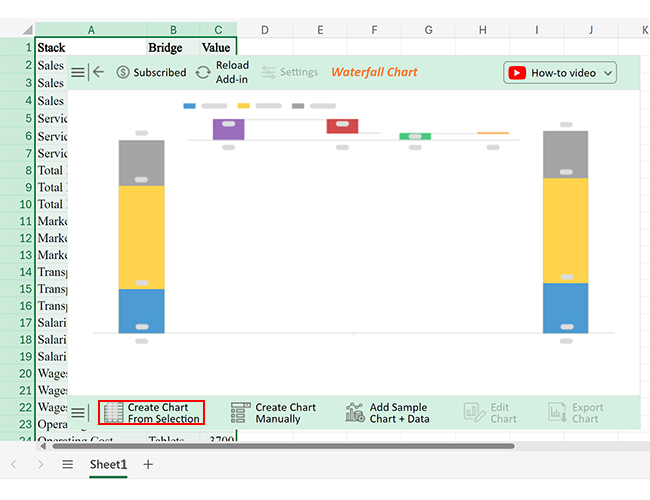
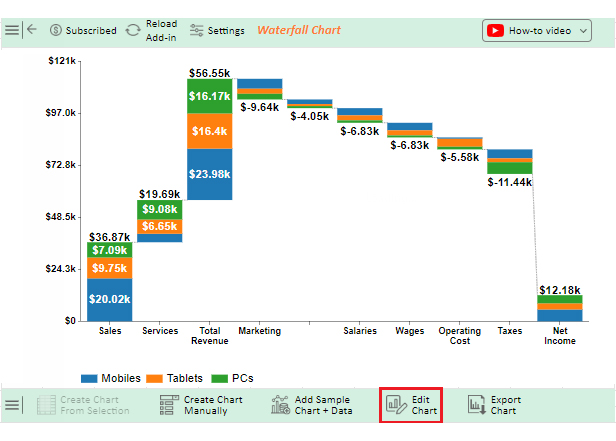
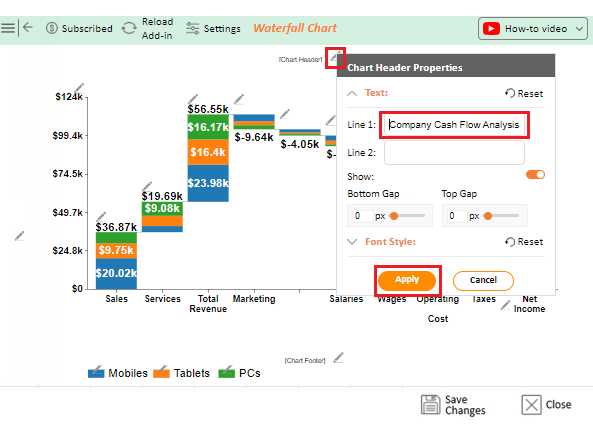
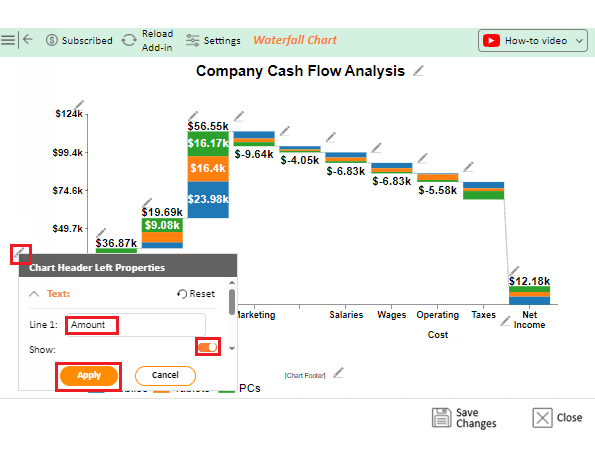
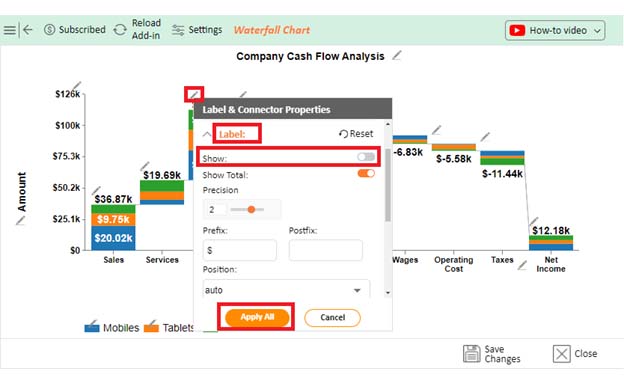
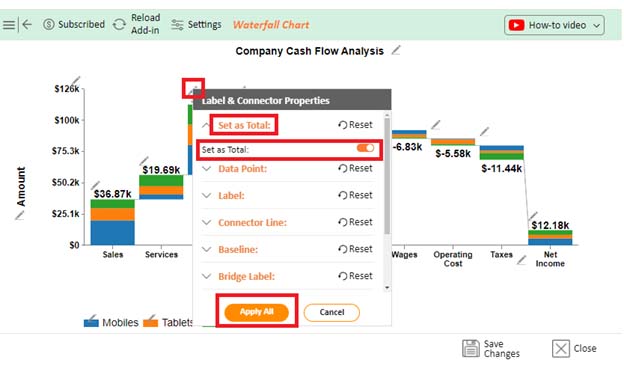
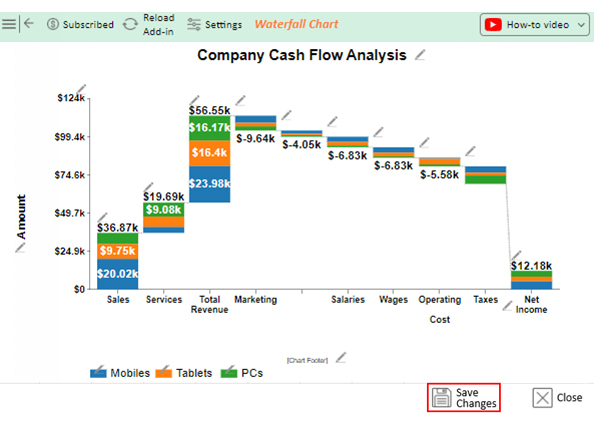
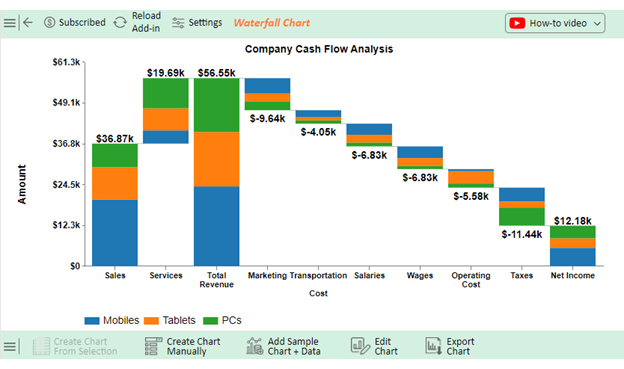
Follow the steps below to visualize statement of cash flow direct vs indirect method in Excel using ChartExpo and glean valuable insights.


These methods used to prepare financial statements of cash flows have distinct advantages and disadvantages. Let’s explore the advantages and disadvantages of each method to determine which one is ideal for you.
If you’re preparing financial statements for external stakeholders or auditors, the indirect method is typically preferred. It aligns with standard accounting formats and makes it easier to reconcile net income with cash flow.
Choose the direct method if you need a detailed breakdown of actual cash inflows and outflows. It offers better visibility into cash transactions, which is helpful for internal cash management and budgeting.
The indirect method is easier to implement if you’re working with accrual-based accounting records, as it uses data already available in your income statement and balance sheet. The direct method may require more granular data tracking.
Small to medium-sized businesses often opt for the indirect method due to its simplicity and compatibility with standard reporting tools. Larger companies with complex cash flows may benefit from using the direct method for deeper analysis and control.
Here you know which one is best for your business, Direct vs Indirect Cash Flow Statement:
Most companies use the indirect cash flow method due to its simplicity and alignment with accounting standards. While the direct method offers transparency, its complexity and data availability challenges make it less commonly used in practice.
The indirect cash flow method is generally considered easier due to its simplicity and alignment with accounting standards. The direct method’s complexity and data availability challenges make implementing it less straightforward.
The indirect cash flow method is better because it is simpler to implement and aligns with accounting standards. It meets regulatory requirements and is widely accepted. This makes it suitable for companies seeking compliance and consistency in financial reporting.
The difference between direct vs. indirect cash flow is primarily in the preparation of the statement of cash flows. However, both methods have a similar objective. The direct cash flow first outlines cash receipts and payments resulting from operating activities. It is more transparent and allows for the viewing of all cash movements in detail.
The indirect method describes net income for the period and, thereafter, lists adjustments made to reconcile the two. It provides simplicity and alignment with accounting standards. While direct cash flow offers clarity and straightforwardness, its complexity and data availability challenges may deter some companies.
On the other hand, the indirect method is simpler to implement and widely accepted. Why? It meets regulatory requirements and provides consistency in financial reporting. Several factors determine the choice of the direct or indirect cash flow method. They include requirements for transparency, data availability, and adherence to accounting standards.
Despite the merits and drawbacks of any of the methods, the choice between direct/indirect flow is entirely yours. This depends on your specific goals and interests.
Direct vs Indirect Cash Fow Statement doesn’t matter, which alternative you choose. What matters is that the message delivered is consistent. By leveraging the strengths of each method, you can enhance your cash flow analysis. Moreover, you will improve transparency and meet regulatory requirements while optimizing your financial reporting practices.
Ultimately, whether direct or indirect, the goal remains the same. To provide stakeholders and potential investors with the ability to analyze a company’s cash flow dynamics. This, as a result, enables informed decision-making.
How much did you enjoy this article?


Calculate accounts receivable turnover ratio to measure credit collection speed, improve cash flow, and strengthen your financial strategy. Read on!

Change Management KPIs are the key to tracking adoption, performance, and ROI during transitions. Find out which metrics matter. Read on!

Data collection methods and techniques determine the quality of every insight you act on. Explore key approaches for gathering reliable data. Read on!


