Categories
By ChartExpo Content Team
Dimensionality reduction has become a cornerstone in the data visualization and analysis toolkit. Why? Because dealing with massive datasets isn’t just challenging—it’s a recipe for confusion. Dimensionality reduction transforms overwhelming data into something manageable, stripping away excess while preserving what matters. It’s like finding the clearest path in a maze; you lose nothing essential but gain clarity and insight.
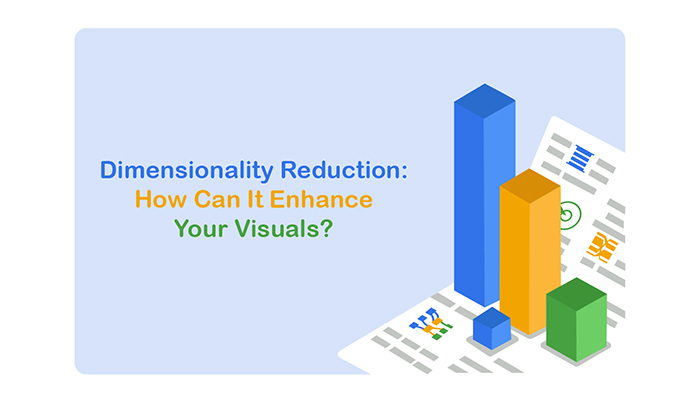


Think of it this way: dimensionality reduction acts like a decluttering expert for your data. Imagine packing for a trip—you wouldn’t take every item in your closet. Instead, you’d choose the essentials, ensuring you’re prepared without lugging around unnecessary baggage.
Similarly, this method eliminates redundant or irrelevant data variables, making complex datasets more compact and useful. You’re left with the heart of the information, ready to be explored and understood.
But it’s not just about making data smaller. Dimensionality reduction reveals trends, patterns, and anomalies hidden in the chaos. It’s the difference between staring at static and tuning into a clear signal.
By simplifying data into digestible pieces, it helps organizations make smarter decisions, faster. Whether in healthcare, finance, or marketing, this technique bridges the gap between complexity and action.
Ready to make your data work for you?
First…
Imagine you have information from surveys with hundreds of questions. Not all of these questions are crucial for your analysis. Dimensionality reduction helps by keeping the significant questions (or data points) and removing the redundant ones. This way, you’re left with a more manageable set of data that still represents the overall dataset well.
For example, if you’re trying to visualize customer preferences in a survey using a graph, plotting hundreds of questions would make the graph cluttered and hard to read. But if you use dimensionality reduction, you might identify that only 20 of these questions capture the main preferences.
You can then create a more effective visualization, like a Radar Chart, which will show these preferences clearly without the noise of the less important data.
This technique isn’t just about making data smaller or easier to handle; it’s about making the data you have work better for you, providing clearer insights and allowing for more effective data-driven strategies.
Think of it as distilling a wide-ranging set of books into a single, comprehensive encyclopedia that gives you all the information you need in a more accessible form.
By applying dimensionality reduction, businesses and researchers can enhance customer behavior analytics by uncovering hidden trends that might be overlooked in a vast sea of data. This approach helps identify the key factors influencing customer actions and even detect anomalies that could indicate fraudulent activities.
It’s a powerful method that not only simplifies data but also amplifies its value, making complex information accessible and actionable.
Think of a dataset as a vast field filled with different flowers. Each flower represents a feature or variable. Now, imagine trying to walk through this field but it’s so packed with flowers that you can’t see the path ahead.
Dimensionality reduction is like carefully picking which flowers to keep so you can see the path clearly without losing the essence of the beauty of the field.
In technical terms, datasets often have many variables, each adding a dimension to the data. Too many dimensions can lead to complexity, making data analysis cumbersome and sometimes less accurate—a phenomenon known as the “curse of dimensionality.”
Dimensionality reduction techniques simplify this by reducing the number of random variables under consideration, by obtaining a set of principal variables.
Let’s say you’re engaging in visual storytelling but have limited time to convey your message. You’d focus on the core plot and main characters while skipping side stories. Similarly, when reducing dimensions, it’s essential to retain the relationships that matter most. This involves keeping the variables that strongly impact the analysis and discarding those that don’t add significant value, ensuring a clear and impactful narrative.
For instance, in a dataset about car performance, aspects like engine power and weight might be crucial, while color might not influence performance and can be dropped.
Techniques like Principal Component Analysis (PCA) or t-distributed Stochastic Neighbor Embedding (t-SNE) come into play here. They help identify which variables hold the most information about the data set’s structure and which ones can be merged or eliminated without losing critical information.
Now, imagine trying to explain the solar system’s layout to a friend using just words. It gets easier when you pull up a visual diagram, right? That’s what we aim for in data visualization after dimensionality reduction. We take complex, high-dimensional data and translate it into a format that’s easier to understand and interpret visually.
This can be achieved using various visualization techniques. Scatter Plot chart is particularly useful here. They can show how different variables interact in a two-dimensional space, providing insights that are not immediately obvious in higher-dimensional views.
Another useful tool could be a Heatmap, which helps in visualizing complex data matrices, revealing patterns through color gradients.
Each visualization technique, from Scatter Plots to Heatmaps, serves the purpose of making abstract data tangible, helping us see the story that the data wants to tell.
By reducing dimensionality and choosing the right data visualization tools, we can turn a confusing array of numbers and categories into clear visuals that everyone can understand.
Imagine trying to make sense of a visual that’s bursting at the seams with data points. It’s like trying to read a map with thousands of landmarks marked on it!
High-dimensional data can lead to charts that are overwhelming, confusing, and just plain messy. This clutter makes it tough for anyone to draw meaningful insights at a glance.
By reducing the number of variables, dimensionality reduction techniques like PCA (Principal Component Analysis) or t-SNE (t-Distributed Stochastic Neighbor Embedding) transform a complex dataset into a simpler, more interpretable format.
Think of it as distilling the essence of the data. This not only cleans up the visuals but also highlights the most impactful trends and patterns, making them easier to understand and act upon.
For instance, a Heatmap can benefit immensely from dimensionality reduction. Originally crammed with numerous variables, it becomes a clear representation of the main data relationships after the reduction process. This clarity is crucial when you’re making decisions based on the visualized data.
Consider a healthcare analytics dataset with hundreds of variables on patient health metrics. A doctor doesn’t have the time to sift through all that raw data. Dimensionality reduction can simplify this by narrowing the focus to the most critical metrics, which can then be visualized in a Radar Chart. This approach quickly highlights areas needing attention, making complex data actionable and time-efficient.
In another scenario, a retail business with extensive customer data might use dimensionality reduction to better understand purchasing patterns. A Pareto chart could then clearly show which factors most significantly influence buying behavior, helping the business to prioritize its marketing strategies effectively.
By cutting through the noise and simplifying the data, dimensionality reduction not only saves time but also provides sharper insights, driving better decisions in various fields from healthcare to retail.
The following video will help you create a Radar Chart in Microsoft Excel.

The following video will help you to create a Radar Chart in Google Sheets.
Principal Component Analysis, or PCA, is all about variance. It’s a statistical technique that takes a complex dataset with many variables and simplifies it to a few principal components. These components represent the directions where the data varies the most.
Think of it as squishing a fluffy, multi-dimensional cloud of data into a flat pancake, where the biggest spread of the pancake points out the most significant features of the data. This method is fantastic for reducing the number of variables but keeping the story the data tells.
When applying PCA, it’s common to use a scatter plot to visualize these principal components. This type of chart helps to immediately spot where the data points cluster, highlighting variance in a visually intuitive manner.
t-SNE stands for t-Distributed Stochastic Neighbor Embedding. Quite a mouthful, right? This method is a champ at managing data that forms clusters in complex ways.
Unlike PCA, t-SNE is great at capturing the non-linear relationships between points. It’s like it can see the twists and turns in the data’s story, laying it out in a way that we can understand visually.
Imagine you’re trying to organize a bunch of curved, wiggly lines into a clear pattern—that’s what t-SNE does with your data. It reshapes the narrative of the data into clusters that make sense together but might not be obvious at first glance.
It’s particularly useful when you’re dealing with human behavior data, like shopping patterns or internet browsing habits, which don’t always follow straight lines. Visualizing t-SNE results often involves a heatmap or a scatter plot, where different colors can help distinguish between the clusters.
UMAP stands for Uniform Manifold Approximation and Projection. This technique is a relatively new kid on the block but is quickly becoming a go-to because of its speed and efficiency. UMAP works somewhat like t-SNE but is faster, which is great when you’re in a pinch and need results yesterday.
UMAP excels in maintaining the general structure of the data while also highlighting the local relationships within the data. It’s like having the ability to see both the forest and the trees at the same time.
This makes UMAP particularly useful for large datasets where you want a quick overview but also need to dive into specific groupings or clusters. For visualizing UMAP results, a good choice might be a sunburst chart, which can show hierarchical relationships and proportions in a compact, visually engaging way.
Imagine trying to understand your customers better but getting lost in a sea of data points. By reducing the number of variables, businesses can create a clearer picture of customer groups. This clarity is not just about seeing who buys what but about understanding customer behaviors and preferences on a granular level.
Employing techniques like PCA can transform complex datasets into simpler, insightful visuals such as scatter plots. These visuals are invaluable for customer segmentation, helping marketers identify distinct groups and tailor their strategies effectively.
Financial data can be overwhelming with its myriad of variables influencing market trends. Dimensionality reduction helps in distilling this vast information into digestible insights.
By focusing on principal components, financial analysts can spot underlying trends that are not apparent in raw data. A heatmap can be particularly useful here, as it highlights the intensity of relationships between different financial variables, making it easier to pinpoint areas requiring attention.
This method leverages predictive analytics to enhance the ability to make informed predictions and strategic decisions, thereby optimizing financial performance.
Operations involve complex processes with numerous data streams which can muddy decision-making. Dimensionality reduction clears up this confusion by stripping down unnecessary data dimensions. When operational data is concise, it’s easier to see what’s working and what’s not.
For instance, a Pareto Chart can illustrate which few operational issues are causing the most problems, helping managers to prioritize resources effectively. This not only speeds up problem-solving but also boosts overall operational agility and efficiency.
When you’re staring at a sea of data, knowing where to start can be overwhelming. The first step is to pinpoint the most relevant variables. Think of it as a treasure hunt. You’re not grabbing everything you see; you’re selectively looking for the jewels that shine brightest.
How do you do this? Start with correlation analysis. By identifying which variables move together, you can focus on those with the strongest relationships. This isn’t just about picking the low-hanging fruit; it’s about picking the right fruit.
Another effective strategy involves using a Pareto Chart. This helps in visualizing which factors are contributing the most to your results, allowing you to prioritize these variables for further analysis.
Next up, let’s talk about clearing out the clutter. Redundant features are like duplicate photos on your phone – they take up space without adding value. But how do you spot them?
One approach is through PCA. This technique transforms your high-dimensional data into a smaller set of variables. By focusing on components that explain the most variance, you remove redundancy effortlessly.
Another tool in your arsenal can be the use of a Heatmap. It visually represents the correlation between different variables. Features that show high correlation can often be considered redundant, giving you a clear hint on what to trim down.
Noise is like the static on your radio; it’s annoying and prevents you from hearing the music clearly. The goal here is to smooth out the static without losing the tune. One effective technique is feature scaling. By standardizing the range of your data features, you ensure that one feature’s noise doesn’t drown out the others.
Another reliable method is the use of a Scatter Plot. It allows you to visually inspect the distribution and relationship between two variables. Areas where data points are densely packed are likely signals, whereas sparse points might be noise. This visualization helps in identifying and focusing on areas of interest, reducing noise by concentrating on denser regions.
The art of dimensionality reduction lies in reducing the number of variables under consideration but still retaining the essence of the information. The goal? To simplify your data without stripping away valuable insights.
Imagine you’re using a Pareto Chart in your analysis. This tool can help you determine which variables hold the most weight and which ones can be reduced without significant loss of information.
Over-reducing can be a slippery slope. It might make your dataset neater, but you risk losing critical insights.
For example, if you overly simplify the data feeding into a Heatmap, you might miss out on subtle but important patterns that could inform better decision-making. Always question whether the simplicity of your visualization compromises the depth of your insights.
Validation is your safety net. Use techniques like cross-validation or splitting your data into training and test sets to see how your dimensionality reduction model performs on unseen data.
Applying a Scatter Plot to compare the original versus the reduced dataset can visually highlight if critical information was lost. This step is crucial in ensuring that your reductions are serving your analysis, not skewing it.
Before jumping into dimensionality reduction, it’s essential to grasp the structure of your dataset fully. What does this entail? Well, you’ll need to examine the types of variables you’re dealing with.
Are they continuous, categorical, or a mix of both?
Identifying outliers and missing values is another key step. This isn’t just busywork; it’s about ensuring that the data you’re working with is clean and ready for further analysis.
A neat trick here is to visualize the data using a heatmap or a scatter plot. These tools can give you a quick overview of relationships and distributions within your dataset, highlighting areas that might need more attention before moving forward.
Choosing the right dimensionality reduction method can feel like finding a needle in a haystack. But don’t worry, it’s not as daunting as it seems. First, consider your end goal. Are you aiming to simplify the data for better visualization, or is preserving the variance more critical?
For instance, if your main aim is to visualize the data effectively, methods like PCA or t-SNE can be particularly useful. These techniques help to reduce dimensions while maintaining the essence of the data.
On the other hand, if you’re dealing with a lot of categorical data, using a Mosaic Plot or a Crosstab Chart might provide clearer insights without the complexity of high-dimensional space.
Don’t put all your eggs in one basket! It’s wise to test multiple dimensionality reduction techniques to see which one best suits your data. Each method has its strengths and limitations, and what works for one dataset might not be the best fit for another.
How do you go about this? Start by applying a couple of different methods, such as PCA and a Clustered Bar Chart, to your dataset. Compare the results. Do the visualizations make sense? Do they reveal the trends and clusters you expected?
It’s a bit like conducting an experiment where your hypothesis is tested through different lenses. This approach not only ensures accuracy but also provides a deeper understanding of the underlying structures in your data.
Remember, the goal here is to make your data storytelling as clear and impactful as possible, ensuring that the results are not just numbers but insights that can drive decisions and strategies.
In today’s fast-paced world, businesses need to swiftly move from raw data to strategic actions. Dimensionality reduction steps in, transforming complex datasets into simpler, comprehensible formats.
Imagine a cluttered room full of various objects. Dimensionality reduction is akin to organizing this room so that only the most meaningful items are visible, making it easier to spot what you need at a glance.
For example, a Pareto Chart can highlight the most significant factors affecting a business process, allowing managers to focus their resources efficiently. This aids in bridging the gap, ensuring that the insights derived are not just numbers, but tools for smart decision-making.
Visuals created from reduced data packs a punch in decision-making scenarios. These visuals strip away the non-essential, highlighting trends and correlations that might go unnoticed in a full dataset.
Think of a Tree Map, which can depict various market segmentation and their performance metrics at a glance. This visualization encourages quick, informed decisions based on a clear understanding of comparative strengths and weaknesses across segments.
In strategic meetings, where time is of the essence, presenting a Heatmap can swiftly convey how different variables interact, such as customer behavior patterns across different regions. This immediate visual feedback allows teams to make quick pivots, capitalizing on the insights provided.
In the realm of Software as a Service (SaaS) and digital marketing, the stakes are high, and the data is plentiful. Here, dimensionality reduction not only simplifies data but also tailors it to specific KPIs crucial for SaaS data analytics, helping businesses make data-driven decisions more effectively.
For instance, a SaaS company might use a Funnel Chart to visualize customer conversion through different stages of the sales process. This chart clarifies where potential customers drop off, enabling marketers to fine-tune their strategies effectively.
Similarly, digital marketers might rely on a Crosstab Chart to cross-reference website traffic data against promotional campaigns. This can reveal the success rate of different campaigns across various demographics, guiding marketers on where to focus their efforts for maximum impact.
Dimensionality reduction can be a hefty task, especially when dealing with massive datasets. Techniques like t-SNE or PCA require significant computational power. This isn’t just about the time it takes to crunch numbers; it’s about the actual costs associated with higher computational demands.
Think about it—more processing power often means more money spent on better hardware or cloud services. Not to mention, these processes can be energy-intensive, contributing to higher operational costs.
When you simplify data through dimensionality reduction, you’re essentially trading some data fidelity for a clearer view. This might sound great at first, but there’s a catch. You could be losing some valuable insights along with the noise.
For instance, in a scatter plot, reducing dimensions might cluster distinct groups together, making it harder to identify subtle but important differences. It’s like trying to read a book where some of the pages are slightly blurred—you get the gist, but the nuances are lost.
So, how do we handle these hidden costs? One way is through more efficient algorithm choices tailored to specific needs. Not every dataset requires heavy artillery. Sometimes, a simpler model does the trick, saving time and resources.
Another strategy is optimizing the existing algorithms to run more efficiently on the available hardware. Think of it as tuning your car to get the best performance before deciding to buy a new one.
Also, leveraging techniques like data sampling or feature selection before applying dimensionality reduction can help minimize the load, making the process less resource-intensive.
When it comes to dimensionality reduction, it’s easy to get the wrong impression from simplified data. Reduced data lose some details that might be critical.
For instance, in a scatter plot used to display reduced dimensions, the closeness of points can be misleading. Two points might seem near because irrelevant variations are dropped, not because they’re genuinely similar in important ways. This is an example of misleading charts that can give incorrect interpretations if not properly analyzed.
A good practice is to always question what might have been lost in the reduction. Have key distinctions been dropped? If you’re using a heatmap to represent clusters after reduction, ensure the colors still meaningfully represent the data’s structure.
Don’t just take the visual output at face value; think about what it’s telling you and what it might be hiding.
Selecting the wrong method for dimensionality reduction can lead you far astray. Let’s say your goal is to preserve variance but you use a technique optimized for preserving distances, like MDS (Multidimensional Scaling). You’ll end up with results that might look good but don’t serve your purpose.
Before you pick a method, clearly define your goal. Are you reducing dimensions for visualization, or are you prepping data for another algorithm? If visualization is the goal, a method like PCA might be best as it preserves variance, showing how points spread out from each other.
If you’re looking to maintain neighborhood relations, consider t-SNE or UMAP. If you’re working with a clustered column chart, ensure the method aligns with what the chart is meant to depict.
Cross-checking the reliability of your dimensionality reduction results is a must. Don’t just trust the first output. Run the reduction multiple times with slightly tweaked parameters or even different subsets of your data. Do you get similar patterns? If yes, that’s a good sign.
Another way to check is by reversing the process. Can you somewhat reconstruct the original data from the reduced dimensions? If so, your reduction method likely preserves the necessary information.
Also, don’t forget sanity checks with simpler visualizations like a dot plot chart. If these simpler visuals contradict your complex ones, you might need to re-evaluate your approach.
Using these methods, you’ll be better equipped to navigate the pitfalls of dimensionality reduction and get the most out of your data visualizations. Always remember, checking and double-checking is the key to trustworthiness in your results.
Dimensionality reduction is important because it simplifies data, making analysis more efficient and accurate. High-dimensional data can be cluttered, hard to interpret, and even misleading due to a phenomenon called the “curse of dimensionality.” By reducing dimensions, you clean up this clutter and focus on the most valuable information. It speeds up processing times, improves visualization clarity, and enhances machine learning model performance. In short, it turns overwhelming data into actionable insights.
Dimensionality reduction works by identifying and removing variables that add little or no value to your analysis. Techniques like PCA find new combinations of variables that capture the most information with fewer dimensions. Others, like t-SNE, focus on maintaining relationships between data points while reducing the overall size of the dataset. The goal is to retain as much useful information as possible while stripping away the irrelevant details. This process makes it easier to visualize and understand the data’s core structure.
You should use dimensionality reduction when dealing with high-dimensional data that is difficult to visualize or analyze. It’s particularly helpful if your dataset has many redundant or irrelevant variables. This technique improves the performance of machine learning models, speeds up computations, and clarifies visualizations by removing clutter. Industries like healthcare, finance, and marketing benefit from dimensionality reduction to identify key trends and make data-driven decisions. If your charts look crowded or your analysis feels slow, it might be time to reduce some dimensions.
No, dimensionality reduction can be useful for both large and small datasets. While it’s most beneficial when dealing with high-dimensional data, even smaller datasets can contain redundant or irrelevant variables. Reducing these dimensions can improve visualization clarity and analytical accuracy, regardless of dataset size. Whether you’re working with 50 or 5,000 data points, dimensionality reduction helps focus your analysis on the most important information.
Dimensionality reduction takes the chaos of high-dimensional data and makes it manageable. It strips away the clutter, keeping only what you need to see the bigger picture. By reducing variables, you get clearer visuals and faster insights. Whether you’re analyzing customer behavior, financial trends, or operational efficiency, this method helps you focus on what matters most.
Think of it as clearing a foggy window. Once the haze is gone, the view is sharp, and the path forward is obvious. With techniques like PCA, t-SNE, and UMAP, you can make sense of complex data without drowning in it.
Simplified data means smarter decisions. It’s about making the invisible visible and turning confusion into clarity. Dimensionality reduction isn’t just a tool; it’s a bridge to understanding. Let it guide you to sharper insights and better outcomes.
Sometimes, less really is more.
How much did you enjoy this article?


Calculate accounts receivable turnover ratio to measure credit collection speed, improve cash flow, and strengthen your financial strategy. Read on!

Change Management KPIs are the key to tracking adoption, performance, and ROI during transitions. Find out which metrics matter. Read on!

Data collection methods and techniques determine the quality of every insight you act on. Explore key approaches for gathering reliable data. Read on!


