Categories
By ChartExpo Content Team
Data wrangling is like taming a wild beast. You’ve got piles of data from all directions, and none of it’s ready to use. It’s messy, unstructured, and downright frustrating. But without proper data wrangling, your business decisions are flying blind. You’re relying on half-baked insights from dirty data. That’s not just risky; it’s a recipe for disaster.


So, what’s the fix? Data wrangling. It’s the process of cleaning, organizing, and transforming raw data into a usable format. Think of it as giving your data a makeover. You take something chaotic and turn it into something valuable. And when done right, it’s a game-changer for your business. It lets you make decisions based on facts, not guesswork. You get clarity, accuracy, and, most importantly, actionable insights.
The benefits are huge. By investing time in data wrangling, you’re not just cleaning up your data – you’re setting the foundation for smarter, faster, and more efficient operations. Your reports become more reliable, your forecasts more accurate, and your strategies more targeted. In short, data wrangling turns potential into performance. It’s a must for any business serious about making data-driven decisions.
First…
Data wrangling is all about taking messy, raw data and turning it into something useful. Imagine you’ve got a pile of jumbled puzzle pieces. Data wrangling is the process of sorting those pieces, finding the edges, and putting them together to see the big picture. It’s the behind-the-scenes work that makes data ready for analysis.
Why should you care about data wrangling? Well, without it, your data is a chaotic mess. It’s like reading a book with all the pages out of order. Data wrangling brings structure to your data, making it possible to extract meaningful insights. Whether you’re a business trying to make data-driven decisions or a student working on a project, wrangling your data is the first step to getting reliable results.
Data wrangling is your shield against chaos. Imagine getting a huge pile of data, but it’s all over the place – like a puzzle with pieces that don’t quite fit. That’s what messy data is like. It’s incomplete, inconsistent, and downright frustrating.
Data wrangling is the process of getting messy data into shape for analysis and data visualization. It involves transforming disorganized information into a clean, structured format. Think of it as cleaning up after a wild party — everything is chaotic at first, but with some effort, it becomes organized and understandable.
Data wrangling and data munging often get tossed around like they’re the same thing, but they’re not. Data wrangling is the whole process of getting your data ready for analysis. It’s about organizing, cleaning, and transforming the data to make it usable.
Data munging is a part of that process – it’s the nitty-gritty work, like fixing errors or filling in missing data. So, while data wrangling is the big picture, data munging is more about the hands-on tasks that make your data usable.
In data science, data wrangling is like setting the stage before the main act. You can’t start analyzing data until it’s clean and organized. Data wrangling makes sure your data is accurate, complete, and ready to tell its story.
Whether you’re building models, creating visualizations, or running algorithms, data wrangling is the first step in making sure everything runs smoothly. It’s the foundation of any successful data project.
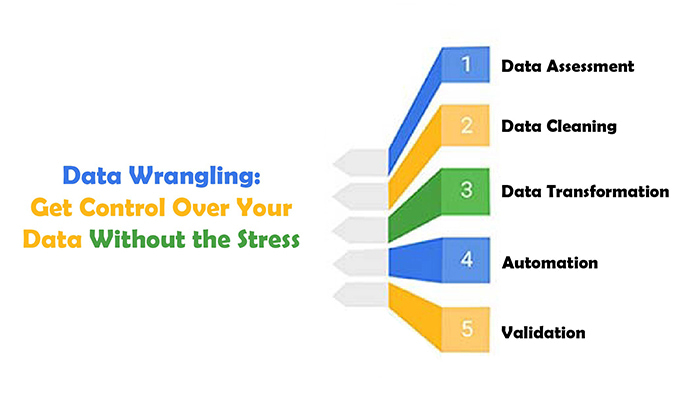
A typical data-wrangling workflow starts with understanding what you’ve got. First, you explore the data to see what’s there and what’s missing. Then comes the cleaning – removing duplicates, fixing errors, and filling in gaps. After that, you transform the data, maybe by combining columns or changing formats. Finally, you validate everything to make sure it’s all set for analysis. This workflow helps you turn a mountain of messy data into something you can work with.
When it comes to cleaning data, there are some go-to techniques. Start with filtering out the junk – irrelevant data that’s not going to help you. Next, look for inconsistencies, like typos or mismatched formats, and fix them.
You might also need to normalize the data, ensuring everything is on the same scale or format. Sometimes, you’ll have to handle missing data by either filling it in or removing it altogether. These techniques make sure your data is clean, consistent, and ready for action.
Handling large datasets is like trying to clean up after a big party. It can be overwhelming, but if you’ve got a system, it’s manageable. That’s what data wrangling is all about – turning chaos into order. But when you’re dealing with massive amounts of data, the stakes get higher. Every step needs to be tight and efficient.
The first step is understanding your data. You’ve got to know what you’re working with before you start wrangling it. Look at the structure, identify the key variables, and spot any obvious issues. Is there missing data? Are there inconsistencies? Get a grip on these basics before moving forward.
Next, it’s time to clean the data. This is where you get rid of anything that’s not useful – duplicate records, irrelevant data, or outliers that can mess up your analysis, including cohort analysis. But remember, cleaning is different from wrangling. Cleaning is about tidying up; wrangling is about getting data ready for analysis.
After cleaning, the transformation begins. This step is where you get your hands dirty. You’ll be reshaping, merging, and aggregating data to make it usable. The key here is to stay organized – label everything clearly, document what you’re doing, and keep your code or scripts as straightforward as possible.
Finally, it’s time to validate your results. Check your work to make sure everything looks right. Does the data make sense? Are the numbers adding up? If something seems off, it probably is, so don’t skip this step.
Data cleaning and data wrangling are often confused, but they’re not the same thing. Think of cleaning as the prep work. You’re washing the veggies, peeling the potatoes, and getting rid of anything that doesn’t belong in the dish. Wrangling is like cooking – taking those ingredients and turning them into something edible, or in this case, something analyzable.
In data cleaning, you’re focused on getting rid of errors, duplicates, and irrelevant data. It’s about making sure your data is accurate and consistent. Wrangling, on the other hand, involves reshaping and transforming the data to fit the needs of your data analysis.
You’re taking raw data and molding it into a format that’s ready for whatever you need to do next, whether it’s visualization, statistical analysis, or feeding it into a machine-learning model. Both processes are crucial for achieving data democratization, ensuring that accurate, well-structured data is accessible and usable across various teams and stakeholders in your organization.
When dealing with large datasets, both cleaning and wrangling are crucial steps. Cleaning ensures that your data is trustworthy – no errors, no duplicates, no junk. Without it, your analysis would be based on flawed data, leading to inaccurate results. Wrangling, however, is where you take that clean data and make it useful. It’s about getting everything in the right format, so it’s ready for whatever comes next.
For large datasets, the difference between cleaning and wrangling becomes even more pronounced. Cleaning might involve automated processes to handle the sheer volume of data while wrangling could require more sophisticated tools to transform and reshape the data efficiently.
When you’re dealing with a mountain of data, you need a solid plan. Here’s how to tackle the wrangling process:
When we talk about big data, we’re talking about datasets that are too large and complex for traditional data processing tools. Wrangling this kind of data requires a different approach.
To wrangle big data, you need scalable tools. Traditional spreadsheets aren’t going to cut it here. You’ll need to turn to tools like Apache Spark or Hadoop. These platforms are designed to handle massive amounts of data by distributing the processing across multiple machines.
Another key tool is SQL-based databases that can manage large datasets more efficiently than file-based systems. They allow you to perform complex queries and transformations at scale.
Machine learning algorithms can also be used to automate parts of the wrangling process, identifying patterns and making predictions about data transformations for effective trend analysis.
When working with big data, performance is critical. Slow processes can mean waiting hours or even days for results. To optimize your workflows, start by breaking down your tasks into smaller chunks. This approach, known as partitioning, allows you to process data in parallel, speeding up the overall time.
You should also look into caching intermediate results. By storing these results, you avoid having to reprocess the same data multiple times, saving valuable time.
Lastly, use efficient algorithms for data transformations. Some algorithms are better suited for large datasets, allowing you to process data faster without sacrificing accuracy.
These strategies will help you wrangle even the biggest datasets with efficiency and ease.


Ever tried to juggle too many things at once? Data wrangling is like that but for data. It’s the process of taking raw, messy data from different places and turning it into something that makes sense.
Imagine you have data coming from social media, your sales platform, and customer service logs. Each of these sources has its format, quirks, and gaps. Data wrangling is about getting all that data into a single, usable format.
It’s not magic; it’s a method. You clean up the data, fix inconsistencies, and structure it so that it’s ready for analysis. Data wrangling is like organizing your closet – once it’s done, you can easily find what you need.
ETL (Extract, Transform, Load) and data wrangling often get mixed up, but they play different roles. ETL is like a factory assembly line. You extract data, transform it to fit a certain mold, and then load it into a database. It’s a standard process, mostly automated, and follows a set path.
Data wrangling, on the other hand, is more hands-on. Think of it as customizing each piece that comes off the assembly line. Wrangling lets you dive into the details, adjust things on the fly, and make sure everything fits together perfectly, even if it’s coming from multiple sources.
Both are important, but data wrangling adds that extra layer of customization and flexibility. It’s what you do when you need to go beyond the standard ETL process.
When you’re pulling data from different sources, you’re bound to hit some bumps. Maybe one source uses dates in MM/DD/YYYY format, while another uses DD/MM/YYYY. Data wrangling smooths out these bumps. It’s the glue that holds multi-source integration together, making sure all the data speaks the same language.
Without data wrangling, you’d have a jumbled mess. But with it, you can bring all your data into harmony, ready for analysis.
Data munging is another way to say data wrangling, but it emphasizes the nitty-gritty work of transforming data. When integrating diverse datasets, munging helps break down the barriers between different data formats and structures. It’s about getting everything in line so that your data can work together seamlessly.
Whether you’re merging a customer database with social media metrics, incorporating YouTube analytics, or combining sales data from different regions, data munging makes the process smoother and more efficient.
Automation is a game-changer in data wrangling. Imagine doing all that data cleaning and transformation manually – it’d take forever. Automation tools help you handle repetitive tasks, like reformatting dates or standardizing text, saving you time and reducing errors.
With automation, you can set up workflows that do the heavy lifting for you. Once you’ve got your processes in place, your data wrangling becomes faster and more reliable, freeing you up to focus on the big picture.
Data wrangling is the secret sauce behind turning messy, unstructured data into something useful. Imagine you’re dealing with a mountain of text, images, or videos that make no sense in their raw form.
Data wrangling steps in, chops it up and reshapes it into structured formats. Think of it as organizing a chaotic garage into a tidy, functional space. You’ll go from chaos to clarity, making the data ready for analysis or other tasks.
Data wrangling for unstructured data is like taking a box of mismatched puzzle pieces and fitting them together. Unstructured data includes things like text documents, images, and videos that don’t fit neatly into rows and columns. Data wrangling takes this jumble and transforms it into something that can be easily used. It’s all about making the unstructured structured.
Let’s look at how this works in the real world. Imagine a company with tons of customer feedback in the form of emails, reviews, and social media posts. Data wrangling helps sift through this unstructured mess, categorizing sentiments, extracting key points, and turning all that noise into actionable insights.
Another example is medical imaging. Wrangling techniques help convert complex images into data that can be analyzed for patterns or abnormalities. These examples show how data wrangling makes sense out of chaos.
Data wrangling and data mining are like teammates on a project. Wrangling gets the data cleaned up and ready, while mining digs deep to find the valuable nuggets. Wrangling shapes and prepares the data, ensuring it’s structured and consistent. Mining then comes in to analyze and extract meaningful patterns. They work together to turn raw data into useful information.
Before you can mine data, you need to prep it. This is where wrangling shines. It involves cleaning up data, filling in gaps, and getting rid of inconsistencies.
For example, if you have customer data from various sources, wrangling merges it into a single, clean dataset. This process is like prepping ingredients before cooking – you’ve got to have everything in order before you start the main task. Once the data is wrangled, it’s ready for the deeper analysis that data mining provides.
Data wrangling can get messy fast. You’ve got mountains of data, and some of it needs serious reshaping. But instead of tackling the whole thing at once, think of it as a puzzle. Break it down into smaller, bite-sized pieces. Each transformation is a step in solving the puzzle. Start with the basics – cleaning, and filtering, then move on to more complex tasks like joining tables or reshaping data.
By tackling one piece at a time, you’ll find that the whole process becomes more manageable and less overwhelming.
When you’re facing complex transformations, modularity is your best friend. Break down the wrangling process into steps:
Taking these steps one at a time makes the process easier to follow and more efficient. You’re not just simplifying your work – you’re setting yourself up for success.
Repetition is the enemy of efficiency. If you find yourself doing the same steps repeatedly, it’s time to incorporate AI for data analytics. Automation with AI isn’t about taking shortcuts; it’s about ensuring consistency. AI-driven automation helps keep your process error-free and lightning-fast, freeing you up to focus on the more complex parts of the data-wrangling process.
Not all data-wrangling workflows are created equal. What works for one project might not work for another. The key is customization. Tailor your approach based on the project’s specific needs.
Maybe you need to handle a huge dataset, or perhaps you’re dealing with multiple data sources. Customize your tools, scripts, and methods to fit these needs. It’s all about flexibility – making sure that your wrangling process is as unique as the data you’re handling.
Data wrangling isn’t just about getting data into shape – it’s about making sure it’s top-notch from start to finish. If the data’s shaky, everything else falls apart. That’s why focusing on quality throughout the process is non-negotiable.
You wouldn’t build a house on a shaky foundation, right? The same goes for data. Embedding quality checks at every stage of data wrangling keeps things solid.
From the moment data is collected, you need to run checks. Whether it’s spotting duplicates, filling in gaps, or verifying sources, these checks need to be baked into your process. This way, quality isn’t an afterthought – it’s part of the DNA of your data.
Picture this: You’re cooking a stew, and you don’t taste it until the very end. Bad idea, right?
Continuous monitoring is like taste-testing your data at every stage. There are plenty of tools out there that can help you keep an eye on quality while you’re wrangling. They’ll catch issues in real time, so you can fix them before they snowball into bigger problems. Think of it as your quality safety net.
Let’s get practical. Imagine you’re working with customer data from multiple sources. It’s a mess – some names are misspelled, addresses are outdated, and purchase history is inconsistent. By running quality checks early, you can clean this up before analysis.
Tools like Python scripts or specialized software can automate these checks, making sure every piece of data is accurate and up-to-date. Real-world? You bet. Essential? Absolutely.
Ever played a game of telephone? If the message gets garbled, it’s game over. The same goes for data-wrangling projects. Clear communication among team members is key to keeping quality high.
Everyone needs to be on the same page, whether it’s about what data is being used, how it’s being cleaned, or even tracking progress using a Control chart in Excel. Regular check-ins, shared documentation, and open lines of communication keep everyone aligned. Teamwork isn’t just important—it’s the backbone of quality control.
Automation in data wrangling is your secret weapon for turning tedious tasks into quick wins. By automating repetitive steps, you can save time and reduce errors. Imagine your data cleaning process running smoothly in the background while you focus on more strategic work. Let’s break down how to do that.
Automation makes your life easier. It handles the boring stuff so you can do the fun parts. You’ll find that your workflow becomes smoother, and the chance of mistakes drops. Plus, automation is like having a helper that never gets tired – your data wrangling becomes faster and more reliable.
First things first, you need to figure out what’s dragging you down. Are there tasks you do over and over? Those are prime targets for automation. Think about data cleaning, merging datasets, or even running the same analysis repeatedly. If you’ve done it more than twice, it’s time to automate.
Now, let’s talk tools. There’s a bunch out there designed to take the grunt work out of data wrangling. Tools can automate complex tasks. Tools aren’t just fancy – they’re smart. They can handle the nitty-gritty details so you don’t have to.
Seeing is believing, right? Let’s look at how some big players have used automation to revolutionize their data wrangling.
The tech world never sits still, and neither should your automation strategy. Keep an eye on emerging tools and trends to ensure your automation stays ahead of the curve. Think of it as future-proofing your workflow – what works today might need a tweak tomorrow. Stay flexible, stay curious, and your automation efforts will keep paying off.
Without data wrangling, your data stays chaotic, making analysis difficult. Clean data leads to better insights, helping you make informed decisions.
It can be, especially with large or complex data sets. However, the time spent is worth it because wrangled data is much easier to analyze.
Challenges include dealing with missing data, inconsistencies, and different data formats. It requires attention to detail and a good understanding of the data.
Your data is ready when it’s clean, structured, and aligned with your analysis goals. It should be free of errors, well-organized, and easy to work with.
Skipping data wrangling means risking poor analysis results. Bad data leads to bad decisions. Wrangling ensures your data is trustworthy.
You need a mix of technical skills, like coding, and an understanding of the data you’re working with. Critical thinking and problem-solving are key.
It should be done whenever you acquire new data or when the data changes. Regular wrangling keeps your data in good shape for analysis.
Businesses use wrangled data to uncover insights, track performance, and make strategic decisions. It’s a crucial step in turning raw data into actionable intelligence.
You’ve come a long way on this data-wrangling journey. From messy, chaotic data sets to clean, actionable insights, you’ve turned the wild world of data into something manageable. It’s not been an easy path, but look at what you’ve achieved. With each step, each technique has added another tool to your belt, making you more skilled and confident.
Remember those early hurdles? The times when data seemed more like a puzzle than a resource? You’ve cracked that puzzle. You’ve taken raw, unstructured information and shaped it into something meaningful. That’s what mastery is all about – taking the chaos and making it work for you.
But here’s the best part: data wrangling isn’t a one-time thing. It’s a skill you’ll keep using, refining, and perfecting. The more you practice, the better you’ll get. Think of it as your superpower in the data-driven world. You’ve got the know-how to take any data set, no matter how wild, and make it useful.
So, keep wrangling. Keep improving. The journey doesn’t end here – it’s just the beginning. Every new data set is another opportunity to shine. You’ve got the skills, the tools, and the mindset. Now, go out there and show what you can do.
How much did you enjoy this article?


Calculate accounts receivable turnover ratio to measure credit collection speed, improve cash flow, and strengthen your financial strategy. Read on!

Change Management KPIs are the key to tracking adoption, performance, and ROI during transitions. Find out which metrics matter. Read on!

Data collection methods and techniques determine the quality of every insight you act on. Explore key approaches for gathering reliable data. Read on!


