• Home
  • Tools dropdown img
    • Spreadsheet Charts

      • ChartExpo for Google Sheets
      • ChartExpo for Microsoft Excel
    • Power BI Charts

      • Power BI Custom Visuals by ChartExpo
    • Word Cloud

  • Charts dropdown img
    • Chart Category

      • Bar Charts
      • Circle Graphs
      • Column Charts
      • Combo Charts
      • Comparison Charts
      • Line Graphs
      • PPC Charts
      • Sentiment Analysis Charts
      • Survey Charts
    • Chart Type

      • Box and Whisker Plot
      • Clustered Bar Chart
      • Clustered Column Chart
      • Comparison Bar Chart
      • Control Chart
      • CSAT Survey Bar Chart
      • CSAT Survey Chart
      • Dot Plot Chart
      • Double Bar Graph
      • Funnel Chart
      • Gauge Chart
      • Likert Scale Chart
      • Matrix Chart
      • Multi Axis Line Chart
      • Overlapping Bar Chart
      • Pareto Chart
      • Radar Chart
      • Radial Bar Chart
      • Sankey Diagram
      • Scatter Plot Chart
      • Slope Chart
      • Sunburst Chart
      • Tornado Chart
      • Waterfall Chart
      • Word Cloud
    • Google Sheets
      Microsoft Excel
  • Services
  • Pricing
  • Contact us
  • Blog
  • Support dropdown img
      • Gallery
      • Videos
      • Contact us
      • FAQs
      • Resources
    • Please feel free to contact us

      atsupport@chartexpo.com

Categories
All Data Visualizations Data Analytics Surveys
Add-ons/
  • Google Sheets
  • Microsoft Excel
  • Power BI
All Data Visualizations Data Analytics Surveys
Add-ons
  • Google Sheets
  • Microsoft Excel
  • Power BI

We use cookies

This website uses cookies to provide better user experience and user's session management.
By continuing visiting this website you consent the use of these cookies.

Ok

ChartExpo Survey


Home > Blog > Power BI

Power BI Date Format for Accurate Data Insights

Power BI is a powerful analytic tool. To get the most out of it, you need to pay attention to the date format. The right Power BI date format helps users to thoroughly display, interpret, and analyze their data sets. This helps in drawing insights and making informed decisions in the long run.

Power BI Date Format

In this guide, you’ll find the correct date format in Power BI, why you need to change the date format, and the most common Power BI date format.

Table of Contents:

  1. Understand Power BI Date Format
  2. Date Data Types in Power BI
  3. Date Formatting in Power BI
  4. Why it is Useful to Change the Date Format in Power BI?
  5. How to Change the Date Format in Power BI?
  6. How to Format Dates in Power BI Reports?
  7. How to Visualize Your Data Using Power BI?
  8. Wrap Up

First…

Understand Power BI Date Format

Definition: Dates within visuals and reports in Power BI can be displayed using a variety of date formats. A good grasp of these formats will boost your efficiency and effectiveness when working with Power BI. Here are some things you should keep in mind when formatting dates in Power BI.

Date Data Types in Power BI

  • Date: Using this method, the date is represented without the time component.
  • DateTime: In this model, the date is represented along with the time component.
  • DateTime zone: Using this model, the date and time are represented with the time zone information.
  • Time: Here, the time of the day is represented without the date.

Date Formatting in Power BI

Power BI enables users to customize how dates are showcased in their reports and visuals ”” it offers flexibility when it comes to date formatting.

Common date formats in Power BI

  • Date Only
    • yyyy/mm/dd (example: 2023/02/01)
    • mmm dd, yyyy (example: Feb 01, 2023)
    • dd-mmm-yyyy (example: 01-Feb-2023)
  • Date and Time
    • yyyy-mm-ddThh:mm:ss (example: 2023-02-01T12:30:50)
    • dd-mmm-yyyy hh:mm:ss (example: 01-Feb-2023 12:30:50)
  • Time Only
    • hh:mm AM/PM (example: 02:30 PM)
    • hh:mm:ss (example: 14:30:40)

Why is it Useful to Change the Date Format in Power BI?

Here are some reasons you should adjust the date formats in Power BI.

  1. Improved Interpretation and Readability:

Different date formats align with other regional standards and preferences. By changing the Power BI date format, you’ll ascertain that the dates are easily understandable and familiar to the audience. This will, in turn, improve the readability of the reports – and it also makes it easy for the user to analyze and interpret the data.

  1. Consistency Across Reports and Visuals:

Consistent Power BI date format, especially when using DAX format, throughout multiple reports helps in maintaining a professional appearance. It also aids in ascertaining uniformity across the visuals. If the date formats are the same across different tables and charts, the audience will easily understand that aspect of the data.

  1. Customization and Visual Appeal:

Customization of the date formats helps align the dates with the visual design of the report. Users are enabled to choose Power BI date formats that align with the aesthetics of the Power BI dashboards and reports. That will result in a polished and cohesive look.

  1. Facilitates Filtering and Sorting:

Adjusting the date formats can improve the filtering and sorting features of the Power BI. For instance, dates showcased as “dd-mmm-yyyy” (example: 01-Feb-2024) are typically sorted chronologically based on the date values. And that enables accurate analysis that is time-based. Proper formatting of the dates makes it easy for the user to apply date-based slicers and filters.

  1. Enhanced Data Analysis:

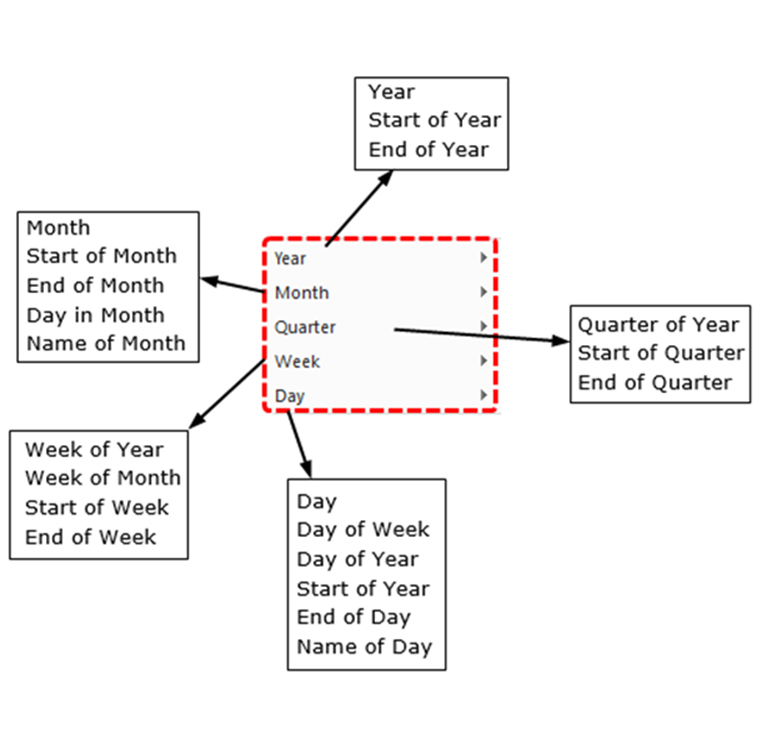
Opting for the right Power BI date format helps you perform a more robust data analysis. For instance, when different granularities are used in formatting dates (for example: month, quarter, year), it gives room for intuitive aggregation and grouping of time-based data. It also helps in analyzing trends and making comparisons between data sets.

How to Change the Date Format in Power BI?

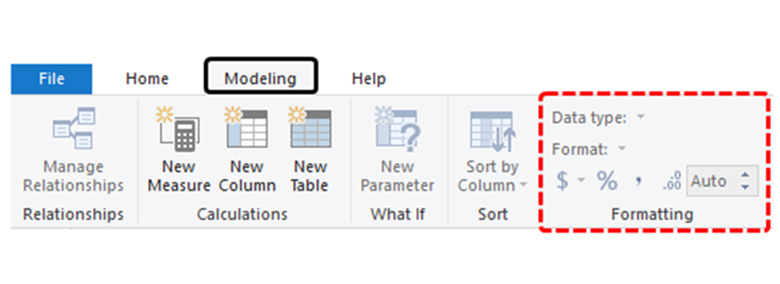
To change the Power BI date format, you’ll have to select your preferred date field in the visual. After that, navigate to the “Format” pane, and adjust the date format option found under “Format” or “Date category.”

Alternatively, DAX expressions can be used to create custom date formats.

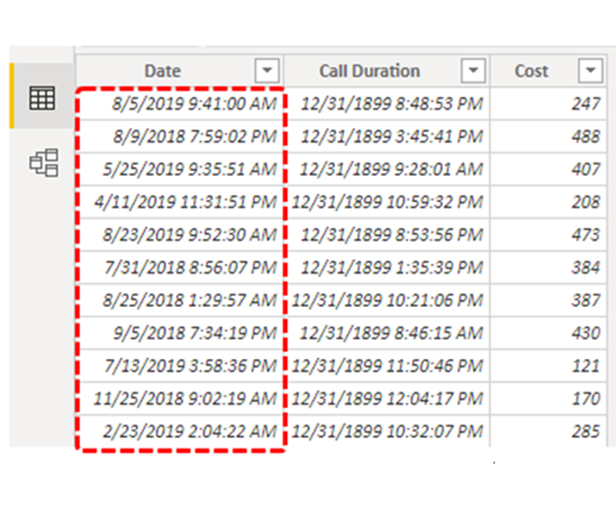
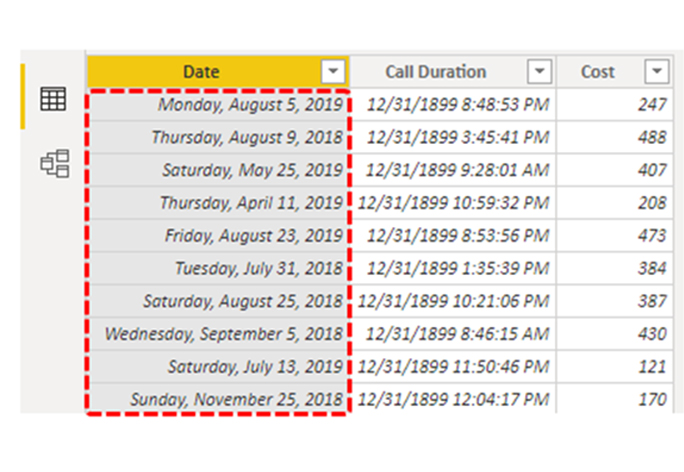
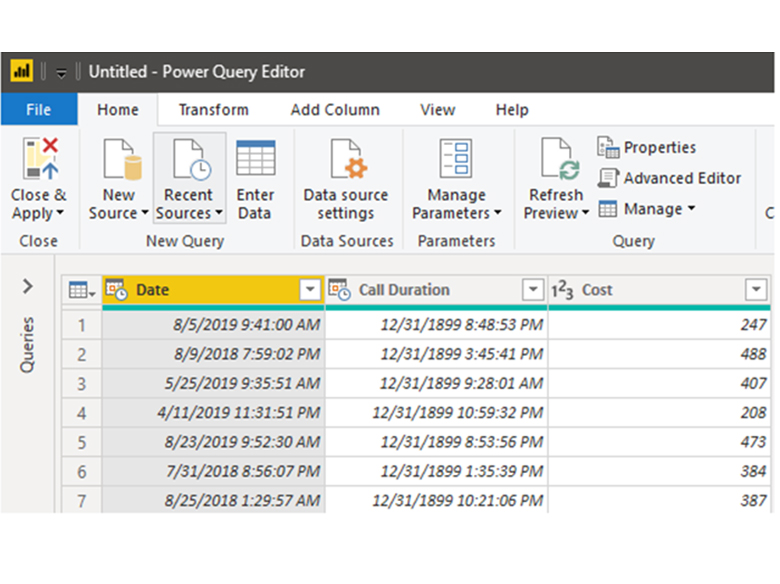
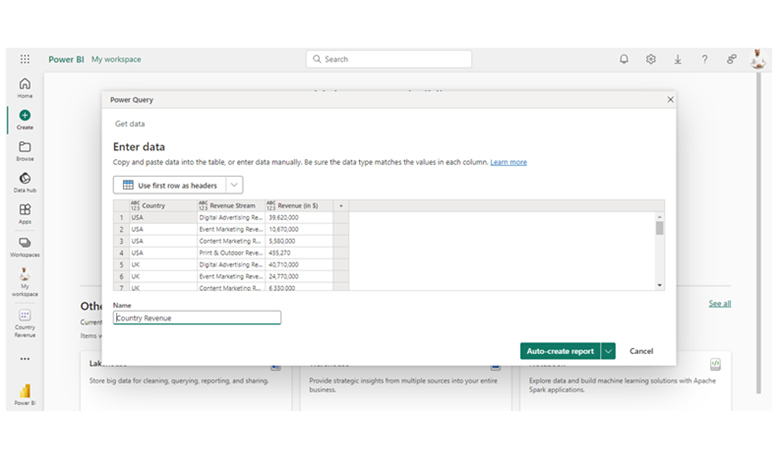
The data below will be used for this illustration.

Illustration Data for Changing Power BI Date Format

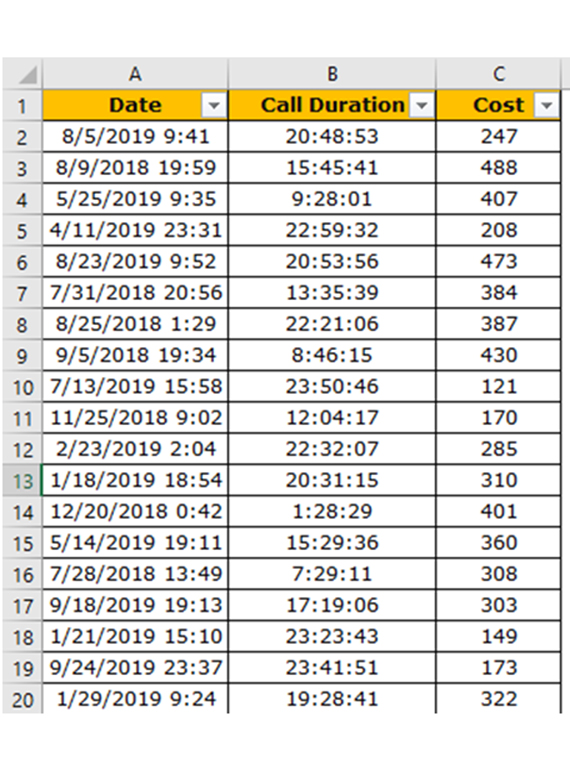
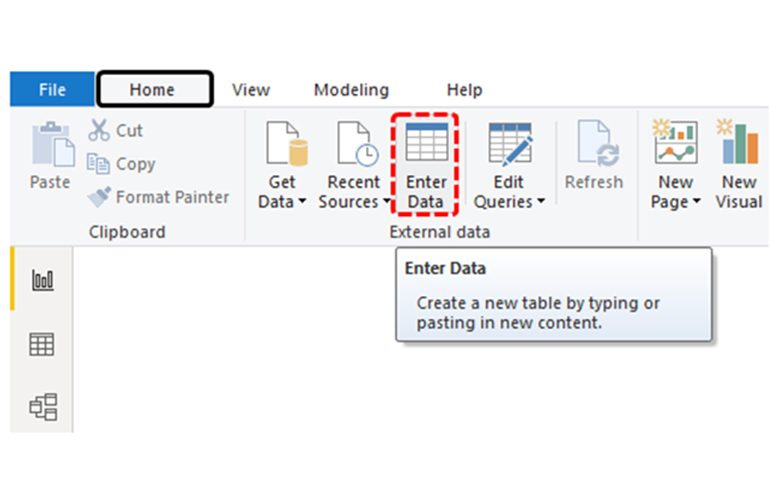
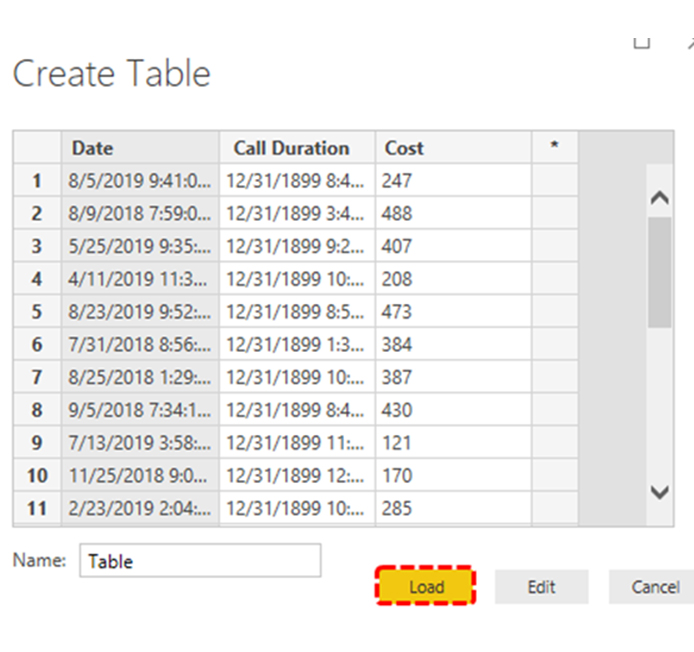
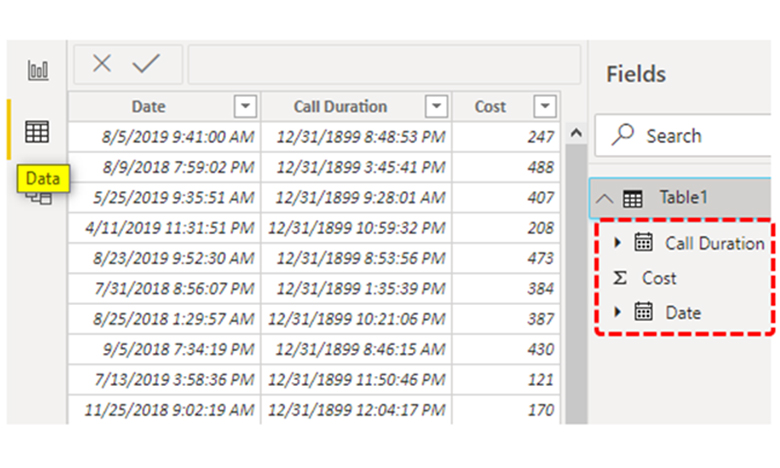
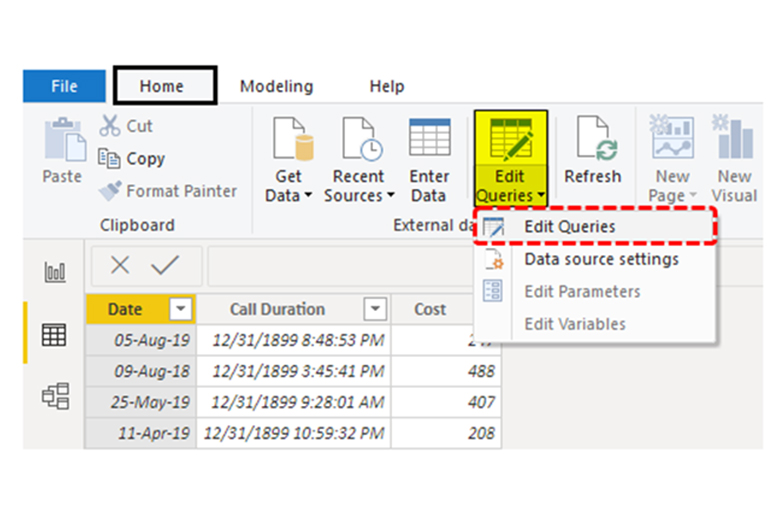
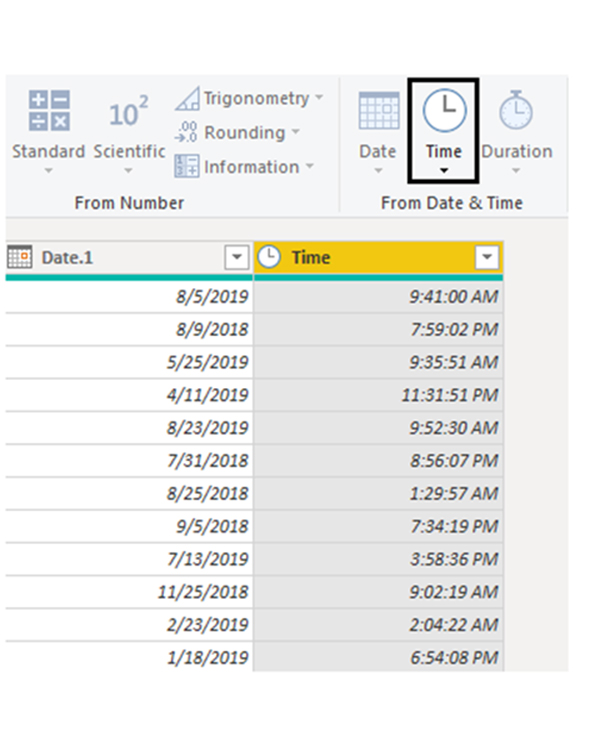
To upload the table above onto the Power BI, you’ll have to follow the steps below:

  • Open your Power BI file. From the “Home” tab, click on “Enter Data.”
Enter Data for Changing Power BI Date Format
  • Choose the first cell of the table and paste the table above.
Paste Table for Changing Power BI Date Format
  • Click on the “Load” option to upload the data onto the Power BI. The table can be found by navigating to the “Data’ tab of the Power BI.
Data Tab for Changing Power BI Date Format
  • From the image above, you’ll notice that the data format is “MM-DD-YYYY, HH:MM:SS.”
Changing Power BI Date Format

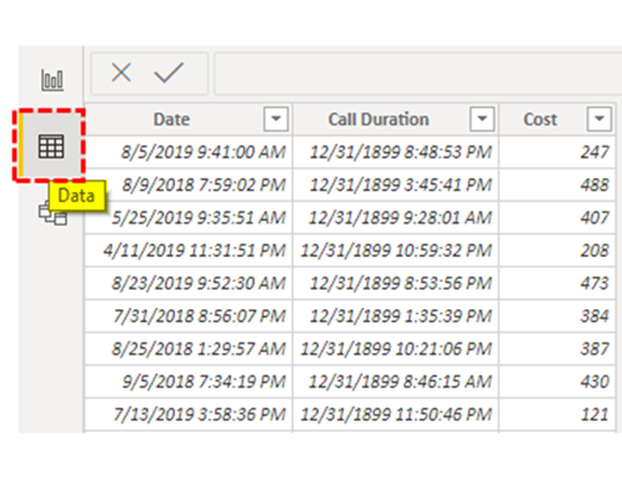
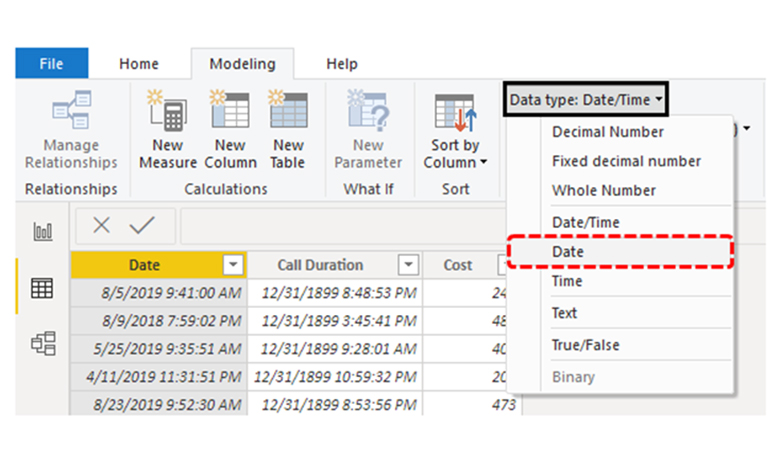
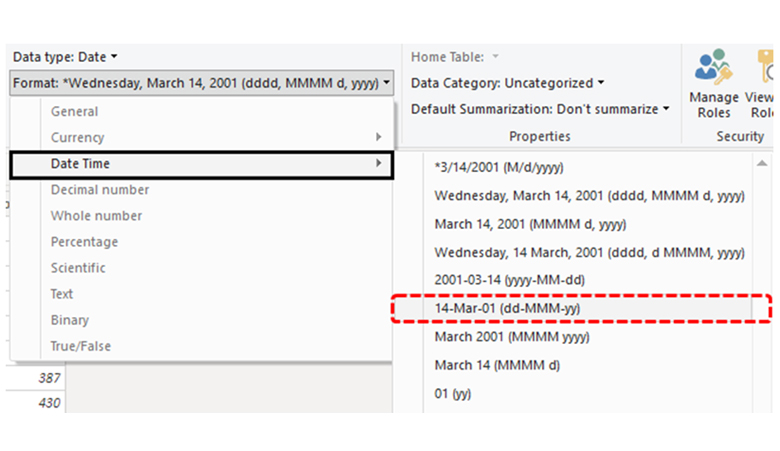
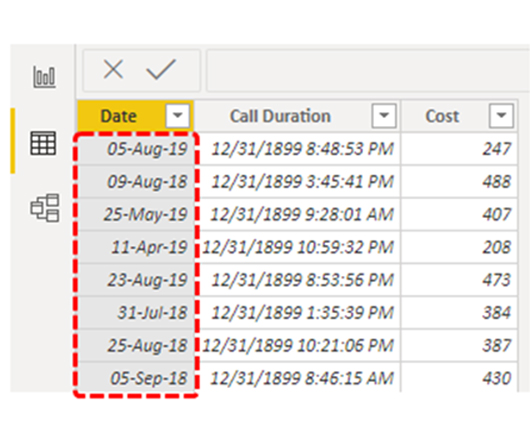
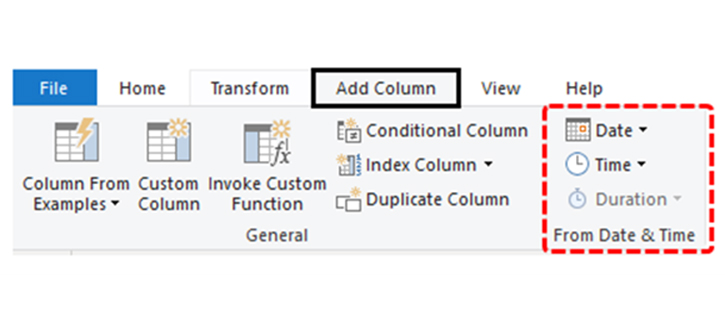
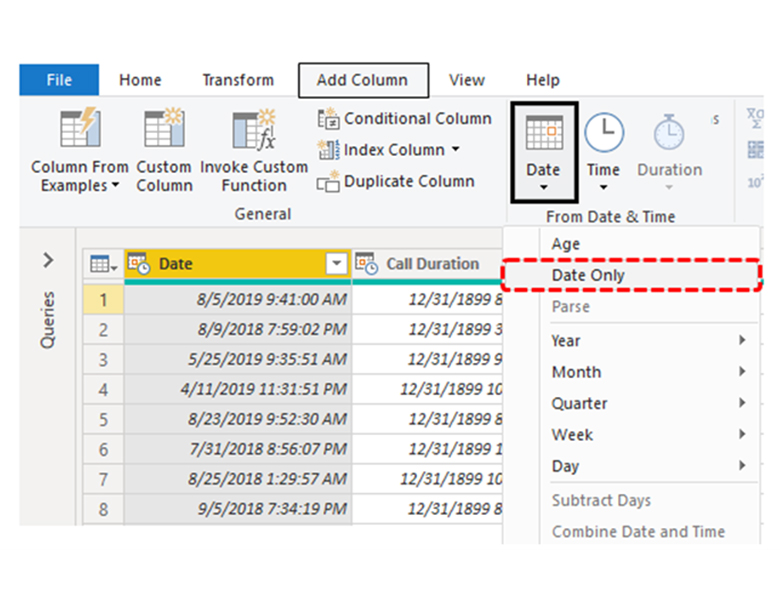
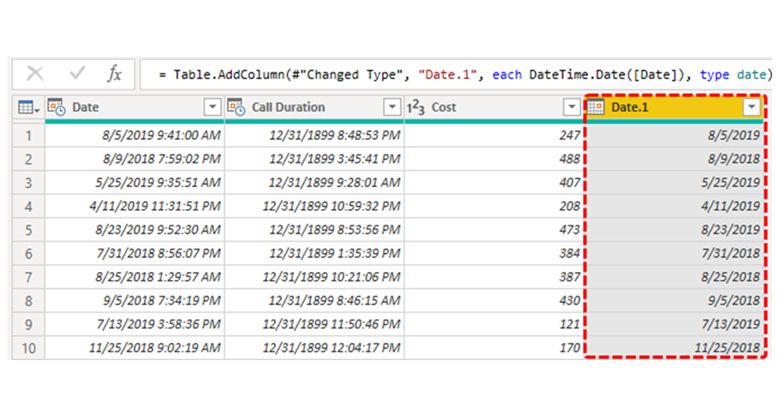
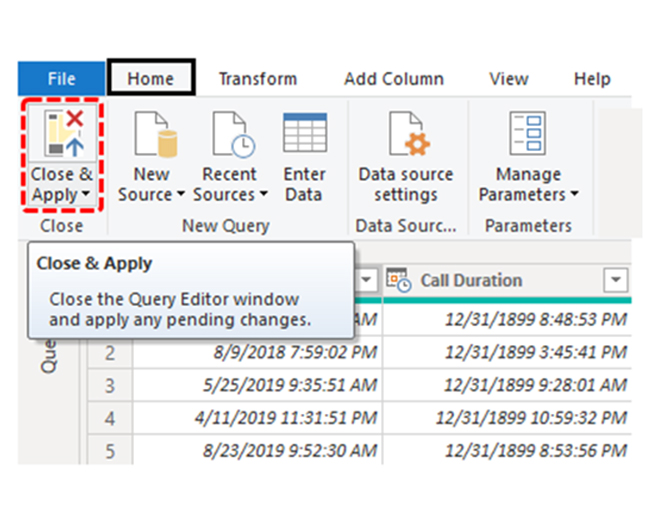
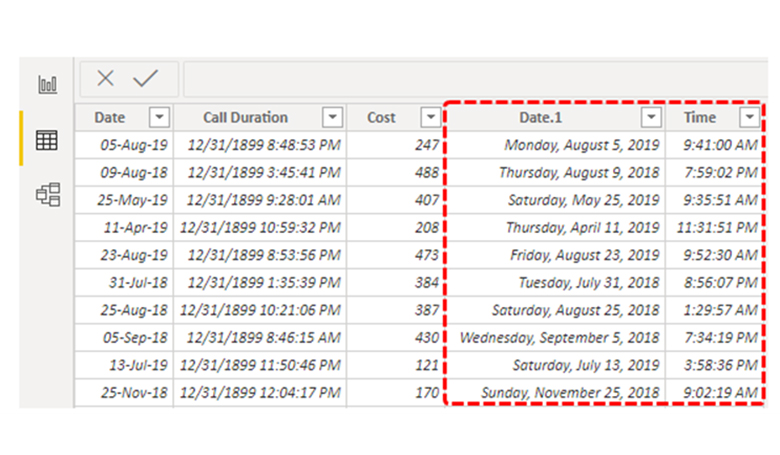
To change the data format, you’ll have to:

  • Navigate to the “Data” tab, and choose the table to view.
Choose Table for Changing Power BI Date Format
  • After that, navigate to the “Modeling” tab, and look out for the “Date” formatting section. It’s hidden under the “Modeling” tab.
Look for Date Formatting Section for Changing Power BI Date Format
  • To activate the section, choose the “Date” column. A close look at the section shows that it has the “Date Type”- and that represents the “Date/Time” format as it can be seen from the drop-down menu. Choose the “Date” option to change the format.
Date Type for Changing Power BI Date Format
  • After selecting the “Date” format, the setting will be applied automatically – and only the date will be displayed in the table.
Selecting Power BI Date Format
  • At the moment, you’ll see the full-day name, the full month, the date, and the year. It’s somewhat lengthy.
  • To change the current formatting to “DD-MM-YYYY,” click on the drop-down menu of the “Format” tab to see the list. From the list displayed, select “dd-mm-yyyy’ format.
Click Date Drop-Down for Changing Power BI Date Format
  • The format will be changed as seen below.
Final Changing Power BI Date Format
  • Let’s say you want the time, date, month, and day to be separated, you can do that by customizing the date format. The first step is to open the “Power Query” editor.
  • Navigate to the “Home” tab, and click on “Edit Queries.”
Edit Queries for Changing Power BI Date Format
  • This will open the “Power BI Query” editor.
Power BI Query for Changing Power BI Date Format
  • Select the “Add Column” in your Power Query Editor window. After that, a list of date formats will be displayed.
Add Column for Changing Power BI Date Format
  • Click on “Date,” and from the dropdown list, choose “Date Only.”
Select Date Only for Changing Power BI Date Format
  • You’ll notice that the data table has a “Date” column – and it’s comprised of only “date” values.
Select Date Column for Changing Power BI Date Format
  • There are also options for “Year,” “Month,” “Week,” “Day,” and “Quarter.” There are multiple options under each of these options. Here’s the list of these subcategories.
Select Subcategories for Changing Power BI Date Format
  • A new column will be added to the data table, but the old data column will not be replaced. Furthermore, you can extract the “Time Only” value onto the new column. You’ll have to use the “Time” option to do that.
Change Time for Changing Power BI Date Format
  • When you notice the changes, click on the “Close & Apply” option found beneath the “Home” tab.
Close and Apply for Changing Power BI Date Format
  • The data will be uploaded onto the Power BI file. The new column can be seen beneath the “Data” tab.
Column Added in Data Tab for Changing Power BI Date Format

How to Format Dates in Power BI Reports?

Using the appropriate Power BI date format helps you create clear reports and dashboards that your users will understand. You can get the most out of your Power BI date format by:

    • Use a consistent date format in all your visuals. This helps you avoid confusion.
    • Highlighting important dates on the report and dashboard.
    • Ascertaining that the dates are uniformly formatted across all the data sources.
  • Troubleshooting Power BI Custom Date Format Issues

Troubleshooting your Power BI for any date format issue is easy. First, you need to ascertain that the date formatting settings are correct. Next, you’ll have to verify that the date data is formatted the right way. Finally, fit for formatting issues with the data source. You also need to make sure that the data is consistent across multiple sources.

How to Visualize Your Data Using Power BI?

Stage 1: Logging in to Power BI

  • Log in to Power BI.
  • Enter your email address and click the “Submit” button.
Enter email to login to Power BI
  • You’ll be redirected to a Microsoft account. Enter the password and select the “Sign in” option.
Enter Password to login to Power BI
  • Choose to stay signed in.
Click on stay signed in
  • After that, the Power BI home screen will be displayed.

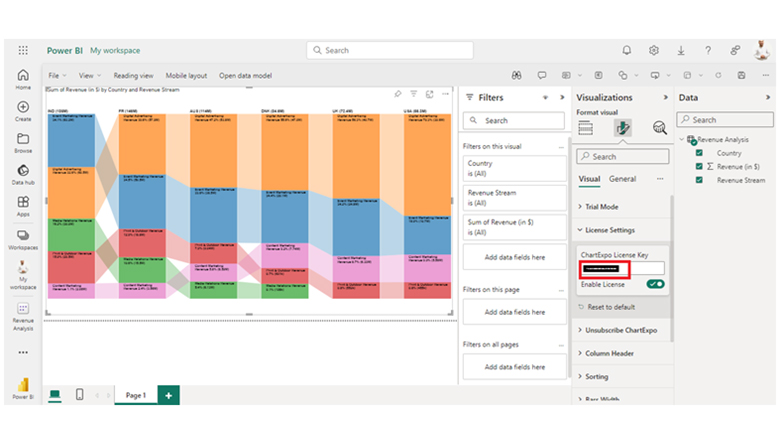
Stage 2: Create a Data Set and Select the Data Set to be used in the Sankey Chart.

  • On the left-side menu, click on the “Create” button.
  • Choose “Paste or manually enter data.”
select Paste or manually enter data in Power BI ce487
  • The sample data below will be used for this illustration.
Country Revenue Stream Revenue (in $)
USA Digital Advertising Revenue            39,620,000
USA Event Marketing Revenue            10,670,000
USA Content Marketing Revenue               5,580,000
USA Print & Outdoor Revenue                  455,270
UK Digital Advertising Revenue            40,710,000
UK Event Marketing Revenue            24,770,000
UK Content Marketing Revenue               6,330,000
UK Print & Outdoor Revenue                  552,190
DNK Digital Advertising Revenue            47,040,000
DNK Event Marketing Revenue            29,070,000
DNK Content Marketing Revenue               7,740,000
DNK Print & Outdoor Revenue                  600,690
DNK Media Relations Revenue                  106,430
AUS Digital Advertising Revenue            53,790,000
AUS Event Marketing Revenue            38,530,000
AUS Content Marketing Revenue               6,590,000
AUS Print & Outdoor Revenue               9,040,000
AUS Media Relations Revenue               6,130,000
FR Digital Advertising Revenue            57,860,000
FR Event Marketing Revenue            50,450,000
FR Content Marketing Revenue               3,560,000
FR Print & Outdoor Revenue            18,790,000
FR Media Relations Revenue            15,460,000
IND Digital Advertising Revenue            60,470,000
IND Event Marketing Revenue            63,200,000
IND Content Marketing Revenue               2,080,000
IND Print & Outdoor Revenue            29,500,000
IND Media Relations Revenue            30,020,000
  • Paste the data table above onto the “Power Query” window. At this point, you’ll have to click on the “Create a dataset only” option.
Create A Dataset Only of Power BI Date Format
  • Navigate to the left-side menu and click on the “Data Hub’ icon. The Power BI tool will populate your data set list. In cases where you’ve not created your data set, you’ll get an error message. Next, select the “Create report” button.
Create Report After Changing Power BI Date Format
  • After that, click “Expand All” to see the chart metrics. Also, check the dimensions and metrics.
Expand All After Changing Power BI Date Format
  • Click on the “Get more visuals” option. You can also search for ChartExpo. After that, choose the Comparison Bar Chart.
Get More Visuals After Changing Power BI Date Format
  • Click on “Add.”
Click Add Button After Changing Power BI Date Format
  • The Comparison Bar Chart will be displayed in the visuals list.
Comparison Bar Chart Icon After Changing Power BI Date Format
  • Click on the License Settings to add the key. After that, the comparison bar chart will be displayed.
Click License Key After Changing Power BI Date Format
  • The Comparison Bar Chart in Power BI will look like the image below.
Final Power BI Date Format

Insights

  • The largest total revenue is generated by India, followed by France, Australia, and Denmark.
  • “Event Marketing” is the leading revenue contributor in India, while “Digital Advertising” tends to take the lead in other countries.
  • There are no “Media Relations” revenue streams in countries like the UK and the US.

FAQs

What is the date format for the BI report?

Power BI date formats include yyyy/mm/dd (example: 2023/01/01), dd-mmm-yyyy (example: 01-Jan-2023), mmm dd, yyyy (example: Jan 01, 2024), or other customizable formats.

How do you specify the date in Power BI?

You can do that by using the date column from the data source. The date columns are recognized and treated like date data – and that enables data-based visualizations and calculations.

How do I fix the date format error in Power BI?

You have to make sure that the date column in the data source is correctly formatted. If you want to adjust your display format, use the “Format” pane option.

Wrap Up

Using the right Power BI date format helps make your work clear and consistent. It helps your audience to easily analyze and understand your data. By changing the date formats, you can align the data with the reporting requirements and regional preferences.

The appropriate date formats can improve readability, and simplify the process that goes into data interpretation.

Being proficient with the use of Power BI is the first step towards creating compelling visuals. Being able to change Power BI date formats is a vital piece that helps in the creation of a visually appealing presentation. The right date formats offer extra context or emphasis to the data presentation – and that comes in handy during certain visualizations and analyses.

Now you know how to change Power BI date formats, what is your most preferred date format in Power BI?

How much did you enjoy this article?

PBIAd1
Start Free Trial!
136085

Related articles

next previous
Power BI12 min read

Power BI Group By Guide for Effective Data Insights

Learn how Power BI Group By helps you aggregate data, clarify trends, and create reports by grouping values to make large datasets manageable & insightful.

Power BI12 min read

How to Create Sankey Diagram in Microsoft Power BI?

Learn How to Create Sankey Diagram in Microsoft Power BI using Desktop & Web Service. What they are and how to use them effectively.

Power BI8 min read

Power BI Artificial Intelligence: Insights Using Visuals

Discover all there is to know about the Power BI artificial intelligence. You'll also discover how AI is used in Power BI, and how to use it for analysis and more.

Power BI9 min read

Budgeting in Healthcare: Use Visuals to Spot Budget Gaps

This guide helps you discover what budgeting in healthcare is. You'll also discover the factors that affect hospital budgets and types of budgeting in healthcare.

Power BI9 min read

Predictive Analytics in Power BI for Making Insightful Visuals

This guide shows you everything you need to know about Predictive Analytics in Power BI. It also shows you how it works, and how to interpret the results.

ChartExpo logo

Turn Data into Visual
Stories

CHARTEXPO

  • Home
  • Gallery
  • Videos
  • Services
  • Pricing
  • Contact us
  • FAQs
  • Privacy policy
  • Terms of Service
  • Sitemap

TOOLS

  • ChartExpo for Google Sheets
  • ChartExpo for Microsoft Excel
  • Power BI Custom Visuals by ChartExpo
  • Word Cloud

CATEGORIES

  • Bar Charts
  • Circle Graphs
  • Column Charts
  • Combo Charts
  • Comparison Charts
  • Line Graphs
  • PPC Charts
  • Sentiment Analysis Charts
  • Survey Charts

TOP CHARTS

  • Sankey Diagram
  • Likert Scale Chart
  • Comparison Bar Chart
  • Pareto Chart
  • Funnel Chart
  • Gauge Chart
  • Radar Chart
  • Radial Bar Chart
  • Sunburst Chart
  • see more
  • Scatter Plot Chart
  • CSAT Survey Bar Chart
  • CSAT Survey Chart
  • Dot Plot Chart
  • Double Bar Graph
  • Matrix Chart
  • Multi Axis Line Chart
  • Overlapping Bar Chart
  • Control Chart
  • Slope Chart
  • Clustered Bar Chart
  • Clustered Column Chart
  • Box and Whisker Plot
  • Tornado Chart
  • Waterfall Chart
  • Word Cloud
  • see less

RESOURCES

  • Blog
  • Resources
  • YouTube
SIGN UP FOR UPDATES

We wouldn't dream of spamming you or selling your info.

© 2025 ChartExpo, all rights reserved.