Categories
These aren’t just boring numbers or confusing charts and graphs. They’re crucial tools that distinguish between a thriving business and one struggling to survive.
Who fuels your business?


Customers, right?
It makes sense to keep your customers satisfied.
This is where customer service metrics come in. They help you understand what’s working, what’s not, and where you need to tweak things.
It’s like having a magical compass that points you directly toward success.
Here, we will explore the art of analyzing customer service measures. You’ll learn to track and analyze customer service metrics to predict your business’s success and revenue growth.
That’s not all – You’ll also learn how to sprinkle some magic words during customer service conversations. This will surely leave your customers feeling like they just won the lottery.
And for those who think customer service training is just an expense, think again. It’s the secret sauce to retaining customers and enhancing your brand image.
Let’s get cracking and turn those complaints into compliments.
Definition: Customer service is all about crafting a pleasant encounter for the customer. It’s more than just completing a transaction; it’s about making an impression that will last. It is a blend of empathy, communication, and problem-solving that aims to exceed expectations and build long-lasting relationships.
Definition: Customer service metrics are the statistical measures that can help you gauge the quality and efficiency of your customer service.
Think of the metrics as a health check-up but for your customer service department.
They’re performance indicators showing you how well you support your customers.
These are the questions that customer service metrics can help you to answer.
Some of the tested and proven metrics include:
In short, customer service metrics are your eyes and ears in customer experiences.
This is because they provide invaluable insights that can guide your efforts to improve your service, retain customers, and ultimately, grow your business.
Customer service metrics can shed light on the following:
Below’s a look at the top 10 Metrics and KPIs for customer service.
Let’s dive in.
CSAT is a popular key performance indicator to gauge client satisfaction.
To measure it: Check out the formula:
(Number of satisfied customers [those who responded with 4s and 5s] / Total number of survey responses) x 100 to find the percentage of content customers.
Helpful hint: Assess consumer satisfaction following each interaction with a customer service representative.
Over time, these ratings can provide a clear picture of how individual agents or teams are performing.

The Customer Effort Score quantifies the effort a customer needs to put in to resolve an issue, fulfill a request, make/return a purchase, etc.
How to measure it: Use surveys to ask customers numerical questions. And then average the scores.
Check out an example of a question to ask, “On a scale of 1-7, how much effort did it take to get your question answered?”
Average the responses to get a CES score.
Tip: Customer Effort Score (CES) is one-dimensional. To get a fuller picture, blend this information with other metrics on this list.

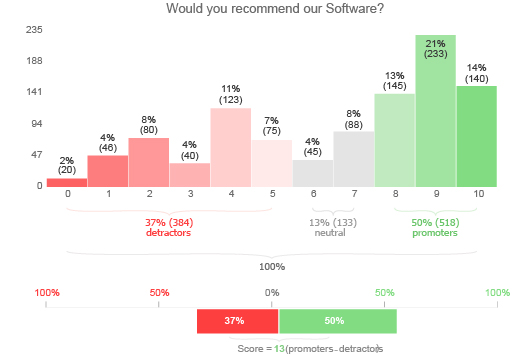
Use Net Promoter Score in customer experience programs.
You can get NPS scores via a single-question survey and reported as a number from 0-100, the higher, the better.
Respondents are categorized into:
They provide a comprehensive view of loyalty.
How to measure it: Subtract the percentage of detractors from the percentage of promoters.
Ideally, you want your NPS score to be as close to 100 as possible.
Tip: Just like Consumer Satisfaction, NPS measures customer loyalty.
Many customers express praise and complaints on social media.
However, only a few brands actively respond, leading to a one-sided experience.
How to measure it: Regularly collect and analyze data from each social media platform. This will help you gain insights into market sentiments.
Tip: Collaborate with your social media team to develop a robust social media data storytelling strategy.
The customer service metric tracks customers discontinuing your products or services.
Measuring this metric is complex. There’s no single predictor of churn.
How to measure it: Identify potential reasons for churn and track them over time.
Tip: By analyzing your data, you can gain predictive insights into the churn.
Forrester’s research shows that 77% of consumers appreciate quick responses.
This means tracking the first response time ensures swift resolution of customer queries.
How to calculate it: Subtract the time of the customer request from the time of the first response.
Tip: Plan a framework for your team to respond quickly and timely.
This customer service metric indicates the effectiveness of your customer support team.
If issues are left unresolved, customers may hesitate to remain loyal.
How to calculate it: Divide the total number of tickets by the number of tickets solved.
Tip: Analyze frequent questions, queries, suggestions, or complaints and create a FAQ.
Customers prefer having their issues resolved at the first point of contact.
This means it is not wise to pass them around between agents. The first contact resolution rate metric quantifies the cases resolved in a single customer contact.
How to calculate it: Determine the (number of issues resolved on first contact / total number of issues).
Tip: Measure the average number of replies required for issue resolution. Also, track the time it takes from ticket submission to resolution.
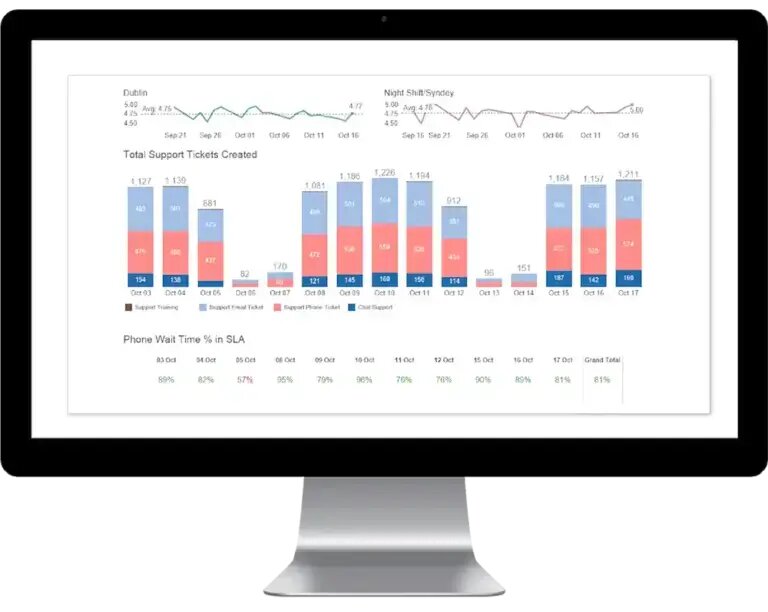
High customer interaction and an accessible ticketing system are good signs.
However, an excessive number of requests could indicate a problem. Monitoring this operational metric can help you spot potential issues early.
How to calculate it: Compare the volume of support tickets on a fixed timeframe, like weekly or monthly.
Pay special attention to spikes following a new product release. Tip: If ticket volume overwhelms, add more customer support agents or updated self-help resources.
This metric measures an agent’s time on a single case.
Shorter times indicate greater team efficiency. However, focusing solely on this metric may compromise quality customer service. How to calculate it: Aim for a shorter handling time to enhance productivity.
Use a time-tracking system to record time spent per ticket. Also, review the average time over a week and a month. Compare it with previous data to identify long-term trends.
Tip: Avoid overlooking instances of agents being tied up on long calls. These could point to underlying issues needing improvement in the customer experience or process optimization.
Measuring customer service performance is an undisputed game-changer for your business. These methods will help you gauge customer satisfaction levels and improve their overall experience.
Data is an intricate resource that holds immense value and cannot be overlooked. Although Excel is an excellent tool for data organization, it falls short in data visualization. Fortunately, with ChartExpo, you can elevate your Excel charts and graphs to new heights.
ChartExpo transforms your data into appealing, insightful visualizations that effortlessly enable you to glean insights.
How to Install ChartExpo in Excel?
ChartExpo charts are available both in Google Sheets and Microsoft Excel. Please use the following CTA’s to install the tool of your choice and create beautiful visualizations in a few clicks in your favorite tool.


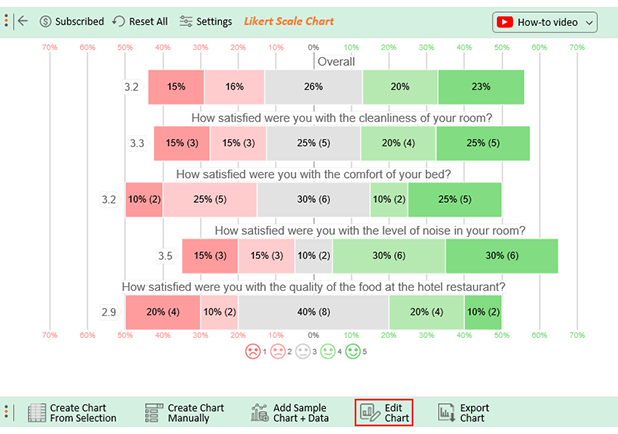
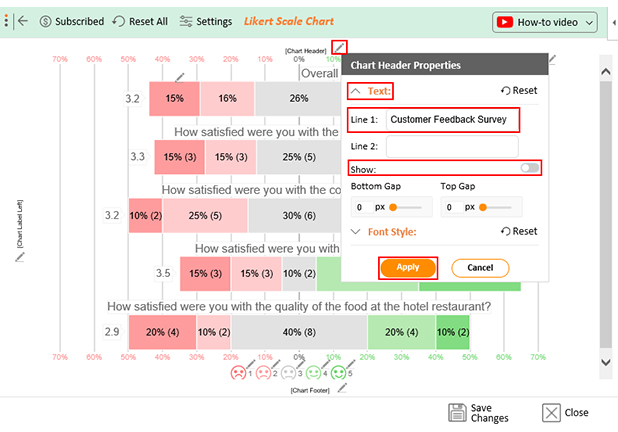
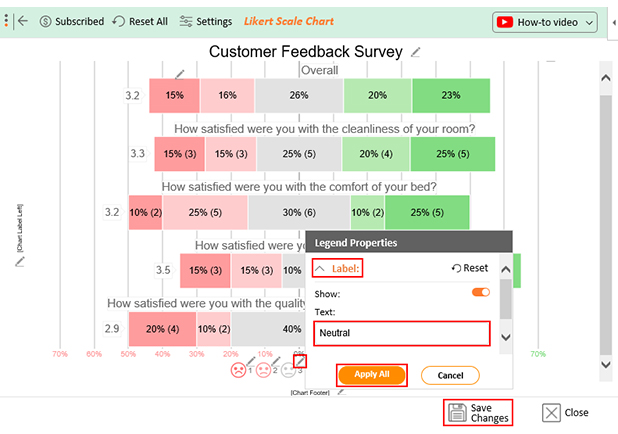
Assume the customer service feedback survey data has been organized into a table format, as shown below.
| Timestamp | How satisfied were you with the cleanliness of your room? | How satisfied were you with the comfort of your bed? | How satisfied were you with the level of noise in your room? | How satisfied were you with the quality of the food at the hotel restaurant? |
| 10-13-2023 17:47:33 | Extremely Satisfied | Dissatisfied | Neutral | Satisfied |
| 10-13-2023 17:47:33 | Extremely Satisfied | Neutral | Extremely Satisfied | Neutral |
| 10-13-2023 17:47:33 | Neutral | Neutral | Extremely Dissatisfied | Extremely Satisfied |
| 10-13-2023 17:47:33 | Satisfied | Extremely Dissatisfied | Dissatisfied | Neutral |
| 10-13-2023 17:47:33 | Extremely Satisfied | Dissatisfied | Satisfied | Extremely Dissatisfied |
| 10-13-2023 17:47:33 | Satisfied | Dissatisfied | Satisfied | Neutral |
| 10-13-2023 17:47:33 | Extremely Dissatisfied | Neutral | Extremely Satisfied | Satisfied |
| 10-13-2023 17:47:33 | Neutral | Satisfied | Neutral | Neutral |
| 10-13-2023 17:47:33 | Extremely Dissatisfied | Extremely Satisfied | Extremely Satisfied | Satisfied |
| 10-13-2023 17:47:33 | Extremely Satisfied | Extremely Dissatisfied | Satisfied | Neutral |
| 10-13-2023 17:47:33 | Dissatisfied | Neutral | Extremely Satisfied | Extremely Dissatisfied |
| 10-13-2023 17:47:34 | Neutral | Neutral | Extremely Dissatisfied | Neutral |
| 10-13-2023 17:47:35 | Dissatisfied | Neutral | Extremely Satisfied | Dissatisfied |
| 10-13-2023 17:47:36 | Neutral | Extremely Satisfied | Satisfied | Extremely Dissatisfied |
| 10-13-2023 17:47:37 | Neutral | Extremely Satisfied | Dissatisfied | Extremely Satisfied |
| 10-13-2023 17:47:38 | Extremely Dissatisfied | Extremely Satisfied | Dissatisfied | Neutral |
| 10-13-2023 17:47:39 | Extremely Satisfied | Satisfied | Extremely Dissatisfied | Extremely Dissatisfied |
| 10-13-2023 17:47:40 | Dissatisfied | Dissatisfied | Satisfied | Neutral |
| 10-13-2023 17:47:41 | Satisfied | Dissatisfied | Extremely Satisfied | Dissatisfied |
| 10-13-2023 17:47:42 | Satisfied | Extremely Satisfied | Satisfied | Satisfied |
This table contains example data. Expect many responses and questions in real life.


Start by identifying key metrics that align with your goals, such as response time, customer satisfaction (CSAT), or first call resolution (FCR). Regularly monitor these metrics to track performance and spot trends.
Analyze the data to identify areas where service can be enhanced, such as reducing wait times or improving agent training. Leverage self-service analytics to gain deeper insights from these metrics, enabling you to make informed decisions, optimize processes, and implement strategies that lead to better customer experiences. This approach ultimately drives customer loyalty and business growth.
Methods of measuring customer service include the following;
The key performance measure for customer service can vary depending on the organization. However, common indicators include average response time, first contact resolution rate, customer retention rate, and customer effort score. These metrics help assess the effectiveness and efficiency of customer service operations.
Analyzing customer service measures is crucial for any organization striving to enhance customer satisfaction and loyalty. By implementing effective measurement techniques, you can gain valuable insights into the quality of your customer service. Consequently, identify areas for improvement and act accordingly.
To analyze customer service measures effectively, you should adopt a comprehensive approach. This involves regularly collecting and reviewing data, identifying patterns and trends, and benchmarking performance against industry standards. Doing so lets you identify strengths to leverage and weaknesses to address.
Furthermore, analyzing customer service measures should not be limited to numerical data alone. It is equally important to consider qualitative feedback from customers, such as their perceptions, experiences, and suggestions. This qualitative information provides valuable context and helps you understand the emotional aspects of customer interactions.
Charting is key to gaining a better perspective on your business’s customer service. ChartExpo will help you make sense of your customer service measures data. Best of all, you don’t have to be a coding expert to use ChartExpo. It has an intuitive interface that is easy to use, even for newbies.
How much did you enjoy this article?


Google Forms to Google Sheets keeps your data organized and current with every submission. Learn the steps, methods, and tips now!

Product survey questions reveal what customers truly think. Learn how to ask the right ones and act on the survey results. Read on!

Learn how the 5-Point Performance Rating Scale improves employee evaluations with clear, consistent, and fair performance reviews across teams.


