• Home
  • Tools dropdown img
    • Spreadsheet Charts

      • ChartExpo for Google Sheets
      • ChartExpo for Microsoft Excel
    • Power BI Charts

      • Power BI Custom Visuals by ChartExpo
    • Word Cloud

  • Charts dropdown img
    • Chart Category

      • Bar Charts
      • Circle Graphs
      • Column Charts
      • Combo Charts
      • Comparison Charts
      • Line Graphs
      • PPC Charts
      • Sentiment Analysis Charts
      • Survey Charts
    • Chart Type

      • Box and Whisker Plot
      • Clustered Bar Chart
      • Clustered Column Chart
      • Comparison Bar Chart
      • Control Chart
      • CSAT Survey Bar Chart
      • CSAT Survey Chart
      • Dot Plot Chart
      • Double Bar Graph
      • Funnel Chart
      • Gauge Chart
      • Likert Scale Chart
      • Matrix Chart
      • Multi Axis Line Chart
      • Overlapping Bar Chart
      • Pareto Chart
      • Radar Chart
      • Radial Bar Chart
      • Sankey Diagram
      • Scatter Plot Chart
      • Slope Chart
      • Sunburst Chart
      • Tornado Chart
      • Waterfall Chart
      • Word Cloud
    • Google Sheets
      Microsoft Excel
  • Services
  • Pricing
  • Contact us
  • Blog
  • Support dropdown img
      • Gallery
      • Videos
      • Contact us
      • FAQs
      • Resources
    • Please feel free to contact us

      atsupport@chartexpo.com

Categories
All Data Visualizations Data Analytics Surveys
Add-ons/
  • Google Sheets
  • Microsoft Excel
  • Power BI
All Data Visualizations Data Analytics Surveys
Add-ons
  • Google Sheets
  • Microsoft Excel
  • Power BI

We use cookies

This website uses cookies to provide better user experience and user's session management.
By continuing visiting this website you consent the use of these cookies.

Ok

ChartExpo Survey


Home > Blog > Power BI

Connecting Power BI to SQL Server for Data Analysis

Connecting Power BI to SQL Server is like setting up a bridge between data and analysis. Imagine a world where data points are not just numbers or texts but stories waiting to be told. Power BI transforms these stories into visual narratives that guide decision-making. Meanwhile, SQL Server is a stalwart guardian of information, housing the data that fuels these stories.

Connecting Power BI to SQL Server

The synergy between Power BI and SQL Server is undeniable. With every connection, the flow of data becomes a stream of insights. It reveals trends and patterns that might otherwise remain hidden in the depths of datasets.

Businesses generate more data as they grow. By 2023, more than 90% of large businesses use advanced analytics to remain competitive. Connecting Power BI to SQL Server is one of the most critical strategic moves a company can make. It allows a business to leverage their data effectively, turning it into a critical asset that fuels growth and innovation.

More crucially, it’s not about Power BI speaking to SQL Server; it’s a two-way conversation. Power BI offers a straightforward reporting experience, providing new knowledge about data with each click without struggling with information. At the same time, SQL Server maintains the data’s meaning and safety. They allow the company to take its analytical capabilities to new heights.

This blog post explores the practical steps to establish this vital connection. We will guide you through the process, from the initial setup to fine-tuning data refresh schedules. We’ll equip you with the knowledge to make the most of connecting Power BI to SQL Server.

Table of Contents:

  1. What is the SQL Server?
  2. How to Connect Power BI to SQL Server?
  3. How to Create a Report by Connecting Power BI to SQL Server?
  4. How to Visualize Your Data Using Power BI?
  5. What are the Best Practices for Power BI Connect SQL Server?
  6. What are the Benefits of Connecting SQL Server to Power BI?
  7. Wrap Up

First…

What is the SQL Server?

Definition: SQL Server is an RDBMS or relational database management system created by Microsoft. The Structured Query Language (SQL) handles data manipulation and management within SQL Server. It retrieves and stores data in response to requests from other applications.

SQL servers can handle large quantities of data and many users simultaneously. Some features include information storage, retrieval, security, and backup. Different types of information can be stored, such as numbers, strings, or dates/times.

SQL Server provides development tools, business intelligence resources, and database administration functionalities. It can run on Windows operating systems and integrates with other Microsoft products like Visual Studio and Azure.

SQL server has various editions for different needs, from small businesses to large corporations. Therefore, scalability and reliability are guaranteed.

How to Connect Power BI to SQL Server?

Connecting Power BI to SQL Server allows you to access and analyze your database data to create insightful reports and visualizations. Here’s a step-by-step guide on how to connect Power BI to SQL server:

  1. Open Power BI Desktop: Launch the Power BI Desktop application on your computer.
  2. Click on “Get Data”: In the Power BI Desktop interface, locate and click the “Get Data” button from the Home tab. Or from the splash screen.
Get Data for Connecting Power BI to SQL Server
  1. Choose SQL Server: In the “Get Data” window, select “SQL Server” from the list of available data sources.
SQL Server for Connecting Power BI to SQL Server
  1. Enter server details: Enter the server details, such as the server name or IP address where your SQL Server instance is hosted.
Enter Server Details for Connecting Power BI to SQL Server
  1. Select authentication method: Choose the appropriate authentication method. Choose Windows Authentication if your Windows account has access. Choose SQL Server Authentication if you have a username and password.
Select Authentication Method for Connecting Power BI to SQL Server
  1. Click “Connect”: After entering the server details and authentication method, click the “Connect” button. This will establish a connection to the SQL Server database.
  2. Choose Data: Once connected, select the database and tables/views from which you want to import data into Power BI. Then click “Load” or “Transform Data” to refine the data further before loading it into Power BI.
Choose Data for Connecting Power BI to SQL Server
  1. Create Reports and Visualizations: After loading the data into Power BI, use the Query Editor to transform and shape your data if needed. Then, create reports and visualizations using Power BI’s intuitive drag-and-drop interface.

How to Create a Report by Connecting Power BI to SQL Server?

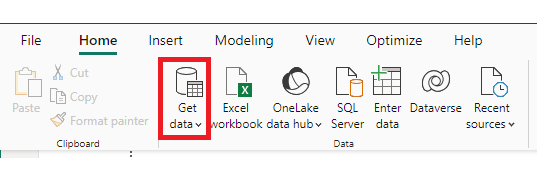
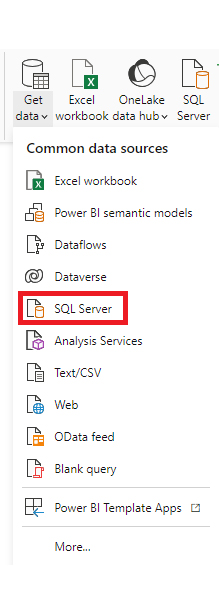
Creating a report by connecting Power BI to SQL Server is straightforward. It allows you to analyze and visualize your database data effectively. Here’s a step-by-step guide:

  1. Launch Power BI Desktop: Open the Power BI Desktop application on your computer to begin creating your report.
  2. Connect to SQL Server: Click the “Get Data” button and select “SQL Server” from the list of data sources. Enter your SQL Server credentials and connection details.
  3. Import data: Choose the tables or views from your SQL Server database that you want to import into Power BI for analysis. Click “Load” to import the data.
  4. Design report layout: Drag and drop fields from the imported data onto the report canvas to start designing your report layout. Arrange elements such as tables, matrices, and charts to organize your data visually.
  5. Customize visuals: Customize the visuals in your report by adjusting properties such as colors, fonts, and formatting. Use Power BI’s formatting options to make your report visually appealing and easy to understand.
  6. Create relationships: If your SQL Server database contains multiple tables, create relationships between them in Power BI to enable cross-table analysis. Use the Manage Relationships dialog to define the relationships based on related fields.
  7. Preview and publish: Preview your report to ensure it looks as expected. Once satisfied, click the “Publish” button to publish your report to the Power BI service. From here, you can share it with others or access it from anywhere.

How to Visualize Your Data Using Power BI?

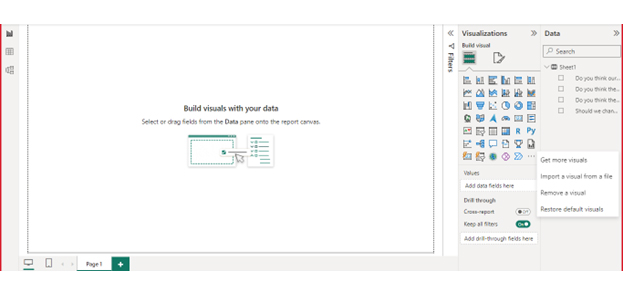
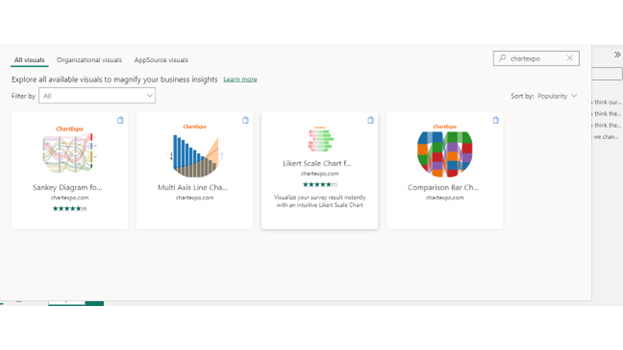
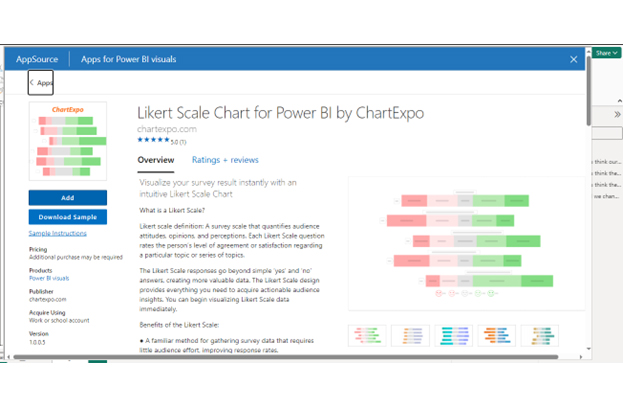
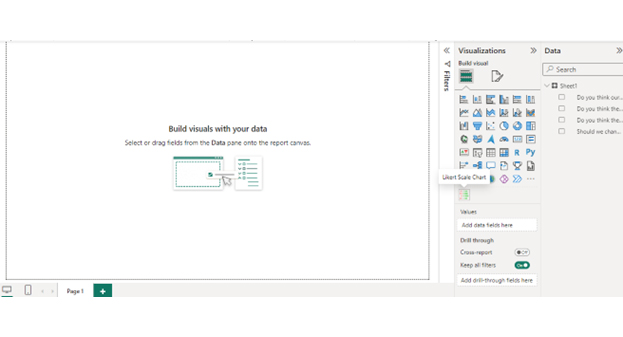
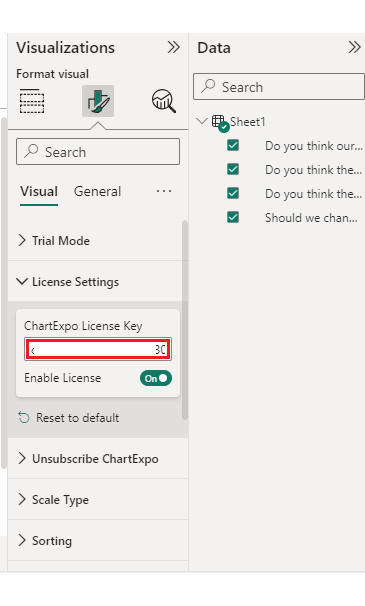
Follow these steps to harness the robust features of Power BI for effective data visualization.

Stage 1: Logging in to Power BI

  • Log in to Power BI.
  • Enter your email address and click the “Submit” button.
Enter email to login to Power BI
  • You are redirected to your Microsoft account.
  • Enter your password and click “Sign in“.
Enter Password to login to Power BI
  • You can choose whether to stay signed in.
Click on stay signed in
  • Once done, the Power BI home screen will open.

Stage 2: Creating a Data Set and Selecting the Data Set to Use in Your Chart

  • Go to the left-side menu and click the “Create” button.
  • Select “Paste or manually enter data“.
select Paste or manually enter data in Power BI ce487
  • We’ll use the sample data below for this example.
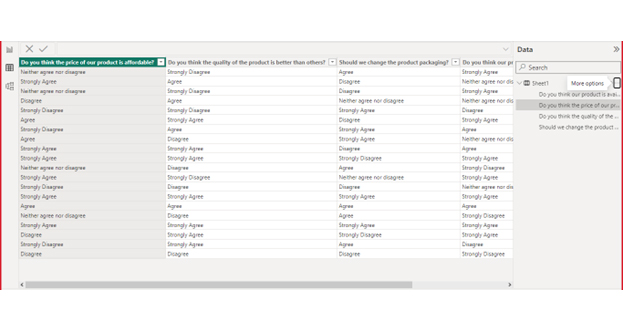
Is the price of our product affordable? Do you think the quality of the product is better than that of others? Should we change the product packaging? Is our product available in all stores in your city?
Neither agree nor disagree Strongly Disagree Agree Strongly Agree
Strongly Agree Agree Disagree Neither agree nor disagree
Neither agree nor disagree Strongly Disagree Disagree Strongly Agree
Disagree Agree Neither agree nor disagree Neither agree nor disagree
Strongly Disagree Strongly Disagree Strongly Agree Disagree
Agree Strongly Agree Disagree Strongly Agree
Strongly Disagree Agree Strongly Agree Agree
Agree Disagree Strongly Agree Neither agree nor disagree
Strongly Agree Strongly Agree Disagree Agree
Strongly Agree Strongly Agree Strongly Disagree Strongly Agree
Neither agree nor disagree Disagree Agree Strongly Disagree
Strongly Agree Strongly Disagree Neither agree nor disagree Strongly Agree
Strongly Disagree Disagree Disagree Neither agree nor disagree
Strongly Agree Strongly Agree Strongly Agree Strongly Agree
Agree Agree Agree Agree
Neither agree nor disagree Disagree Agree Strongly Disagree
Strongly Agree Strongly Agree Strongly Agree Strongly Agree
Disagree Strongly Agree Strongly Disagree Strongly Agree
Strongly Disagree Strongly Agree Agree Disagree
Disagree Disagree Disagree Strongly Disagree
  • Paste the above data table in the Power Query Window.
  • Select the “Create a dataset only” option.
Create a Dataset Only for Connecting Power BI to SQL Server
  • On the left-side menu, click “Data Hub“.
  • Power BI populates the data set list. (If you have not created a data set, refer to the Error! Reference source not found section).
  • Click on the “Create a report” dropdown.
Create a Report for Connecting Power BI to SQL Server
  • Click the “Expand All” button.
  • You can see your chart metrics:
  • Click on “Get more visuals“.
Get More Visuals for Connecting Power BI to SQL Server
  • Search for ChartExpo and select the Likert Scale Chart:
Select Likert Scale Chart for Connecting Power BI to SQL Server
  • Click the “Add” button.
Click Add Button for Connecting Power BI to SQL Server
  • You can now see the Likert Scale Chart in the visualizations list.
Likert Scale Chart List for Connecting Power BI to SQL Server
  • In Visual, click License Settings, add the key, and enable the license.
  • After adding the key, you can see the Likert Scale Chart.
Liscense Settings for Connecting Power BI to SQL Server
  • Set the scale of the chart as follows:
Set the Scale of Chart for Connecting Power BI to SQL Server
  • You can add the header text on top of the chart as follows:
Add the Header Text for Connecting Power BI to SQL Server
  • Your Likert Scale Chart final look in Power BI:
Final Connecting Power BI to SQL Server

Insights

  • Price Affordability: Mixed: Different opinions indicate different perceptions of affordability.
  • Product Quality: Customers strongly Agree that the quality is better than that of competitors.
  • Packaging Revision: Disagree: There is no unanimous agreement on changing the packaging.
  • Availability in Stores: Mixed: Unsure if the item is widely available at all stores in the city.

What are the Best Practices for Power BI Connect SQL Server?

When connecting Power BI to SQL Server, following best practices ensures efficiency, security, and optimal performance. Here’s a guide:

  • Use DirectQuery or Import Mode: Choose DirectQuery for real-time data or Import Mode for better performance with cached data.
  • Optimize SQL Server Queries: Write efficient SQL queries to minimize database load and maximize performance.
  • Leverage Query Folding: Use the Power Query’s query folding feature to push data transformation tasks to SQL Server for faster processing.
  • Secure connection: Implement secure connections using encrypted protocols like SSL/TLS to protect data during transmission.
  • Limit data import: Import only necessary data to reduce load times and improve report responsiveness.
  • Schedule refresh: Set up scheduled data refreshes to keep reports up-to-date with the latest data from SQL Server.
  • Document connections: Document Power BI connections to SQL Server for easier maintenance and troubleshooting.
  • Monitor performance: Monitor Power BI and SQL Server performance regularly to promptly identify and address any issues.
  • Implement Row-Level Security (RLS): Apply RLS to restrict access to data based on user roles, ensuring data confidentiality.
  • Follow data governance policies: Adhere to organizational data governance policies and regulations when accessing and handling SQL Server data in Power BI.

What are the Benefits of Connecting SQL Server to Power BI?

Connecting SQL Server to Power BI offers numerous benefits, empowering organizations to extract valuable insights from their data.

  • Real-Time Insights

Power BI offers the ability to create a live connection to SQL Server via DirectQuery. Thus, you can retrieve the most recent data quickly and at any time. This is helpful in situations where real-time information is essential, such as monitoring several KPIs.

  • Rich Visualization

Power BI offers an extensive collection of visualizations. SQL Server data can be easily converted into visual form, charts, maps, and pictures. This makes interpreting information and identifying patterns, trends, or outliers easier.

  • Self-Service Analytics

Power BI revolutionizes self-service analytics, allowing you to perform ad-hoc analysis on SQL Server data without depending on IT or data specialists. With its intuitive user interface and robust self-service capabilities, you can explore, manipulate, and visualize data on your own terms. This empowerment accelerates insights discovery and enhances decision-making, putting the power of analytics directly into your hands.

  • Data Integration

Power BI seamlessly integrates with SQL Server and other data sources. This covers all SQL-related data and cloud systems, Excel tables, web services, and other sources. This integration consolidates data across multiple systems and enables a more robust performance overview.

  • Scalability

SQL Server and Power BI are designed to grow as business needs expand. For example, the database engine that underpins SQL Server comes with features designed to scale out. Such features include data partitioning, clustering, and replication to scale on large volumes of data and multi-user concurrency. Power BI has a cloud-based, distributed computing architecture that makes it suitable for working with large-scale data and a large user base.

  • Improved Decision-Making

Connecting SQL Server to Power BI gives you stronger access to insights from your data resources. The insights extracted using Power BI can guide strategic decisions, help optimize processes, and allocate resources more efficiently. Leveraging SQL Server data delivers better business outcomes and helps drive informed decision-making.

  • Centralized Data Access

Power BI offers a centralized location for accessing, analyzing, and sharing SQL Server data across the organization. Data models, reports, and dashboards created in Power BI help reduce data silos. How? By providing a single version of the truth. This ensures consistency in analytics and decision-making processes. Power BI also has robust governance features that enable the management of data security, user governance, and access permissions.

  • Cost Efficiency

Leveraging Power BI to connect to SQL Server can yield cost savings. How? By maximizing the value of existing SQL Server investments and licenses. It eliminates the need to invest in separate analytics tools or infrastructure. You can use Power BI’s robust capabilities to derive insights from SQL Server data at a lower total cost of ownership (TCO).

FAQs

Why does Power BI connect with the SQL server?

Power BI connects with SQL Server to leverage SQL Server’s data management capabilities and Power BI’s analytics tools. This integration enables organizations to extract insights, create visualizations, and make data-driven decisions from their SQL Server data.

Can Power BI connect directly to the SQL Server?

Yes, Power BI can connect directly to the SQL Server using various methods, such as DirectQuery or importing data. This direct connection allows Power BI to access SQL Server databases in real-time. Thus, users can analyze and visualize up-to-date data seamlessly.

How do I connect Power BI to SQL Server locally?

To connect Power BI to SQL Server locally;

  1. Open Power BI Desktop.
  2. Click “Get Data” and select “SQL Server” from the list.
  3. Enter the server name and credentials.
  4. Choose the database and tables you want to import or connect to directly.

How do I connect to the SQL Server in the Power BI gateway?

To connect to SQL Server in Power BI Gateway:

  1. Install and configure the gateway on your local network.
  2. In Power BI Service, navigate to “Manage Gateways” and add a new gateway.
  3. Configure data sources by selecting “SQL Server” and providing connection details like server name and credentials.

Wrap Up

Connecting Power BI to SQL Server is crucial in harnessing the full potential of data analysis and visualization. Following a systematic approach, you can seamlessly integrate these two powerful platforms, derive actionable insights, and make informed decisions.

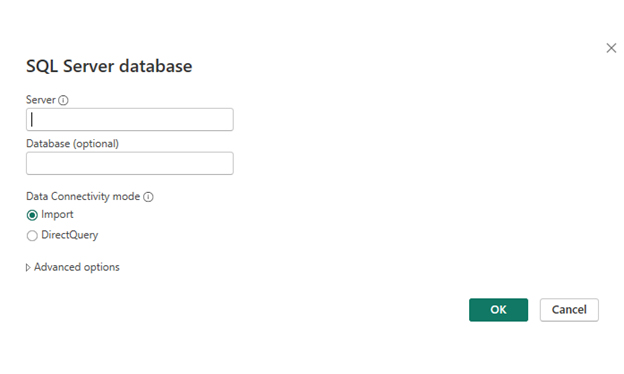
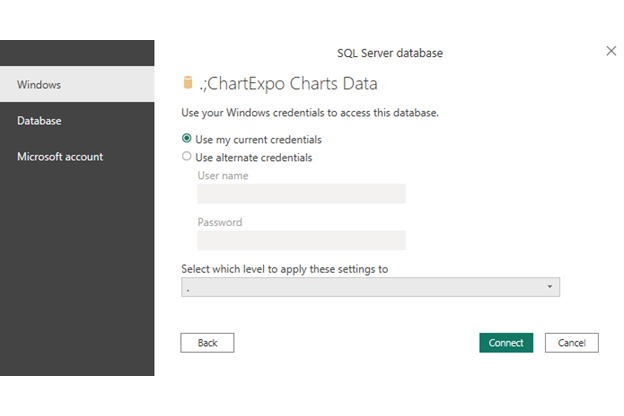
First, initiate the process by launching Power BI Desktop, the primary tool for creating reports and dashboards. This user-friendly interface serves as the gateway to accessing SQL Server data.

Next, connect to SQL Server by selecting the appropriate data source within Power BI Desktop. You can do this through DirectQuery for real-time data access or importing data for offline analysis. Power BI offers flexible connectivity options to suit different needs.

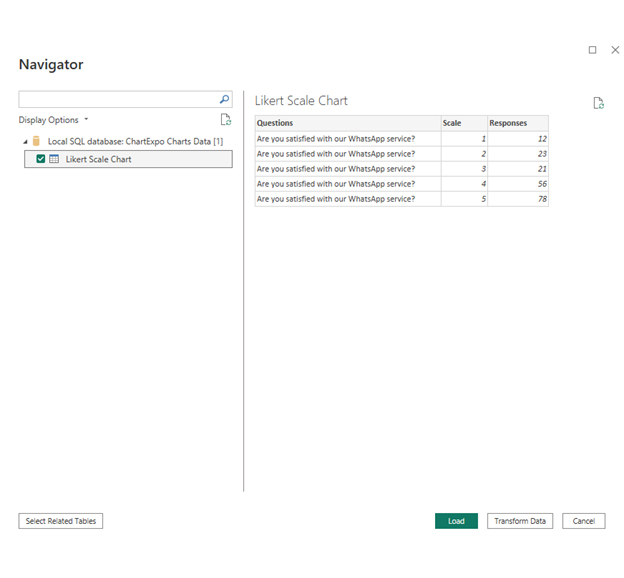
Once the connection is established, you can import data from SQL Server tables or write custom SQL queries to extract specific datasets. This step ensures that relevant data is available for analysis within Power BI.

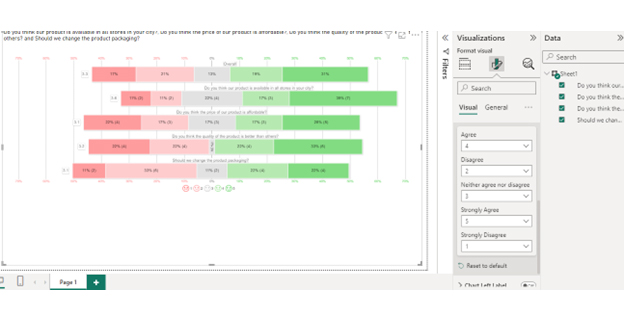
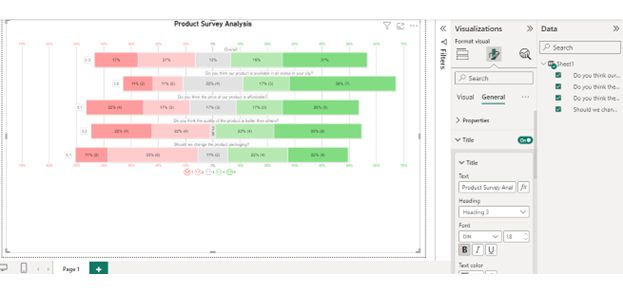
The subsequent phase involves designing the report layout and customizing visuals. Here, you arrange data elements and create compelling visualizations to convey insights effectively. This step involves utilizing Power BI’s extensive visualization tools and features suite.

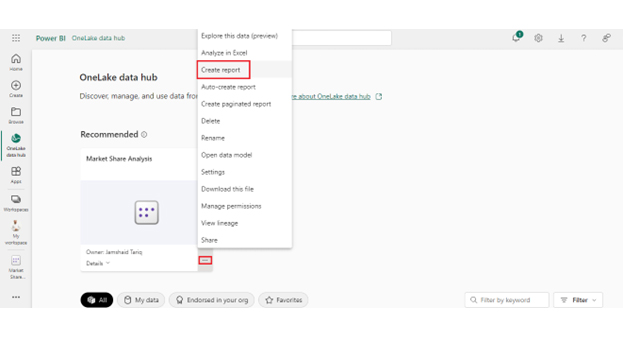
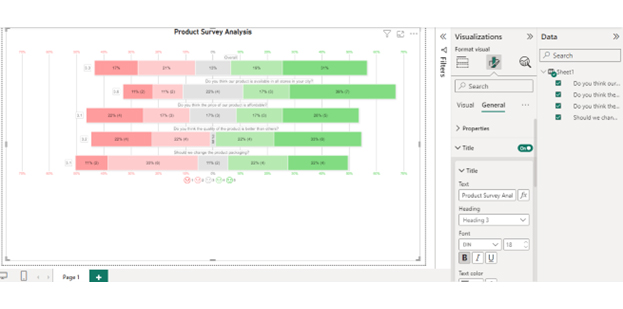
Finally, preview and publish the report to share insights with stakeholders or schedule data refreshes to keep it up-to-date. This closing step ensures that decision-makers have access to timely and accurate information derived from SQL Server data. This enables them to drive organizational success.

Connecting Power BI to SQL Server opens the door to many data analysis and visualization opportunities. Following the structured approach above empowers you to leverage the integration between these platforms to drive business growth.

Do not hesitate.

Leverage the synergy between Power BI and SQL Server to harness the power of your data effectively.

How much did you enjoy this article?

PBIAd1
Start Free Trial!
135706

Related articles

next previous
Power BI12 min read

Power BI Group By Guide for Effective Data Insights

Learn how Power BI Group By helps you aggregate data, clarify trends, and create reports by grouping values to make large datasets manageable & insightful.

Power BI12 min read

How to Create Sankey Diagram in Microsoft Power BI?

Learn How to Create Sankey Diagram in Microsoft Power BI using Desktop & Web Service. What they are and how to use them effectively.

Power BI8 min read

Power BI Artificial Intelligence: Insights Using Visuals

Discover all there is to know about the Power BI artificial intelligence. You'll also discover how AI is used in Power BI, and how to use it for analysis and more.

Power BI9 min read

Budgeting in Healthcare: Use Visuals to Spot Budget Gaps

This guide helps you discover what budgeting in healthcare is. You'll also discover the factors that affect hospital budgets and types of budgeting in healthcare.

Power BI9 min read

Predictive Analytics in Power BI for Making Insightful Visuals

This guide shows you everything you need to know about Predictive Analytics in Power BI. It also shows you how it works, and how to interpret the results.

ChartExpo logo

Turn Data into Visual
Stories

CHARTEXPO

  • Home
  • Gallery
  • Videos
  • Services
  • Pricing
  • Contact us
  • FAQs
  • Privacy policy
  • Terms of Service
  • Sitemap

TOOLS

  • ChartExpo for Google Sheets
  • ChartExpo for Microsoft Excel
  • Power BI Custom Visuals by ChartExpo
  • Word Cloud

CATEGORIES

  • Bar Charts
  • Circle Graphs
  • Column Charts
  • Combo Charts
  • Comparison Charts
  • Line Graphs
  • PPC Charts
  • Sentiment Analysis Charts
  • Survey Charts

TOP CHARTS

  • Sankey Diagram
  • Likert Scale Chart
  • Comparison Bar Chart
  • Pareto Chart
  • Funnel Chart
  • Gauge Chart
  • Radar Chart
  • Radial Bar Chart
  • Sunburst Chart
  • see more
  • Scatter Plot Chart
  • CSAT Survey Bar Chart
  • CSAT Survey Chart
  • Dot Plot Chart
  • Double Bar Graph
  • Matrix Chart
  • Multi Axis Line Chart
  • Overlapping Bar Chart
  • Control Chart
  • Slope Chart
  • Clustered Bar Chart
  • Clustered Column Chart
  • Box and Whisker Plot
  • Tornado Chart
  • Waterfall Chart
  • Word Cloud
  • see less

RESOURCES

  • Blog
  • Resources
  • YouTube
SIGN UP FOR UPDATES

We wouldn't dream of spamming you or selling your info.

© 2025 ChartExpo, all rights reserved.