• Home
  • Tools dropdown img
    • Spreadsheet Charts

      • ChartExpo for Google Sheets
      • ChartExpo for Microsoft Excel
    • Power BI Charts

      • Power BI Custom Visuals by ChartExpo
    • Word Cloud

  • Charts dropdown img
    • Chart Category

      • Bar Charts
      • Circle Graphs
      • Column Charts
      • Combo Charts
      • Comparison Charts
      • Line Graphs
      • PPC Charts
      • Sentiment Analysis Charts
      • Survey Charts
    • Chart Type

      • Box and Whisker Plot
      • Clustered Bar Chart
      • Clustered Column Chart
      • Comparison Bar Chart
      • Control Chart
      • CSAT Survey Bar Chart
      • CSAT Survey Chart
      • Dot Plot Chart
      • Double Bar Graph
      • Funnel Chart
      • Gauge Chart
      • Likert Scale Chart
      • Matrix Chart
      • Multi Axis Line Chart
      • Overlapping Bar Chart
      • Pareto Chart
      • Radar Chart
      • Radial Bar Chart
      • Sankey Diagram
      • Scatter Plot Chart
      • Slope Chart
      • Sunburst Chart
      • Tornado Chart
      • Waterfall Chart
      • Word Cloud
    • Google Sheets
      Microsoft Excel
  • Services
  • Pricing
  • Contact us
  • Blog
  • Support dropdown img
      • Gallery
      • Videos
      • Contact us
      • FAQs
      • Resources
    • Please feel free to contact us

      atsupport@chartexpo.com

Categories
All Data Visualizations Data Analytics Surveys
Add-ons/
  • Google Sheets
  • Microsoft Excel
  • Power BI
All Data Visualizations Data Analytics Surveys
Add-ons
  • Google Sheets
  • Microsoft Excel
  • Power BI

We use cookies

This website uses cookies to provide better user experience and user's session management.
By continuing visiting this website you consent the use of these cookies.

Ok

ChartExpo Survey


Home > Blog > Surveys

Workplace Culture Surveys: Visual Perception, Not Guesswork

Workplace culture surveys assess employee values, satisfaction, and experiences. It provides insights into organizational strengths, identifies areas for improvement, and fosters a positive, productive, and inclusive work environment.

Workplace Culture Surveys

This guide dives deep into what an employee culture survey is, a workplace culture survey is, and why you should measure organizational culture. The guide also exposes you to the best data visualization tools and how to use Power BI.

You’ll also see the top 10 organizational culture survey questions, how often you should conduct organizational culture surveys, and how to use company culture survey results.

Aside from these, the guide explains company culture survey examples and how to analyze workplace culture survey results using Power BI.

Table of Contents:

  1. What is an Employee Culture Survey?
  2. What is a Workplace Culture Survey?
  3. Why Measure Organizational Culture?
  4. How often should you Conduct Organizational Culture Surveys?
  5. How to Analyze Workplace Culture Survey Results in Power BI?
  6. How can you use Company Culture Survey Results?
  7. Benefits of the Workplace Culture Assessment Survey
  8. Tips to Develop an Effective Workplace Culture Survey
  9. FAQs
  10. Wrap Up

What is an Employee Culture Survey?

Definition: An Employee Culture Survey is a tool used to assess employees’ perceptions of their workplace environment, experiences, and values. It helps measure factors like communication, diversity, leadership, job satisfaction, and company values.

What is a Workplace Culture Survey?

Definition: A Workplace Culture Survey is a tool used to assess the employees’ perceptions of their organization’s behaviors, environment, and values. It measures aspects like communication, leadership, job satisfaction, teamwork, and inclusion.

Why Measure Organizational Culture?

  • Identify Strengths and Areas for Improvement

Assessments and surveys reveal what employees value and where they face challenges. It helps leaders build on strengths and address weaknesses to boost overall workplace satisfaction.

  • Align Culture with Business Goals

A good understanding of the current culture enables leaders to align their values and behaviors with organizational objectives. A strong, goal-oriented culture drives productivity, business success, and innovation.

  • Improve Employee Engagement and Retention

A positive culture boosts employee morale and lowers turnover. Measuring culture helps organizations identify factors that influence engagement. These factors could be communication, leadership style, and recognition.

  • Track Progress Over Time

Measuring culture regularly helps organizations monitor changes, assess the impact of new initiatives, and ensure continuous improvement.

How often should you Conduct Organizational Culture Surveys?

Annual Surveys (Once a Year)

It offers comprehensive insights into the overall cultural trends. Business owners can use it to track long-term progress and compare year-over-year results.

Bi-Annual Surveys (Twice a Year)

It plays a major role in measuring the impact of cultural initiatives and also helps in tracking progress toward specific cultural goals. Furthermore, the bi-annual survey is useful during times of moderate change (or growth).

Pulse Surveys (Quarterly or Monthly)

It’s a short, focused survey that tracks specific aspects of culture like engagement or DEI. This survey type is ideal for gathering quick feedback and responding to emerging issues.

After Major Events

Conduct surveys following major organizational changes like acquisitions, leadership shifts, or mergers. This will help you gauge employee sentiment and cultural alignment.

Recommended Approach

You could consider:

  • Annual survey for a comprehensive view
  • Post-event surveys after major changes
  • Quarterly pulse surveys for ongoing insights.

How to Analyze Workplace Culture Survey Results in Power BI?

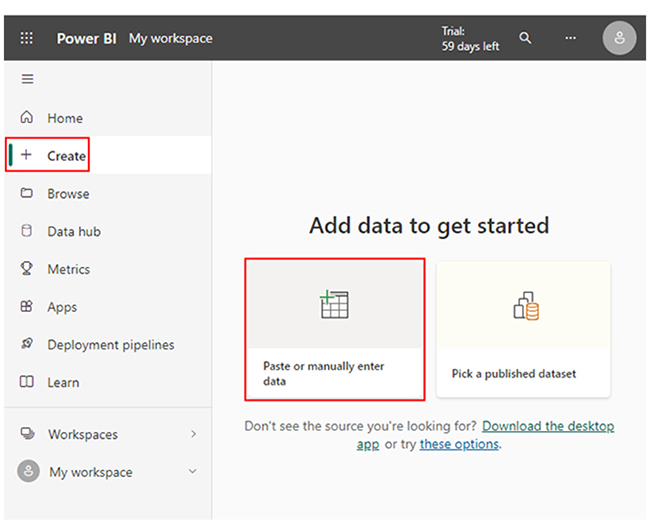
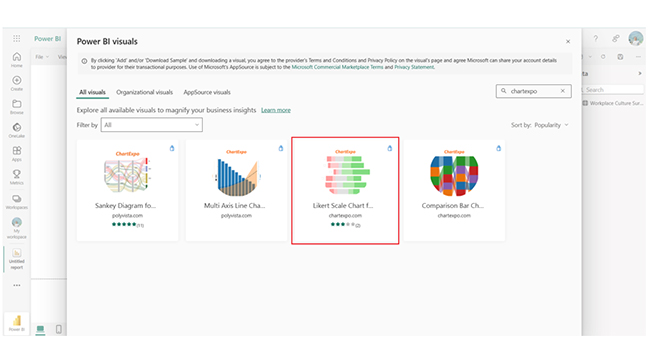
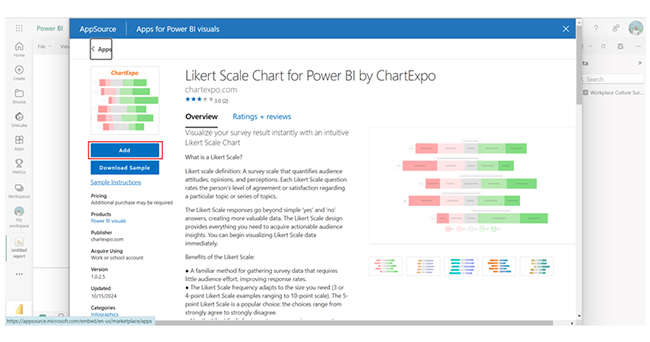
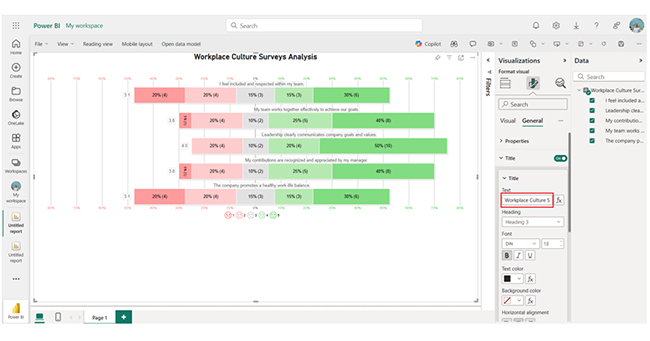
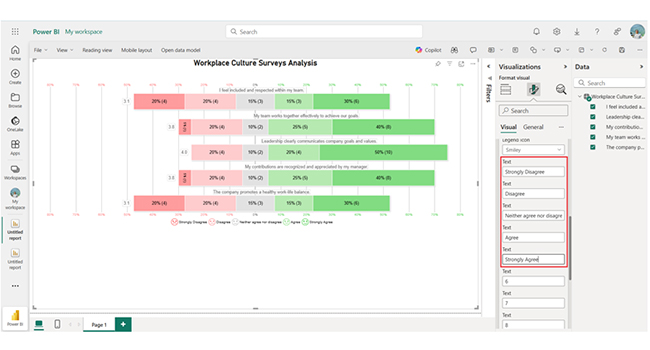
This section shows you how data-driven decision-making is possible with Power BI data visualization. It also showcases some Power BI design ideas and a Power BI report.

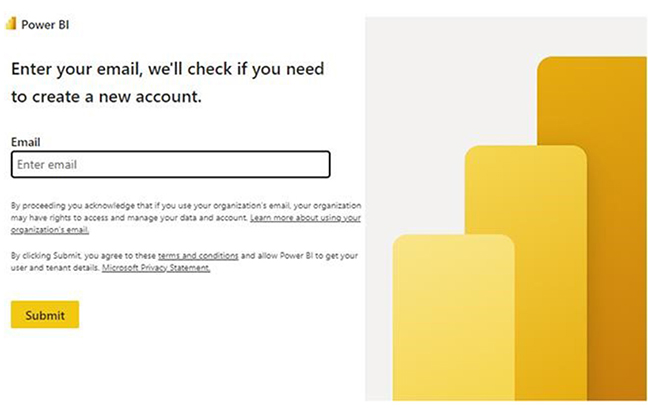
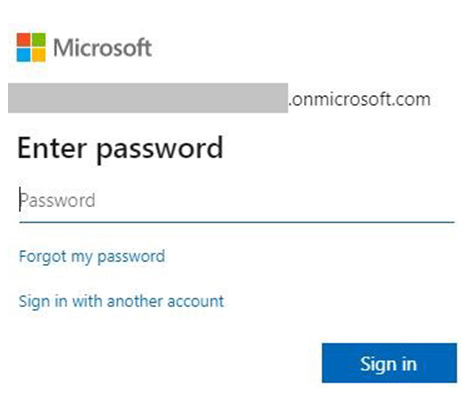
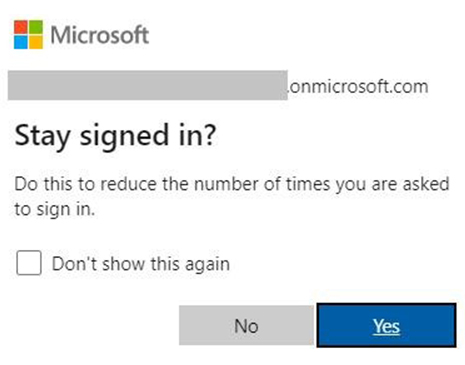
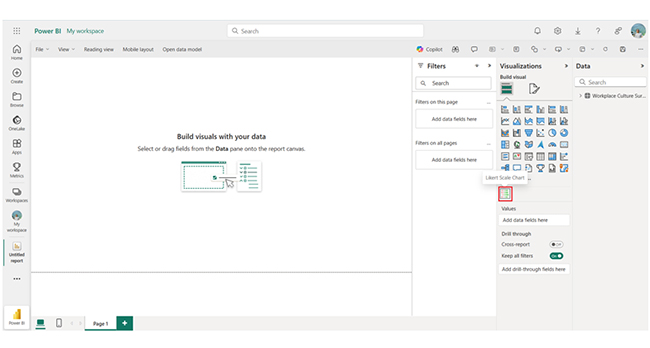
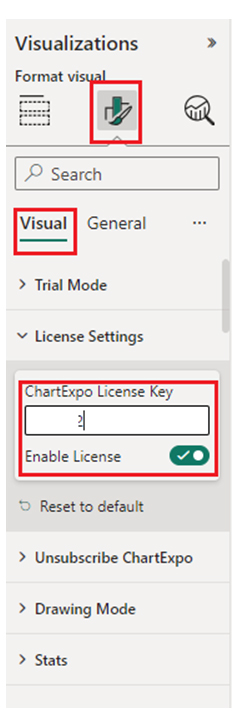
Here are the stages to help you analyze workplace culture survey results in Power BI.

  • Stage 1: Log into Power BI, enter your email, and click the “Submit” button.
Workplace Culture Surveys
  • You’ll be redirected to a Microsoft account. Enter your password, and click “Sign in.”
Workplace Culture Surveys
  • You can opt to stay signed in.
Workplace Culture Surveys
  • Stage 2: Create a Data Set and Select the Data Set to Use in the Likert Scale Chart.
  • Navigate to the left-side menu, and click on the “Create” option. After that, select “Paste or manually enter data.”
Workplace Culture Surveys
  • The Workplace Culture Survey Data will be used for this illustration.
Workplace Culture Surveys
  • Paste the above Power BI dataset into the “Power Query” window. At this point, select the third “Create a blank report” option.
Workplace Culture Surveys
  • To add the Power BI Likert Scale Chart Extension by ChartExpo, you’ll need to use an add-in or Power BI visual from AppSource. Navigate to the right side of the Power BI dashboard. Open the Power BI visualizations panel, and click the ellipsis symbol (…) to import the Power BI Likert Scale Chart extension by ChartExpo.
  • In the following menu that opens, select the “Get more visuals” option.
Workplace Culture Surveys
  • Enter “ChartExpo” in the highlighted search box. You’ll see the “Likert Scale Chart for Power BI by ChartExpo.”
Workplace Culture Surveys
  • After that, click on the Likert Scale Chart, and click the highlighted “Add” button.
Workplace Culture Surveys
  • Power BI will add the “Likert Scale Chart for Power BI by ChartExpo” icon in the visualization panel.
Workplace Culture Surveys
  • To draw a Likert Scale Chart with ChartExpo’s Power BI extension, you’ll have to select the “Likert Scale Chart for Power BI by ChartExpo” icon in the visualization panel. You’ll have to provide your email address or a ChartExpo license key. Add the key under the visual section. After that, you’ll see the Likert Scale Chart.
Workplace Culture Surveys
  • After adding the key, you’ll see the chart. You can scale mapping in the chart under the General section.
Workplace Culture Surveys
  • Add the top header text.
Workplace Culture Surveys
  • You can add the text to an Emoji.
Workplace Culture Surveys
  • Here’s the final Likert Scale Chart.
Workplace Culture Surveys

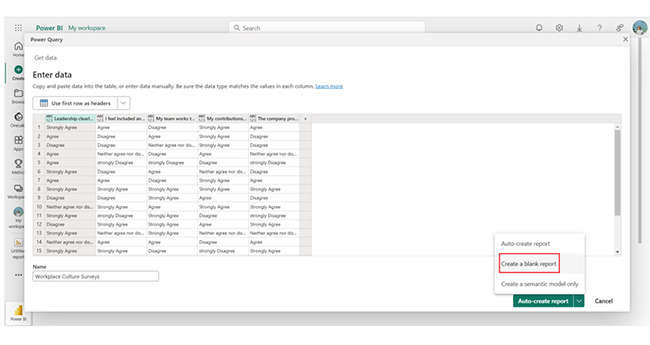
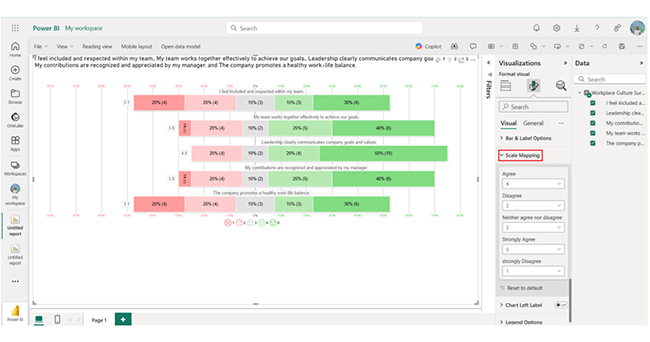
The steps above can be used when representing data using the Sankey Diagram in Power BI.

Insights

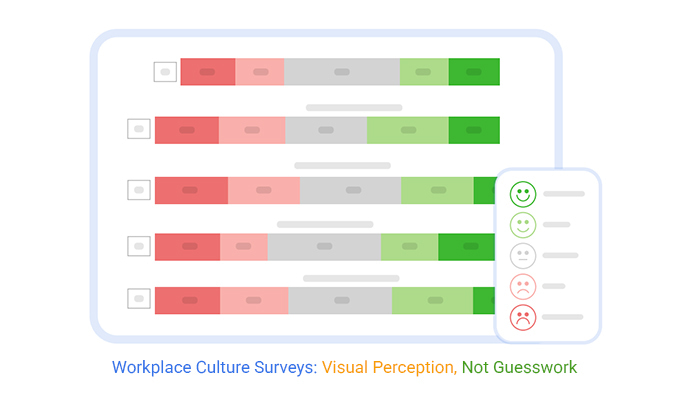
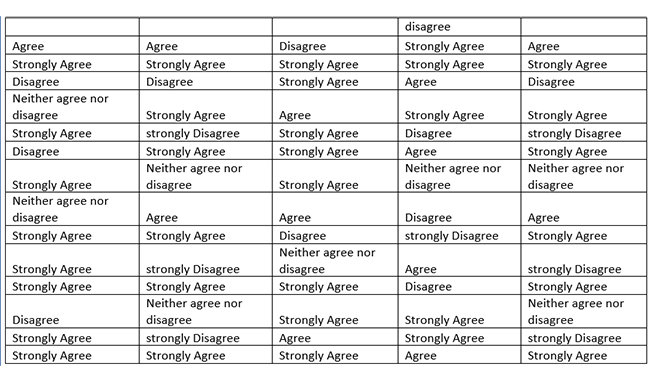
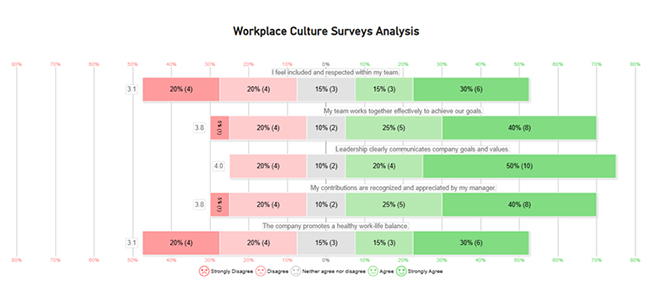
The survey shows strong leadership communication (75% agree/strongly agree) and effective teamwork (70% positive responses). However, work-life balance scores are low (45% disagree/strongly disagree).

Inclusion (65% positive) and manager recognition (68% positive) are moderate, but work-life balance requires immediate attention to improve overall employee retention and satisfaction.

How can you use Company Culture Survey Results?

  • Analyze Trends and Patterns

It helps you identify strengths and areas that need improvement. This is accomplished by reviewing qualitative feedback and quantitative scores. Also, compare results across departments (or teams) to spot inconsistencies.

  • Share Results Transparently

You have to present key findings to stakeholders and employees to foster trust.

  • Develop Action Plans

Create targeted initiatives based on feedback. These initiatives could be leadership training or wellness initiatives. Assign clear ownership and deadlines for actions.

  • Track Progress

Use follow-up pulse surveys to monitor the effectiveness of changes. You should always adjust initiatives based on new insights.

  • Celebrate Improvements

Recognize individuals and teams that contribute to a positive culture. Always communicate progress to keep employees engaged.

Benefits of the Workplace Culture Assessment Survey

  • Identify Strengths and Areas for Improvement

A good understanding of employee needs gives organizations the room to address concerns, boost morale, and reduce turnover.

  • Promote Transparency and Trust

Collecting feedback and acting on it builds trust and shows employees their voices matter.

  • Enhance Leadership Effectiveness

Feedback highlights leadership strengths and areas for development. That helps improve management practices.

  • Align Culture with Business Goals

Insights from surveys help align organizational values with business strategies, and that fosters a goal-driven workplace.

Tips to Develop an Effective Workplace Culture Survey

  • Define Clear Objectives

Identify what you want to measure. These could be leadership effectiveness, engagement, communication, or DEI. The survey goals should be aligned with business outcomes and organizational values.

  • Cover Key Areas of Workplace Culture

Include questions on teamwork, leadership, DEI, communication, growth opportunities, recognition, and work-life balance.

  • Pilot Test Before Launch

Test the survey with a small group to check relevance and clarity.

  • Act on Feedback Promptly

Share results with employees and implement meaningful changes based on their input.

Ever wonder what the Power BI dashboard vs report is? Well, the next section dives deep into that. It serves as a data visualization guide for both new and experienced Power BI users. The section also explores the Looker vs. Power BI debate.

FAQs

What is a company culture survey?

A company culture survey gathers employee feedback on workplace behaviors, experiences, and values. It measures areas like teamwork, leadership, inclusion, and engagement to improve organizational culture and employee satisfaction.

What questions are asked in a culture survey?

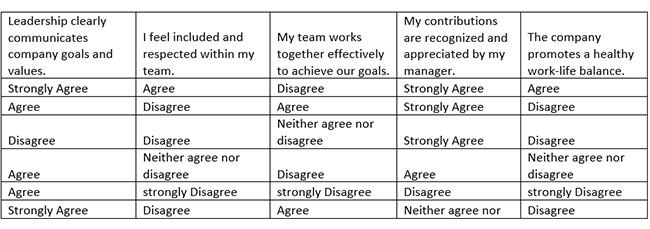
The culture survey questions cover teamwork, recognition, leadership communication, inclusivity, values alignment, employee engagement, and work-life balance. It also includes growth opportunities, transparency, and overall job satisfaction.

Wrap Up

An Employee Culture Survey gathers feedback on employee experiences and values. The Workplace Culture Survey assesses the overall organizational environment.

By measuring organizational culture, you’ll be able to identify strengths, areas of improvement, boost engagement, align values with goals, and drive continuous growth.

To get the most from a workplace culture survey, you’ll have to use simple and focused questions. Keep the questions clear, concise, and jargon-free. Also, use a mix of multiple-choice, Likert scale, and open-ended questions for balanced feedback.

Furthermore, you have to keep the survey short and manageable. Limit the survey to 20 to 30 questions to prevent survey fatigue. Explain why the survey matters and how results will help in improving the workplace.

Now you know what a workplace culture survey is, what kind of questions will you include when preparing yours?

How much did you enjoy this article?

ExcelAd1
Start Free Trial!
151293

Related articles

next previous
Surveys11 min read

How to Interpret 4-Point Likert Scale Results?

Click to learn How to Create, Gather and Analyze Data Using the 4-Point Likert Scale? A complete guide with definition, examples, uses, and applications.

Surveys7 min read

Benchmark for Surveying: Visual Insights

This guide dives deep into benchmarks for surveying. It shows you what it is, and the types of benchmarks in the survey. You'll also discover how to analyze it.

Surveys13 min read

5 Point Likert Scale Analysis, Interpretation & Examples

Dive deep into the realm of 5-point Likert Scale Analysis and Interpretation to unravel the sentiments behind your responses. Gain actionable insights today.

Surveys11 min read

3-Point Likert Scale: Range Interpretation & Analysis

Learn the basics of the 3-point Likert scale, including examples, benefits, and when it's best applied in research and feedback forms.

Surveys16 min read

Survey Data Collection: Definition, Methods and Analysis

Find the best methods of Survey data collection. Elevate your research game with practical tips for gathering, analyzing, and leveraging valuable information.

ChartExpo logo

Turn Data into Visual
Stories

CHARTEXPO

  • Home
  • Gallery
  • Videos
  • Services
  • Pricing
  • Contact us
  • FAQs
  • Privacy policy
  • Terms of Service
  • Sitemap

TOOLS

  • ChartExpo for Google Sheets
  • ChartExpo for Microsoft Excel
  • Power BI Custom Visuals by ChartExpo
  • Word Cloud

CATEGORIES

  • Bar Charts
  • Circle Graphs
  • Column Charts
  • Combo Charts
  • Comparison Charts
  • Line Graphs
  • PPC Charts
  • Sentiment Analysis Charts
  • Survey Charts

TOP CHARTS

  • Sankey Diagram
  • Likert Scale Chart
  • Comparison Bar Chart
  • Pareto Chart
  • Funnel Chart
  • Gauge Chart
  • Radar Chart
  • Radial Bar Chart
  • Sunburst Chart
  • see more
  • Scatter Plot Chart
  • CSAT Survey Bar Chart
  • CSAT Survey Chart
  • Dot Plot Chart
  • Double Bar Graph
  • Matrix Chart
  • Multi Axis Line Chart
  • Overlapping Bar Chart
  • Control Chart
  • Slope Chart
  • Clustered Bar Chart
  • Clustered Column Chart
  • Box and Whisker Plot
  • Tornado Chart
  • Waterfall Chart
  • Word Cloud
  • see less

RESOURCES

  • Blog
  • Resources
  • YouTube
SIGN UP FOR UPDATES

We wouldn't dream of spamming you or selling your info.

© 2025 ChartExpo, all rights reserved.