• Home
  • Tools dropdown img
    • Spreadsheet Charts

      • ChartExpo for Google Sheets
      • ChartExpo for Microsoft Excel
    • Power BI Charts

      • Power BI Custom Visuals by ChartExpo
    • Word Cloud

  • Charts dropdown img
    • Chart Category

      • Bar Charts
      • Circle Graphs
      • Column Charts
      • Combo Charts
      • Comparison Charts
      • Line Graphs
      • PPC Charts
      • Sentiment Analysis Charts
      • Survey Charts
    • Chart Type

      • Box and Whisker Plot
      • Clustered Bar Chart
      • Clustered Column Chart
      • Comparison Bar Chart
      • Control Chart
      • CSAT Survey Bar Chart
      • CSAT Survey Chart
      • Dot Plot Chart
      • Double Bar Graph
      • Funnel Chart
      • Gauge Chart
      • Likert Scale Chart
      • Matrix Chart
      • Multi Axis Line Chart
      • Overlapping Bar Chart
      • Pareto Chart
      • Radar Chart
      • Radial Bar Chart
      • Sankey Diagram
      • Scatter Plot Chart
      • Slope Chart
      • Sunburst Chart
      • Tornado Chart
      • Waterfall Chart
      • Word Cloud
    • Google Sheets
      Microsoft Excel
  • Services
  • Pricing
  • Contact us
  • Blog
  • Support dropdown img
      • Gallery
      • Videos
      • Contact us
      • FAQs
      • Resources
    • Please feel free to contact us

      atsupport@chartexpo.com

Categories
All Data Visualizations Data Analytics Surveys
Add-ons/
  • Google Sheets
  • Microsoft Excel
  • Power BI
All Data Visualizations Data Analytics Surveys
Add-ons
  • Google Sheets
  • Microsoft Excel
  • Power BI

We use cookies

This website uses cookies to provide better user experience and user's session management.
By continuing visiting this website you consent the use of these cookies.

Ok

ChartExpo Survey


Home > Blog > Power BI

Power BI Join Tables Understanding Relationships Easily

Combining data from multiple sources in Power BI could be an issue — and this guide addresses that! This guide dives into the world of Power BI join tables.

Power BI Join Tables

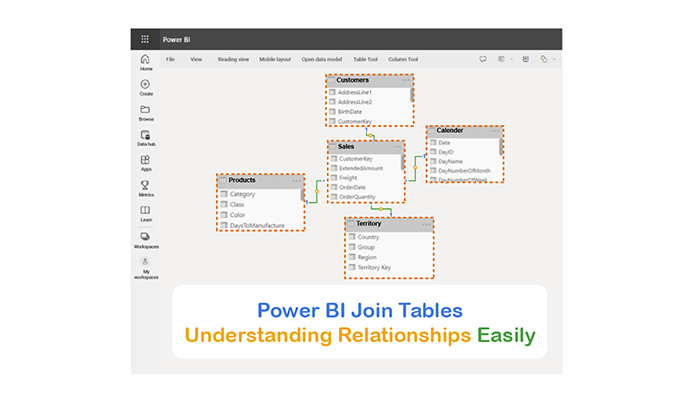
It shows you the most efficient and effective ways to consolidate and merge your data.

Table of Contents:

  1. Define Power BI Join Tables
  2. Why Join Tables in Power BI?
  3. What are the Different Types of Joins in Power BI?
  4. How to Join Two Tables in Power BI?
  5. Mastering Table Joins in Power BI for Clearer Data Visuals
  6. What are the Advantages of Merging Two Tables in Power BI?
  7. What are the Best Practices for Joining Two Tables in Power BI?
  8. Wrap Up

First…

Define Power BI Join Tables

Power BI join tables is the process of combining data from multiple tables based on common fields (or keys). It enables users to create relationships between tables, and gives room for comprehensive data analysis and data visualization within Power BI reports.

Why Join Tables in Power BI?

Join table in Power BI helps in consolidating data from multiple sources and creating comprehensive insights and visualizations. By merging related tables, users can establish relationships and enhance data analysis.

It gives room for the aggregation of data from multiple tables based on common fields, and it also enables users to perform complex calculations, comparisons, and filtering. The feature simplifies data modeling and enhances report creation. All these aid in a more comprehensive understanding of the data.

Pro-tip: Users have to ensure that the columns being used for the join have the same data type to avoid potential data mismatches before proceeding with the join.

What are the Different Types of Joins in Power BI?

Here are the different types of joins in Power BI:

  • Inner Join: This join type only reruns the matching rows from both tables.
  • Left Join: This join returns all rows from the left table and matching rows from the right table.
  • Right Join: This join returns all rows from the right table, and matching rows from the left table.
  • Full Join: This join returns all rows from both tables and includes non-matching rows.

How to Join Two Tables in Power BI?

Here are two ways to join tables in Power BI.

  • On the relationships page
  • With Power Query.

Joining With the Relationships Page

Using the relationships page in Power BI is the easiest way to join tables. If the table IDs are the same across tables, the relationships will automatically be picked up.

Relationships will Automaticallly be Picked Up for Doing Power BI Join Tables

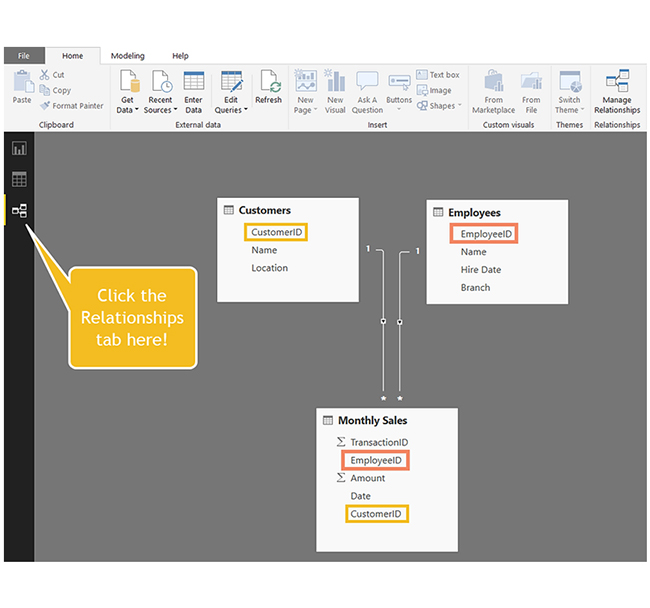
If Power BI doesn’t pick up on the relationships, create one. To do that, click and drag the column name from one table over to the other table.

Click and Drag Column Name from One Table Over to Other for Doing Power BI Join Tables

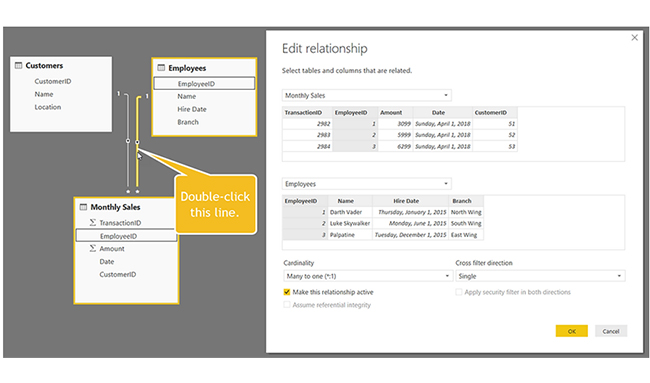
To edit any relationship, double-click on the relationship line. A new window appears with several settings.

Double-Click on Relationship Line for Doing Power BI Join Tables

Joining With Power Query

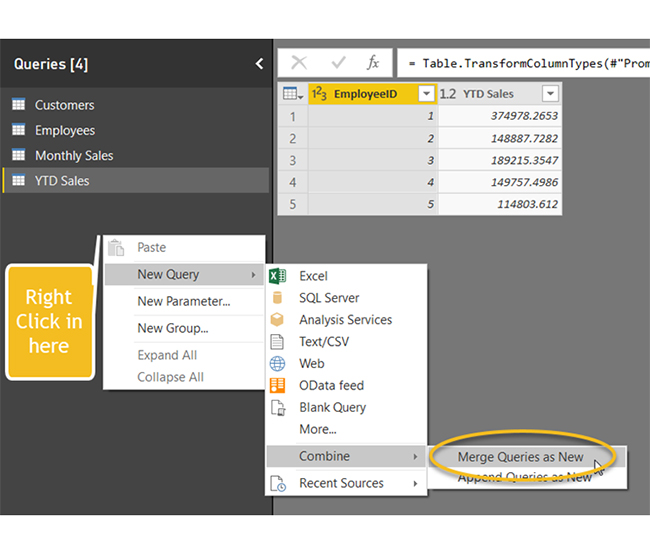
There are cases where you’ll want to join a table in the data prep stages before it hits the data model. Joining a table with Power Query merges the table together with any number of columns you want to bring over.

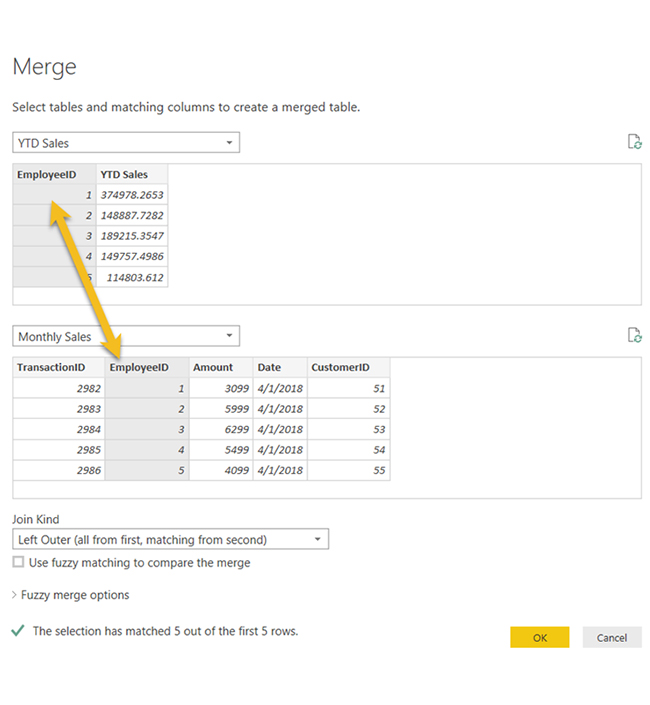
Navigate to the Query Editor, right-click on the left side, and select New Query —> Merge as New.

Navigate to Query Editor for Doing Power BI Join Tables

Choose the tables you want to merge, and select the corresponding parent key and foreign key columns. Also, select the type of join as well. It could be Left Outer, Right Outer, Full Outer, Inner, Left Anti, and Right Anti.

Select Type of Join for Doing Power BI Join Tables

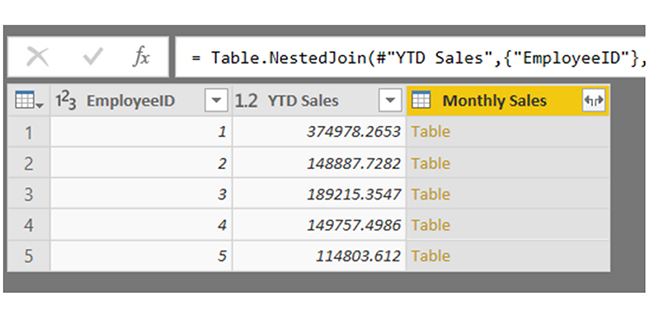
After selecting OK, a new query will appear with the selected tables merged. To see everything, expand the ‘right’ side of the table.

Expand Right Side of Table for Doing Power BI Join Tables

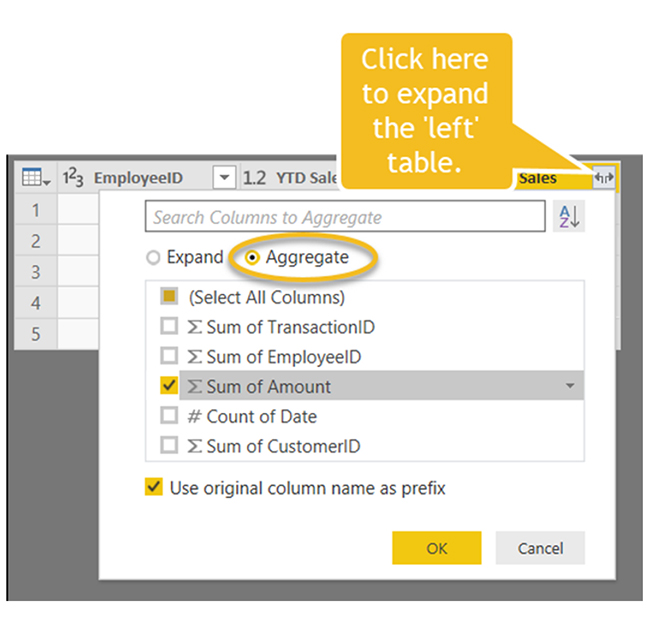
To aggregate the ‘right’ table values, click the “Aggregate” radio button and select “Sum of Amount.”

Aggregate Right Table Values for Doing Power BI Join Tables

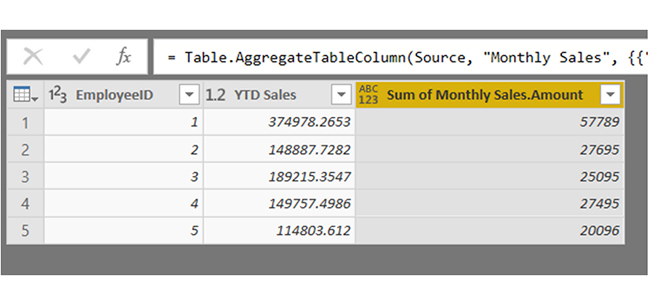
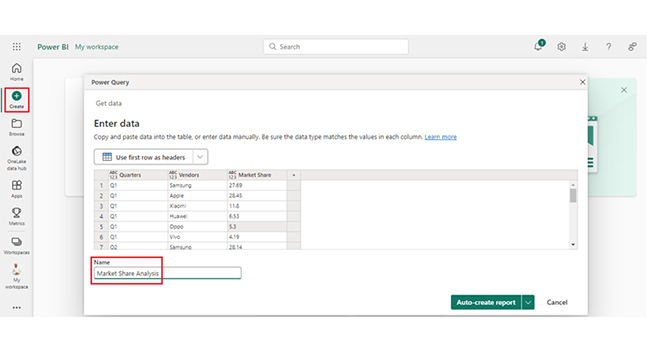
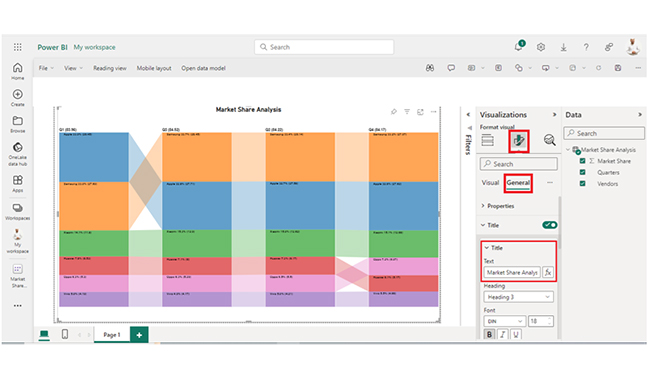
A table similar to the one below appears on your screen.

Table Similar one will Appear for Doing Power BI Join Tables

Mastering Table Joins in Power BI for Clearer Data Visuals

Stage 1: Log into Power BI, enter your email, and click “Submit.”

  • Log in to Power BI.
  • Enter your email address and click the “Submit” button.
Enter email to login to Power BI
  • You are redirected to your Microsoft account.
  • Enter your password and click “Sign in“.
Enter Password to login to Power BI
  • You can choose whether to stay signed in.
Click on stay signed in
  • Once done, the Power BI home screen will open.

Stage 2: Create a Data Set and Select the Data Set to Use in the Sankey Chart

  • Go to the left-side menu and click the “Create” button.
  • Select “Paste or manually enter data“.
select Paste or manually enter data in Power BI ce487
  • We’ll use the sample data below for this example.
Quarters Vendors Market Share
Q1 Samsung 27.69
Q1 Apple 28.45
Q1 Xiaomi 11.8
Q1 Huawei 6.53
Q1 Oppo 5.3
Q1 Vivo 4.19
Q2 Samsung 28.14
Q2 Apple 27.58
Q2 Xiaomi 12.62
Q2 Huawei 6.17
Q2 Oppo 5.5
Q2 Vivo 4.21
Q3 Samsung 28.45
Q3 Apple 27.71
Q3 Xiaomi 12.9
Q3 Huawei 6
Q3 Oppo 5.29
Q3 Vivo 4.17
Q4 Samsung 27.97
Q4 Apple 27.62
Q4 Xiaomi 12.68
Q4 Huawei 5.17
Q4 Oppo 6.07
Q4 Vivo 4.66
  • Paste the data table above into the “Power Query” window and name it “Market Share Analysis.” After that, select the “Create a dataset only” option.
Select Create a Dataset Only for Doing Power BI Join Tables
  • Navigate to the left-side menu, and click on the “Data Hub” option. Power BI will populate the data set list. If no data set has been created, you’ll get an error message.
Click Data Hub Option for Doing Power BI Join Tables
  • Click on “Create report.”
Click on Create Report for Doing Power BI Join Tables
  • Click on Market Share Analysis.
Click on Market Share Analysis for Doing Power BI Join Tables
  • Click on “Expand All.”
Click on Expand All for Doing Power BI Join Tables
  • After clicking on “Expand All,” you’ll see the chart metrics.
See Chart Metrics for Doing Power BI Join Tables
  • Click on “Get more visuals.”
Click on Get More Visuals for Doing Power BI Join Tables
  • You can search ChartExpo and select the Comparison Bar Chart.
Search ChartExpo and Select Comparison Bar Chart for Doing Power BI Join Tables
  • Click on “Add.”
Click on Add Button for Doing Power BI Join Tables
  • After that, you’ll see the Comparison Bar Chart in the visuals list.
See Comparison Bar Chart in Visuals List for Doing Power BI Join Tables
  • You can expand the chart space.
Expand Chart Space for Doing Power BI Join Tables
  • After that, you can select the metrics of the data.
Select Metrics of Data for Doing Power BI Join Tables
  • Click on the second icon of Format Visuals and click on Visual.
Click on Visual for Doing Power BI Join Tables
  • In Visual, click on License Settings and add the key. After adding a key, you’ll see the comparison bar chart.
Click License Key for Doing Power BI Join Tables
  • To add the header text, click on the General tab. After that, add the header text in Title.
Add Header Text for Doing Power BI Join Tables
  • Here’s the final look at the Comparison Bar Chart in Power BI.
Final Power BI Join Tables

Insights

  • Apple and Samsung are the top two vendors in terms of market share, with Samsung taking the lead.
  • Huawei has been losing market share, while Xiaomi has been gaining market share.
  • Vivo and Oppo have been relatively stable in terms of market share. In the last quarter, there has been a transition between Huawei and Oppo.

Improve Chart Accuracy with Power BI Join Tables:

  1. Open your Power BI Desktop or Web.
  2. From the Power BI Visualizations pane, expand three dots at the bottom and select “Get more visuals”.
  3. Search for “Comparison Bar Chart by ChartExpo” on the AppSource.
  4. Add the custom visual.
  5. Select your data and configure the chart settings to create the chart.
  6. Customize your chart properties to add header, axis, legends, and other required information.
  7. Share the chart with your audience.

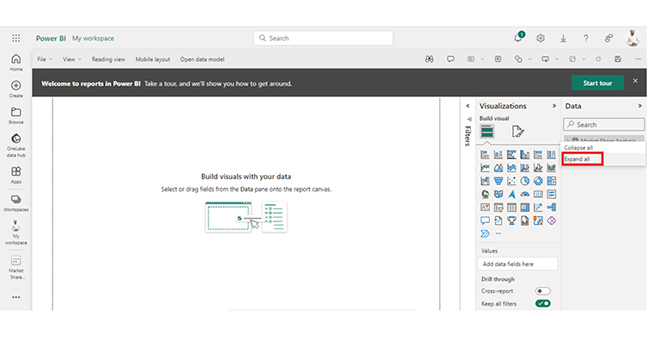
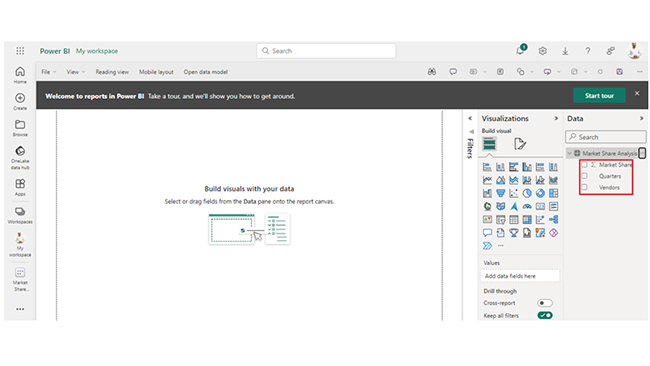
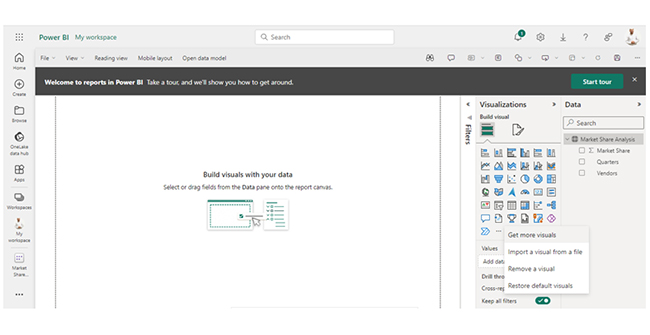
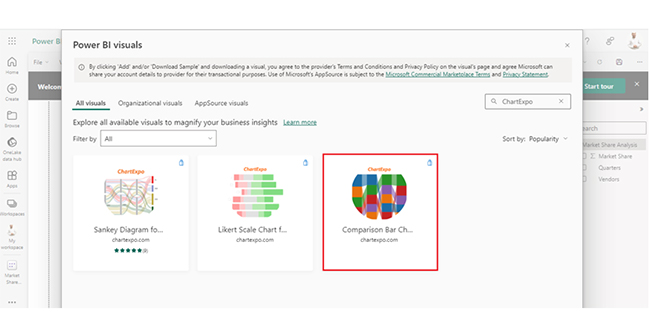
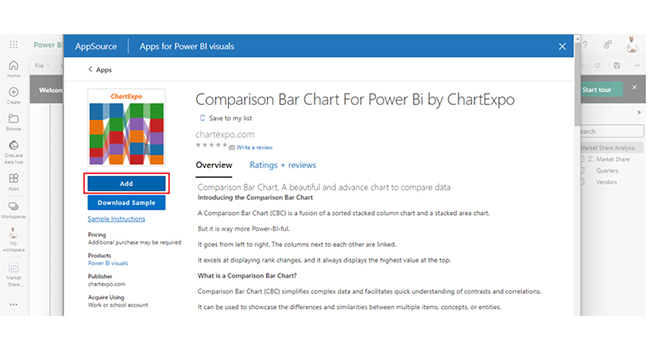
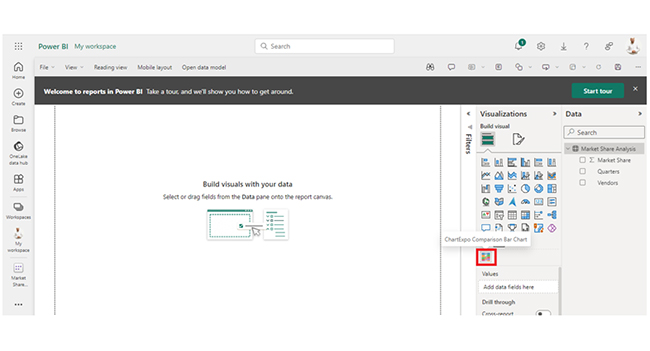
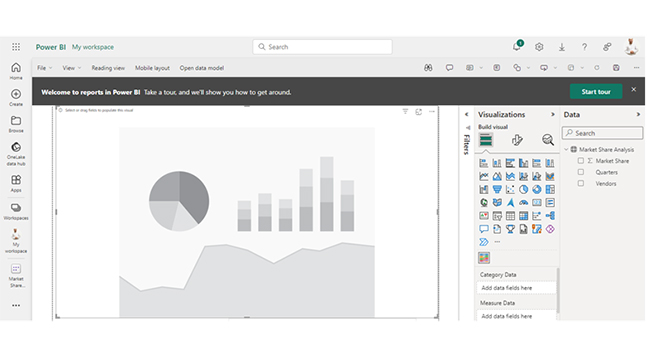
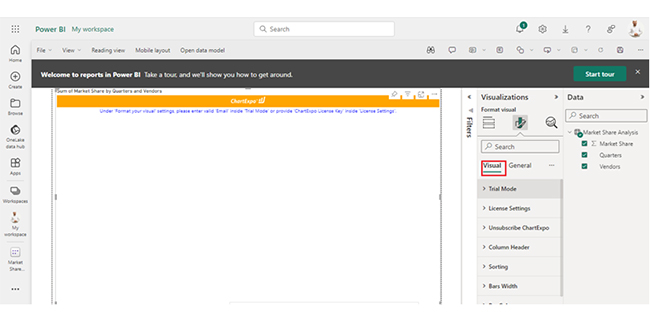
The following video will help you create a Comparison Bar Chart in Microsoft Power BI.

What are the Advantages of Merging Two Tables in Power BI?

  • Comprehensive Analysis: Combining data gives room for comprehensive analysis. That involves consolidating data into a single dataset to enable users to analyze and visualize all relevant information.
  • Data Consistency: Merging tables eliminates the need to manage separate datasets, and also reduces the risk of discrepancies and errors. This ascertains data consistency.
  • Streamlined Reporting: Merged tables facilitate streamlined reporting, and that helps users create dashboards and reports using a unified dataset. This simplifies the reporting process.
  • Relationships: Merging tables give users room to establish relationships between related data fields. It facilitates advanced analysis, filtering, and drilling down into data hierarchies.
  • Enhanced Insights: Merging tables enables users to uncover insights that may not be apparent when analyzing individual datasets separately. This will, in turn, lead to deeper understanding and data-driven decision-making.

What are the Best Practices for Joining Two Tables in Power BI?

  • Understand Data Relationships: You need to figure out the relationships between the tables and the key fields that establish these relationships.
  • Choose the Right Join Type: Choose a join type based on the desired outcome and the relationship between the tables.
  • Use Unique Keys: Join tables on unique keys or fields that guarantee a one-to-many or one-to-one relationship. This ascertains accurate and reliable results.
  • Keep Data Model Simple: Do not create complex data models with unnecessary joins. Keep your data model as simple as possible while ensuring it meets reporting and analysis requirements.
  • Apply Filtered Joins: Before joining large tables, consider applying filters to reduce the size of the tables. This will, in turn, improve performance and efficiency.
  • Validate Results: To ascertain accuracy and completeness, you must validate the join’s results. Use test scenarios (or sample data) to verify that the join produces the expected outcome.

FAQs

How do I join two unrelated tables in Power BI?

Start by creating a relationship between the two unrelated tables based on a common field or use a DAX function like CROSSJOIN to generate all possible combinations.

How do I join two tables in DAX?

To join two tables in DAX, use functions like RELATED, LOOKUPVALUE, RELATEDTABLE, or CROSSJOIN. Your choice will be dependent on the relationship between the tables and the desired outcome.

What are the 5 different types of table joins?

The five different types of table joins are: inner join, left (outer) join, right (outer) join, full (outer) join, and cross join. Each of these serves different purposes in combining data.

Wrap Up

Power BI join tables involve combining data from multiple tables based on common fields (or keys). It allows users to merge related data sets into a single dataset, and also enables comprehensive analysis, visualization, and insights.

With Power BI join tables, users are allowed to establish relationships between tables for more robust data analysis.

To get the most out of the Power BI join tables, you have to document join logic, handle null values, and optimize performance. The logic behind each join should be documented. And that includes the reason for choosing a specific join type and the fields used for joining. All these help facilitate understanding and collaboration among team members.

You need to handle null values so as to avoid unexpected results (or errors) in the analysis.

Now you know what the Power BI join tables are, how will you integrate them into your data analysis (and visualization) process?

How much did you enjoy this article?

PBIAd1
Start Free Trial!
147045

Related articles

next previous
Power BI12 min read

Power BI Group By Guide for Effective Data Insights

Learn how Power BI Group By helps you aggregate data, clarify trends, and create reports by grouping values to make large datasets manageable & insightful.

Power BI12 min read

How to Create Sankey Diagram in Microsoft Power BI?

Learn How to Create Sankey Diagram in Microsoft Power BI using Desktop & Web Service. What they are and how to use them effectively.

Power BI8 min read

Power BI Artificial Intelligence: Insights Using Visuals

Discover all there is to know about the Power BI artificial intelligence. You'll also discover how AI is used in Power BI, and how to use it for analysis and more.

Power BI9 min read

Budgeting in Healthcare: Use Visuals to Spot Budget Gaps

This guide helps you discover what budgeting in healthcare is. You'll also discover the factors that affect hospital budgets and types of budgeting in healthcare.

Power BI9 min read

Predictive Analytics in Power BI for Making Insightful Visuals

This guide shows you everything you need to know about Predictive Analytics in Power BI. It also shows you how it works, and how to interpret the results.

ChartExpo logo

Turn Data into Visual
Stories

CHARTEXPO

  • Home
  • Gallery
  • Videos
  • Services
  • Pricing
  • Contact us
  • FAQs
  • Privacy policy
  • Terms of Service
  • Sitemap

TOOLS

  • ChartExpo for Google Sheets
  • ChartExpo for Microsoft Excel
  • Power BI Custom Visuals by ChartExpo
  • Word Cloud

CATEGORIES

  • Bar Charts
  • Circle Graphs
  • Column Charts
  • Combo Charts
  • Comparison Charts
  • Line Graphs
  • PPC Charts
  • Sentiment Analysis Charts
  • Survey Charts

TOP CHARTS

  • Sankey Diagram
  • Likert Scale Chart
  • Comparison Bar Chart
  • Pareto Chart
  • Funnel Chart
  • Gauge Chart
  • Radar Chart
  • Radial Bar Chart
  • Sunburst Chart
  • see more
  • Scatter Plot Chart
  • CSAT Survey Bar Chart
  • CSAT Survey Chart
  • Dot Plot Chart
  • Double Bar Graph
  • Matrix Chart
  • Multi Axis Line Chart
  • Overlapping Bar Chart
  • Control Chart
  • Slope Chart
  • Clustered Bar Chart
  • Clustered Column Chart
  • Box and Whisker Plot
  • Tornado Chart
  • Waterfall Chart
  • Word Cloud
  • see less

RESOURCES

  • Blog
  • Resources
  • YouTube
SIGN UP FOR UPDATES

We wouldn't dream of spamming you or selling your info.

© 2025 ChartExpo, all rights reserved.