• Home
  • Tools dropdown img
    • Spreadsheet Charts

      • ChartExpo for Google Sheets
      • ChartExpo for Microsoft Excel
    • Power BI Charts

      • Power BI Custom Visuals by ChartExpo
    • Word Cloud

  • Charts dropdown img
    • Chart Category

      • Bar Charts
      • Circle Graphs
      • Column Charts
      • Combo Charts
      • Comparison Charts
      • Line Graphs
      • PPC Charts
      • Sentiment Analysis Charts
      • Survey Charts
    • Chart Type

      • Box and Whisker Plot
      • Clustered Bar Chart
      • Clustered Column Chart
      • Comparison Bar Chart
      • Control Chart
      • CSAT Survey Bar Chart
      • CSAT Survey Chart
      • Dot Plot Chart
      • Double Bar Graph
      • Funnel Chart
      • Gauge Chart
      • Likert Scale Chart
      • Matrix Chart
      • Multi Axis Line Chart
      • Overlapping Bar Chart
      • Pareto Chart
      • Radar Chart
      • Radial Bar Chart
      • Sankey Diagram
      • Scatter Plot Chart
      • Slope Chart
      • Sunburst Chart
      • Tornado Chart
      • Waterfall Chart
      • Word Cloud
    • Google Sheets
      Microsoft Excel
  • Services
  • Pricing
  • Contact us
  • Blog
  • Support dropdown img
      • Gallery
      • Videos
      • Contact us
      • FAQs
      • Resources
    • Please feel free to contact us

      atsupport@chartexpo.com

Categories
All Data Visualizations Data Analytics Surveys
Add-ons/
  • Google Sheets
  • Microsoft Excel
  • Power BI
All Data Visualizations Data Analytics Surveys
Add-ons
  • Google Sheets
  • Microsoft Excel
  • Power BI

We use cookies

This website uses cookies to provide better user experience and user's session management.
By continuing visiting this website you consent the use of these cookies.

Ok

ChartExpo Survey


Home > Blog > Power BI

Power BI and Jira: The Ultimate Guide to Data Integration

As a data analyst (or business analyst), you may have come across Power BI and Jira. Power BI is a data visualization platform where interactive charts, reports, and dashboards can be created using multiple data sources. Jira, on the other hand, is one of the best project management solutions out there.

Power BI and Jira

If your team uses both Power BI and Jira, it probably means that you understand the role data reporting plays in business expansion. In this guide, you’ll discover why you should connect Jira to Power BI, easy ways to export and visualize Jira data to Power BI, and more.

Table of Contents:

  1. What is the Power BI Connector for Jira?
  2. Why Do We Connect Jira to Power BI?
  3. How Do You Connect Jira and Power BI?
  4. How to Visualize Jira Data to Power BI?
  5. What is the Best Practice for the Power BI Jira Connector?
  6. Wrap Up

First…

What is the Power BI Connector for Jira?

Power BI Connector for Jira integrates Microsoft Power BI with Jira, and that helps users analyze and visualize Jira data within the Power BI platform. It gives room for the seamless extraction of data from Jira and also facilitates the creation of custom dashboards and reports that monitor multiple project metrics like team performance and issue tracking.

The connector supports automated data refreshes that keep reports up-to-date. It also leverages Power BI’s advanced data analytics for in-depth data analysis. The tool is easy to use, and the setup and configuration processes are simplified. All these make it a good fit for users without extensive technical knowledge.

Why Do We Connect Jira to Power BI?

Here are the major benefits of connecting Jira to Power BI.

  • Comprehensive Reporting: The integration of Jira with Power BI gives room for customized and detailed reports. It helps your team visualize project progress, monitor performance metrics, and track issues more insightfully. It does a better job than Jira’s built-in reporting tools.
  • Data Consolidation: Power BI can combine data from multiple sources. Organizations that integrate Jira data with other business data (like HR, CRM, and financials) will gain a holistic view of their operations and will be able to figure out correlations and insights that might be missed when the data is siloed.
  • Advanced Analytics: Power BI comes with advanced analytical capabilities like predictive analytics, complex data modeling, and AI-driven insights that can be applied to Jira data. It helps teams to forecast potential issues, identify trends, and optimize project workflows.
  • Interactive Dashboards: Power BI is built with interactive dashboards that help users drill down into data and dynamically filter information. It also helps the users explore various aspects of their projects. The interactive dashboard helps users to make data-driven decisions, and also get more hold over their projects.
  • Automated Data Refresh: The automated data refresh feature ascertains that the Power BI dashboards and reports reflect the most current data from Jira. It ensures real-time project status and eliminates the need for manual data updates.
  • Enhanced Collaboration: Sharing Power BI reports and dashboards with stakeholders facilitates better communication and promotes transparency across the organization and within teams. This way, everyone will be informed about the project’s challenges and progress.

How Do You Connect Jira and Power BI?

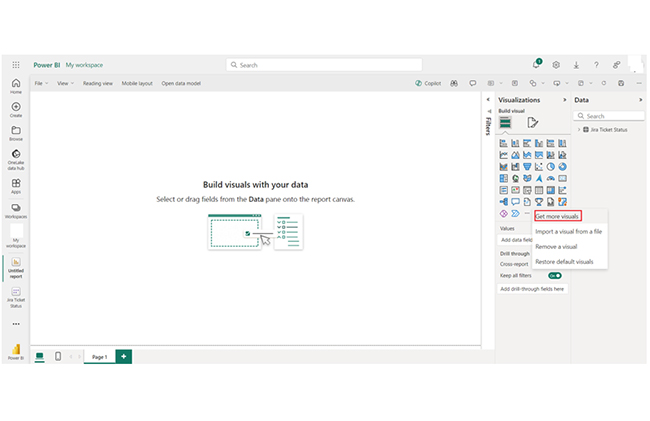
Here’s a 3-step walkthrough to help you connect Jira and Power BI.
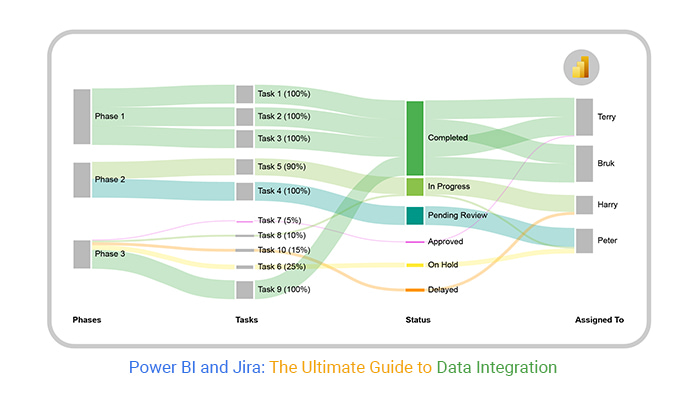
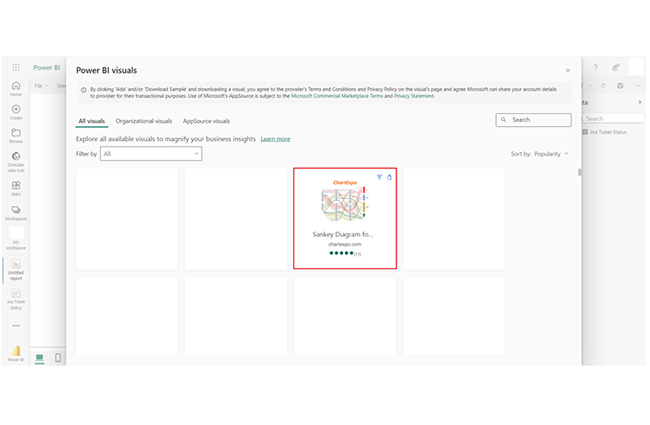
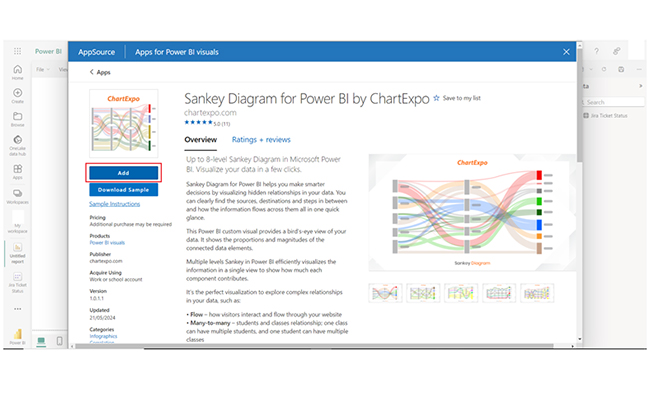
  1. Navigate to the Atlassian Marketplace. After that, download and install Appfire’s Power BI Jira Connector.
Download and Install Appfire Power BI and Jira Connector
  1. Create a unique connector URL within the Jira instance to automate the flow of data into Power BI.
Create a Unique Connector URL for Connecting Power BI and Jira
    • Copy the connector URL from Jira to Power BI Jira Connector. You’ll find that in the “My Connector URLs” tab.
Copy the connector URL from Jira to Power BI and Jira Connector
  1. Open Power BI and click on OData feed to add the unique URL to import Jira data into Power BI.
Unique URL to Import Jira data by Power BI and Jira Connector
    • The Power BI Jira Connector will use the OData protocol to import the Jira data. After setting up the Power BI Jira Connector, you’ll be able to access the imported fields and start updating and creating reports.
    • Teams and stakeholders can review the Jira issue data that are available in Power BI.
Teams and Stakeholders Review Jira Issue Data by Power BI and Jira Connector

How to Visualize Jira Data to Power BI?

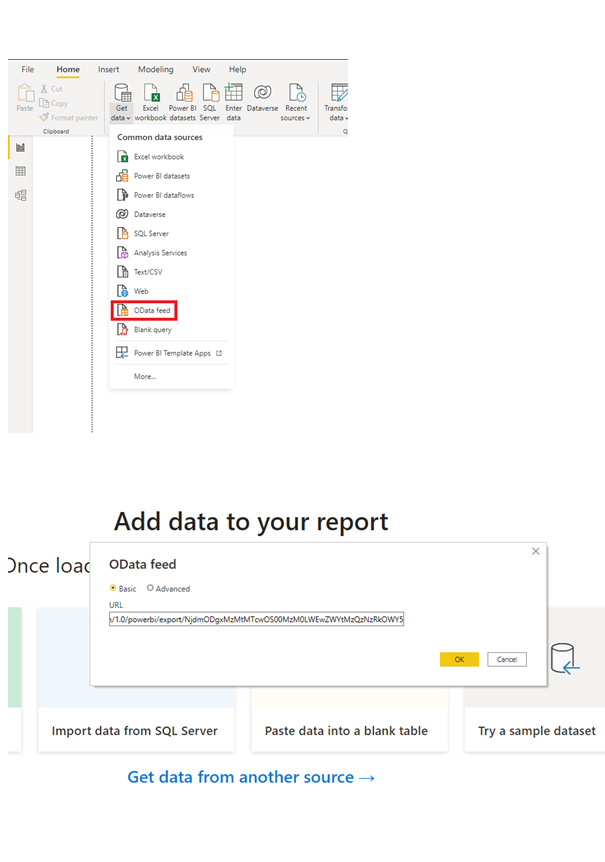
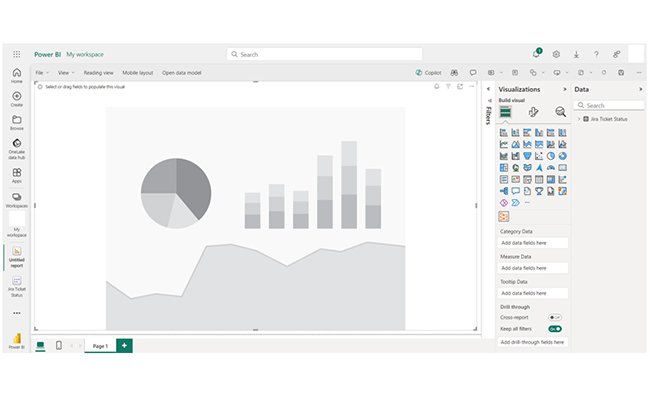
Stage 1: Logging in to Power BI
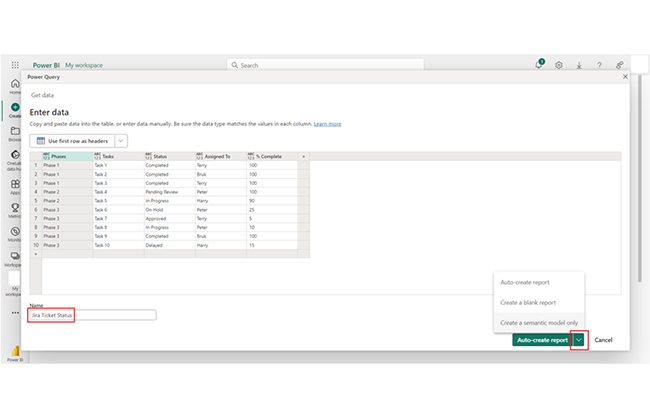
  • Log in to Power BI.
  • Enter your email address and click the “Submit” button.
Enter email to login to Power BI
  • You are redirected to your Microsoft account.
  • Enter your password and click “Sign in“.
Enter Password to login to Power BI
  • You can choose whether to stay signed in.
Click on stay signed in
  • Once done, the Power BI home screen will open.

Stage 2: Creating a Data Set and Selecting the Data Set to Use in Your Chart

  • Go to the left-side menu and click the “Create” button.
  • Select “Paste or manually enter data“.
select Paste or manually enter data in Power BI ce487
  • We’ll use the sample data below for this example.
Phases Tasks Status Assigned To % Complete
Phase 1 Task 1 Completed Terry 100
Phase 1 Task 2 Completed Bruk 100
Phase 1 Task 3 Completed Terry 100
Phase 2 Task 4 Pending Review Peter 100
Phase 2 Task 5 In Progress Harry 90
Phase 3 Task 6 On Hold Peter 25
Phase 3 Task 7 Approved Terry 5
Phase 3 Task 8 In Progress Peter 10
Phase 3 Task 9 Completed Bruk 100
Phase 3 Task 10 Delayed Harry 15
  • Paste the data table above into the “Power Query” window. Next, choose the “Create a semantic model only” option.
Choose a Semantic Model Only After Connecting Power BI and Jira
  • Navigate to the left-side menu, and click “Data Hub.” Power BI will populate the data set list. But if no data set has been created, you’ll get an error message. Next, click “Create report.”
Click Create Report After Connecting Power BI and Jira
  • Click “Get more visuals.”
Click Get More Visuals After Connecting Power BI and Jira
  • Search ChartExpo and select “Sankey Chart.”
Select Sankey Chart After Connecting Power BI and Jira
  • Click “Add.”
Click Add After Connecting Power BI and Jira
  • You’ll see the Sankey Chart in the visuals list.
See Sankey Chart in Visuals List After Connecting Power BI and Jira
  • Navigate to visuals, and click on the License Settings. After that, add the key.
Click on License Settings After Connecting Power BI and Jira
  • After adding the key, you’ll see the Sankey Chart.
Add License Key see Sankey Chart After Connecting Power BI and Jira
  • Here’s how to add the header text at the top of the chart.
Add Header Text After Connecting Power BI and Jira
  • There’s the option to change the Level 1 Stats.
Change Level 1 Stats After Connecting Power BI and Jira
  • You can change the Level 2 Stats.
Change Level 2 Stats After Connecting Power BI and Jira
  • You can change the Level 3 Stats.
Change Level 3 Stats After Connecting Power BI and Jira
  • You can change the Level 4 Stats.
Change Level 4 Stats After Connecting Power BI and Jira
  • Here’s how to change the percentage sign with values.
Change Percentage Sign with Values After Connecting Power BI and Jira
  • There’s the option of adding the color of level three nodes.
Adding Color of Level Three Nodes After Connecting Power BI and Jira
  • Here’s the final image of the Sankey Chart.
Final Power BI and Jira

Insights

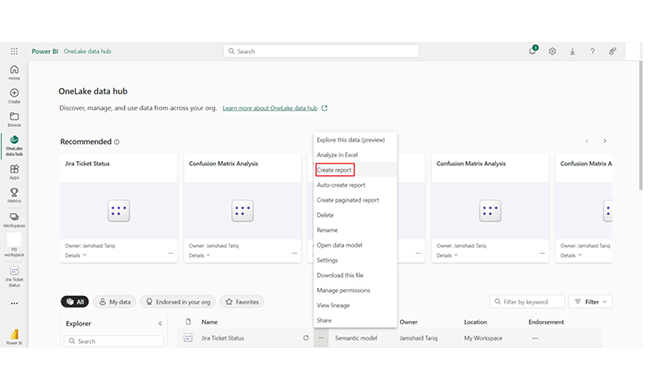
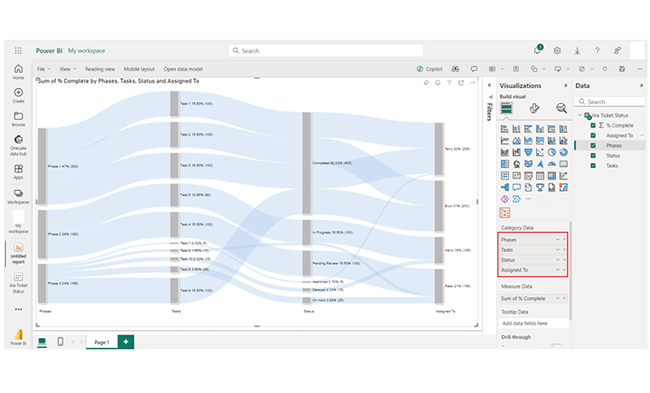
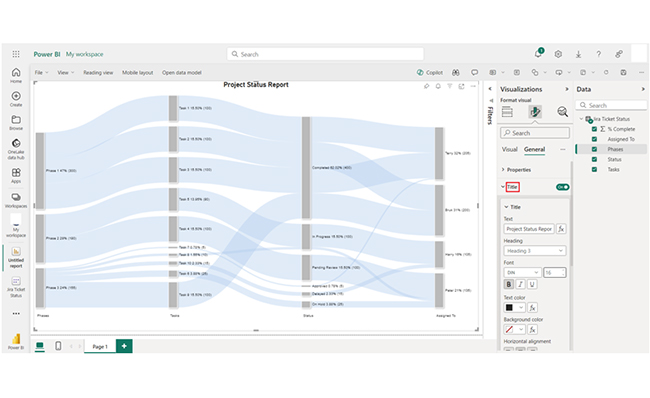
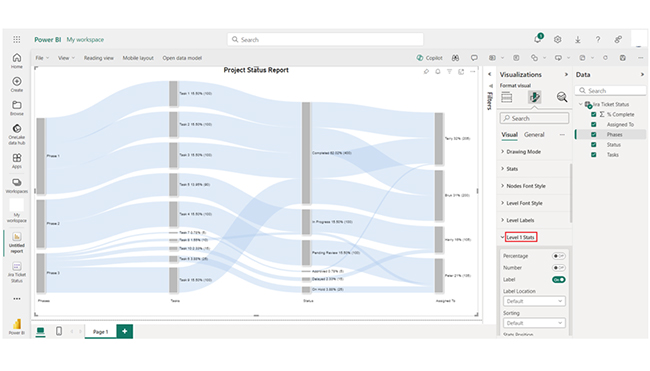
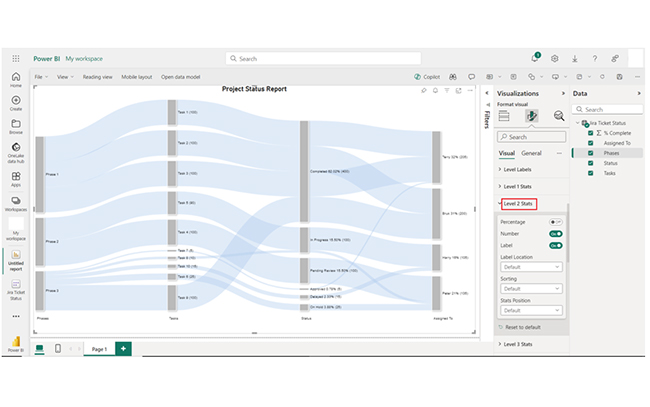
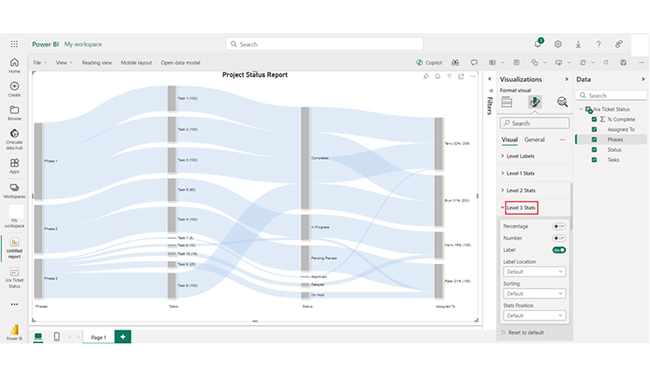
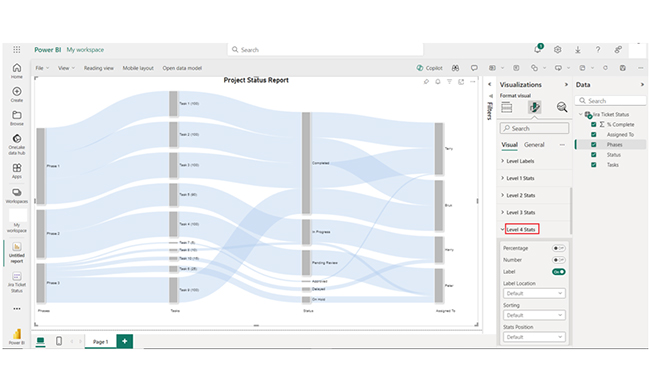
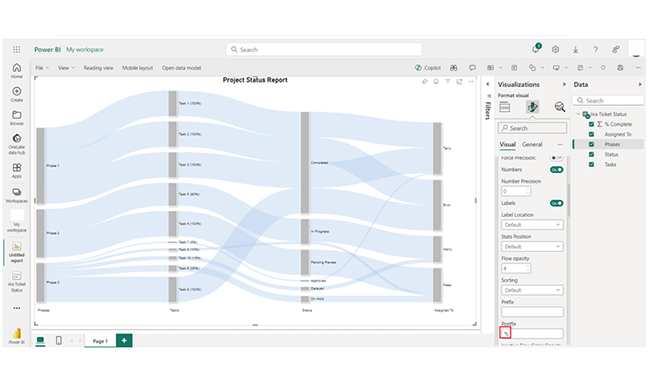
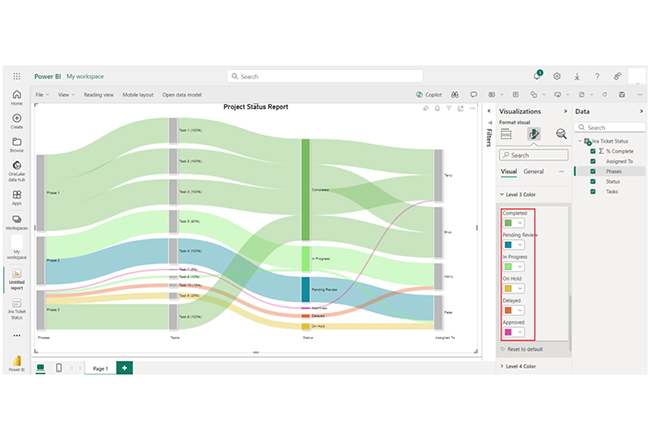
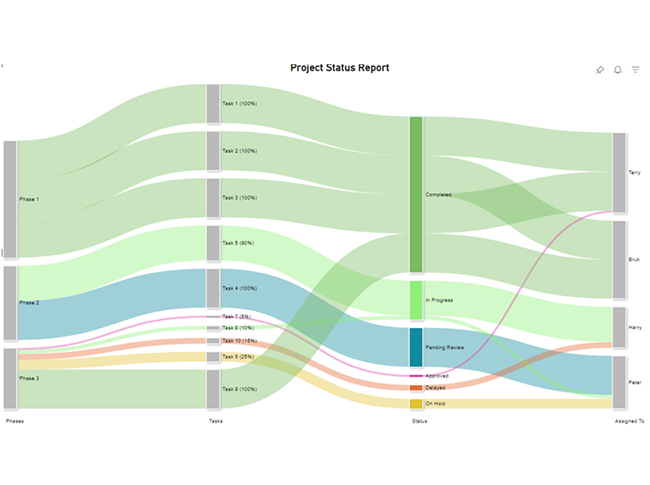
From the chart, you’ll see the three phases of tasks with varied statuses. Phase 1 has been fully completed. Phase 2 has tasks either pending review or in progress. Phase 3 has a mix of statuses that includes approved, on hold, delayed, in progress, and the completed one.

Visualize Project Insights with Power BI and Jira Through Charts and Graphs:

Gain valuable insights into your project management processes by combining Power BI and Jira in this hands-on tutorial. Using dynamic charts and graphs, you can analyze team performance, track issue resolutions, and monitor sprint progress with ease. Whether you’re identifying workflow bottlenecks, evaluating task completion rates, or visualizing project timelines, these tools transform Jira data into actionable insights. Mastering this integration allows you to uncover trends, enhance collaboration, and optimize project outcomes. With intuitive visuals and customized dashboards, Power BI and Jira empower you to make informed decisions, drive efficiency, and tell the story of your project’s success.

What is the Best Practice for the Power BI Jira Connector?

Here are some best practices you should keep in mind when using the Power BI Jira connector.

  • Understand Your Data Needs

You need to identify the key metrics and KPIs needed. You also have to define the scope of data to be extracted from Jira. That could be projects, custom fields, or issues.

  • Data Preparation and Cleaning

The data has to be clean and well-organized before you can integrate it with Power BI. You should use Jira’s filters and queries to extract necessary data. This will help reduce unnecessary data load.

  • Security and Permissions

The data access permissions in Jira have to be properly configured and aligned with Power BI. Use secure credentials and always follow the data security policies of your organization. This will help protect sensitive information.

  • Efficient Data Modeling

You have to come up with a robust data model in Power BI that can accommodate the structure of the Jira data. Take advantage of Power BI’s data modeling capabilities to create relationships, measures, and calculated columns.

  • Scheduled Data Refreshes

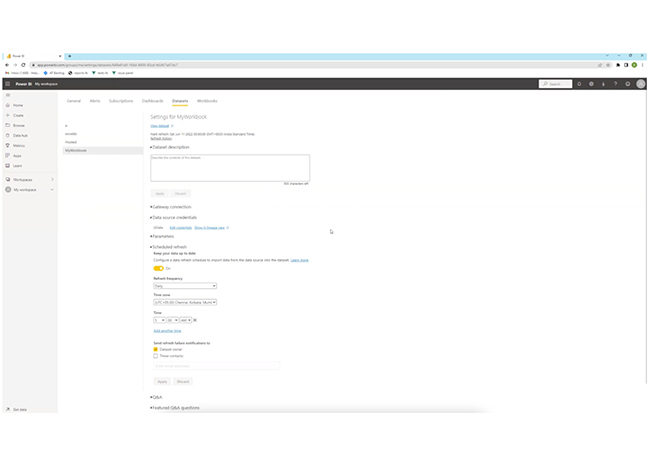
If you want to keep your dashboards and reports up-to-date, you’ll have to set up automated data refresh schedules. The refresh frequency has to align with your reporting needs, and the data update frequency in Jira.

  • Performance Optimization

Aggregations, data compression, and other Power BI performance optimization features can be used to enhance report performance. Always filter and limit the amount of data imported to Power BI to avoid performance bottlenecks.

FAQs

What is the difference between Power BI and Jira?

Power BI is a business intelligence and data visualization tool, while Jira is a project management and issue-tracking software. Jira manages tasks and projects, while Power BI analyzes data.

How to extract data from Jira to Power BI?

To extract data from Jira to Power BI, you’ll have to use the Power BI Connector for Jira to configure data sources. You’ll also need to set up queries and import Jira data directly into the Power BI for analysis.

Is the Power BI connector for Jira free?

No, the Power BI connector for Jira is not free. It requires a subscription or purchase.

Wrap Up

The Power BI Connector for Jira performs advanced analysis and reporting by integrating data into Power BI. Connecting Power BI and Jira gives room for comprehensive performance tracking, project insights, and interactive, up-to-date dashboards.

To get the most out of the Power BI and Jira connection, you’ll have to regularly monitor the usage and performance of the Power BI reports. You also have to maintain and update your Power BI reports and models as your Jira reporting and data needs evolve.

Furthermore, you’ll have to document the key metrics, data model, and data extraction process for future reference. Always offer training to users on how to interact and interpret the Power BI dashboards and reports.

By connecting Jira to Power BI, it becomes easy to track team productivity and performance. It also helps you optimize resource allocation and identify areas for improvement.

How much did you enjoy this article?

PBIAd2
Start Free Trial!
140269

Related articles

next previous
Power BI12 min read

Power BI Group By Guide for Effective Data Insights

Learn how Power BI Group By helps you aggregate data, clarify trends, and create reports by grouping values to make large datasets manageable & insightful.

Power BI12 min read

How to Create Sankey Diagram in Microsoft Power BI?

Learn How to Create Sankey Diagram in Microsoft Power BI using Desktop & Web Service. What they are and how to use them effectively.

Power BI8 min read

Power BI Artificial Intelligence: Insights Using Visuals

Discover all there is to know about the Power BI artificial intelligence. You'll also discover how AI is used in Power BI, and how to use it for analysis and more.

Power BI9 min read

Budgeting in Healthcare: Use Visuals to Spot Budget Gaps

This guide helps you discover what budgeting in healthcare is. You'll also discover the factors that affect hospital budgets and types of budgeting in healthcare.

Power BI9 min read

Predictive Analytics in Power BI for Making Insightful Visuals

This guide shows you everything you need to know about Predictive Analytics in Power BI. It also shows you how it works, and how to interpret the results.

ChartExpo logo

Turn Data into Visual
Stories

CHARTEXPO

  • Home
  • Gallery
  • Videos
  • Services
  • Pricing
  • Contact us
  • FAQs
  • Privacy policy
  • Terms of Service
  • Sitemap

TOOLS

  • ChartExpo for Google Sheets
  • ChartExpo for Microsoft Excel
  • Power BI Custom Visuals by ChartExpo
  • Word Cloud

CATEGORIES

  • Bar Charts
  • Circle Graphs
  • Column Charts
  • Combo Charts
  • Comparison Charts
  • Line Graphs
  • PPC Charts
  • Sentiment Analysis Charts
  • Survey Charts

TOP CHARTS

  • Sankey Diagram
  • Likert Scale Chart
  • Comparison Bar Chart
  • Pareto Chart
  • Funnel Chart
  • Gauge Chart
  • Radar Chart
  • Radial Bar Chart
  • Sunburst Chart
  • see more
  • Scatter Plot Chart
  • CSAT Survey Bar Chart
  • CSAT Survey Chart
  • Dot Plot Chart
  • Double Bar Graph
  • Matrix Chart
  • Multi Axis Line Chart
  • Overlapping Bar Chart
  • Control Chart
  • Slope Chart
  • Clustered Bar Chart
  • Clustered Column Chart
  • Box and Whisker Plot
  • Tornado Chart
  • Waterfall Chart
  • Word Cloud
  • see less

RESOURCES

  • Blog
  • Resources
  • YouTube
SIGN UP FOR UPDATES

We wouldn't dream of spamming you or selling your info.

© 2025 ChartExpo, all rights reserved.