Categories
How to Create a Free Survey unlocks the door to powerful insights without breaking the bank.
Imagine gathering valuable data about your customers, audience, or research topic, all within a user-friendly online platform – for free!


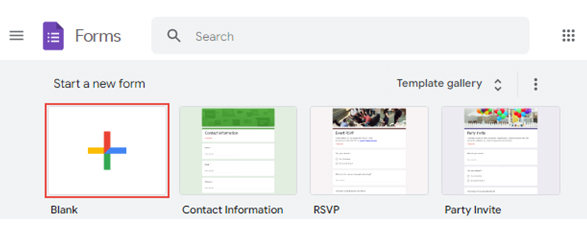
First stop, internet exploration: dig into the plethora of survey platforms like Google Forms, SurveyMonkey, and Typeform. These user-friendly wizards do the heavy lifting, leaving your brain cells unscathed.
Customization?
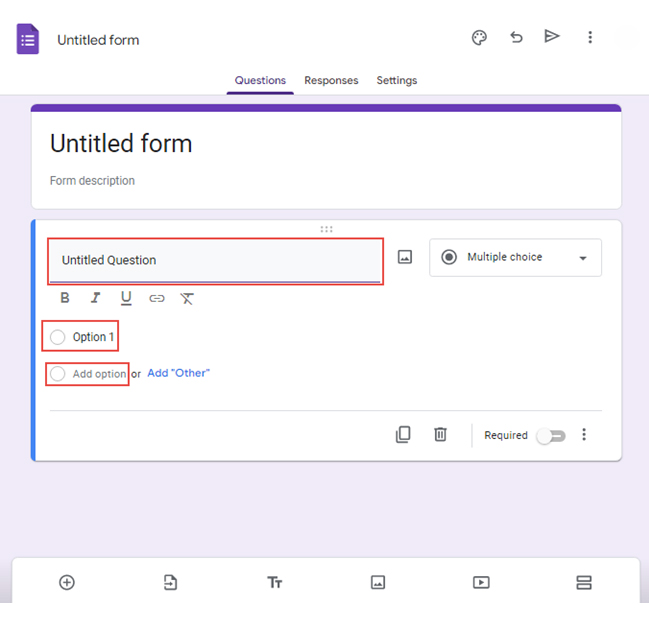
Oh, it’s on the menu. Pick question types like multiple choice, checkboxes, or text fields. Then spice things up with some eye-catching design elements. A dash of color here, a snazzy font there – make it visually appealing.
Design prowess?
Not mandatory – templates galore await your trembling mouse cursor.
Sharing?
A piece of cake. Link-share via email, social media, or embed it on your website: the more responses, the merrier.
How do you go about creating a free survey?
Let me guide you.
A survey is a structured tool for gathering information and opinions from people. It involves asking questions to collect data on a specific topic. Surveys can be created through various mediums, like paper forms or online platforms. The collected responses are then analyzed to draw conclusions or make informed decision-making based on the gathered information.
Choosing the best online free survey generator involves considering various factors. Here’s an evaluation under specific headings:
When assessing a survey generator, examine the features offered within its free plan. Look for capabilities such as the number of surveys you can create, the size of the respondent pool, and any limitations on question types. The best platforms provide robust functionality even in their free versions.
The usability of the survey generator is crucial. Clear menus, drag-and-drop simplicity, and helpful instructions – does this platform empower anyone to design impactful surveys? Look for tools that feel less like software and more like an extension of your creative thinking.
Aesthetic appeal and professional-looking surveys can enhance respondent engagement. Consider the design options and templates available in the survey generator, including a survey template in Excel for added flexibility. These platforms offer design elements that let you weave your brand’s story into every question, creating surveys that are as consistent as they are captivating.
A versatile survey generator should support various question types and logic features. Assess the platform’s ability to handle multiple-choice questions, open-ended responses, 4-point Likert scale rating questions, and conditional logic. The best tools provide a range of question options and logic functionalities to cater to diverse survey needs.
Choose platforms that offer flexible export options in diverse formats, letting you unleash your findings to power presentations, reports, and beyond. The best platforms support longitudinal survey design, empowering users to analyze survey results effectively and facilitating informed decision-making.
Here are some of the best free survey makers. These platforms make designing, distributing, and survey data analysis in Excel easy without breaking the bank.
A widely used and versatile option, Google Forms offers an intuitive interface. It lets you create surveys with various question types, including multiple-choice, text, and rating scales. You can customize themes, add images, and even collaborate with others in real time. Moreover, it automatically collects responses in Google Sheets, allowing easy analysis.
Microsoft Forms is integrated into the Microsoft 365 suite and caters well to users acquainted with Microsoft’s environment. It presents a variety of question formats and permits the customization of forms through themes and images. It stores responses in Excel, facilitating seamless data analysis. Additionally, it supports collaborative efforts, enabling teamwork among colleagues during the survey creation process.
This platform provides a user-friendly experience with various question types and customization options. Its free version allows you to create surveys with limited questions and responses. You can also access basic analysis tools and export your data. The paid plans offer more advanced features for in-depth insights.
Typeform stands out for its visually appealing and interactive surveys. It focuses on creating engaging user experiences through its conversational format. The free plan includes various question types and customization options. However, it has limitations on the number of questions and responses. Typeform’s interface is modern and user-friendly, making it suitable for creative and engaging surveys.
JotForm offers a user-friendly interface for creating surveys. The free plan allows for unlimited forms and responses, making it suitable for projects with high participation. It provides various question types and includes conditional logic for dynamic survey experiences. Moreover, JotForm provides customization options, and you can export the responses for analysis.
There are several tools available for survey creation. Google Forms stands out as the best option for several reasons;
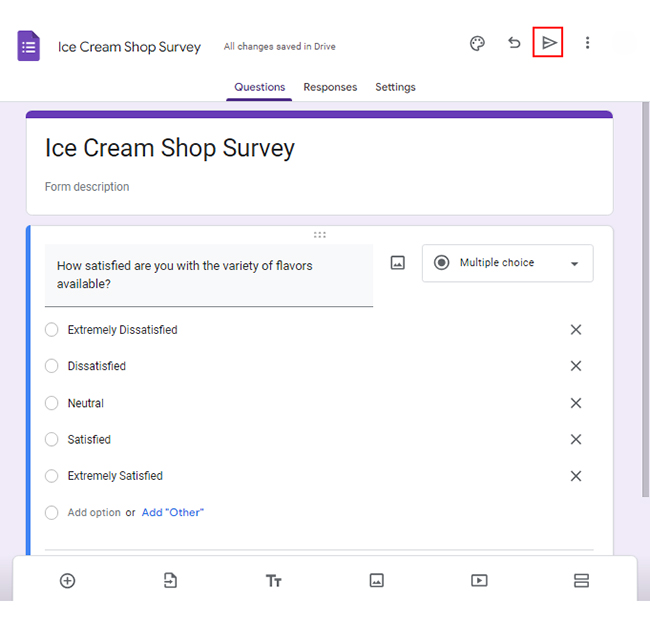
Let’s say you own an ice cream shop. You want to create a customer feedback survey with the following questions.
You want to embed the response scale below on each question:
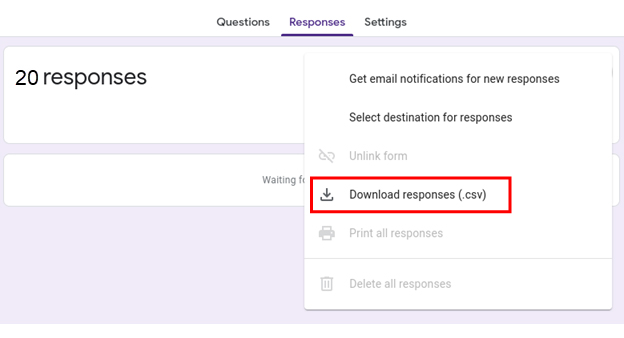
Follow the steps below to create your survey using Google Forms.
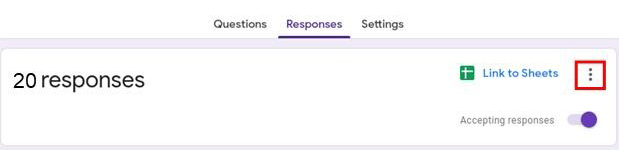
Are you struggling to make sense of the data collected from a free survey?
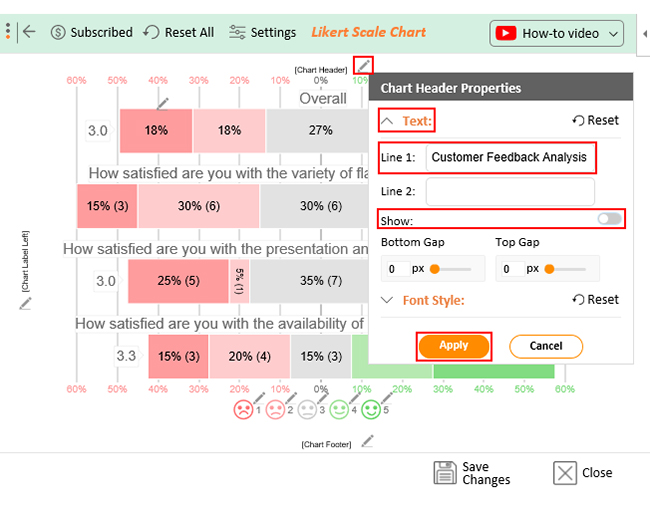
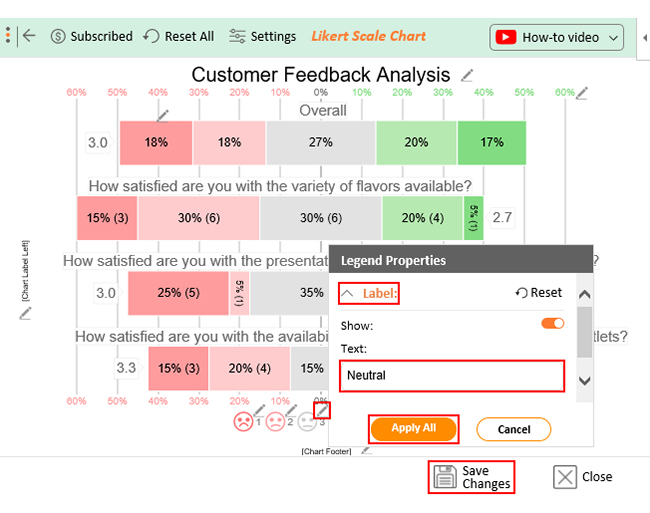
If you’re using Excel, you’re in luck – ChartExpo is here to make your life easier.
ChartExpo is the ultimate solution for transforming survey data into captivating visual representations. With its robust functionality and intuitive design, ChartExpo empowers you to navigate the vast array of features effortlessly. It equips you with a comprehensive toolkit, ensuring you present your findings in their most compelling form.
How to Install ChartExpo in Excel?
ChartExpo charts are available both in Google Sheets and Microsoft Excel. Please use the following CTA’s to install the tool of your choice and create attractive visualizations in a few clicks in your favorite tool.
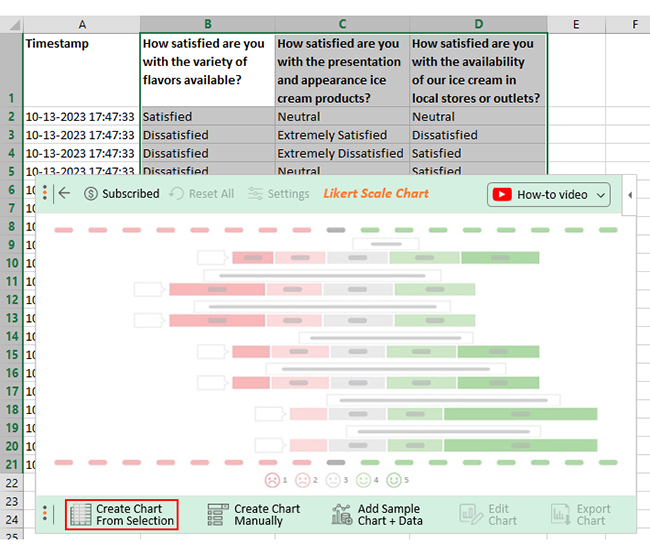
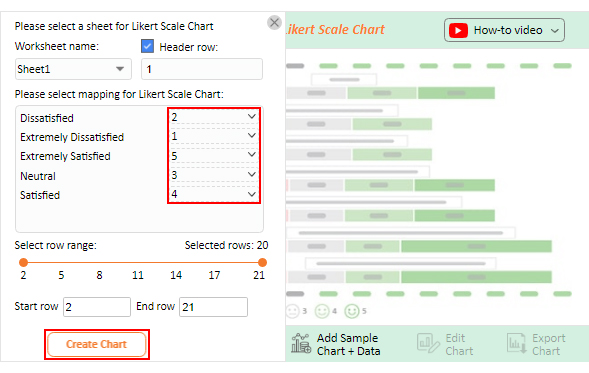
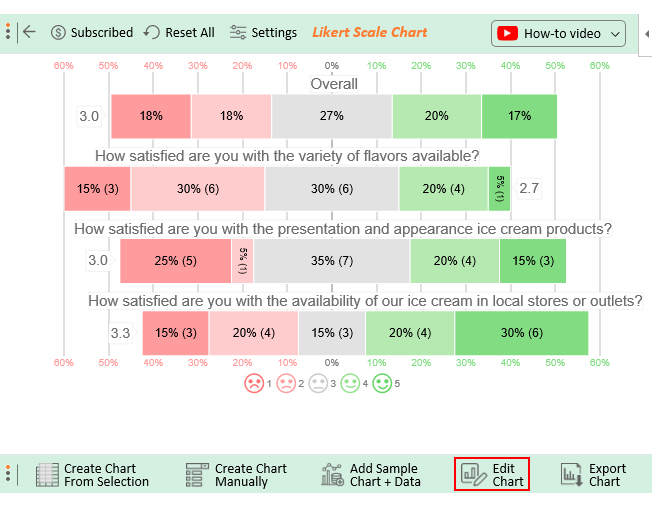
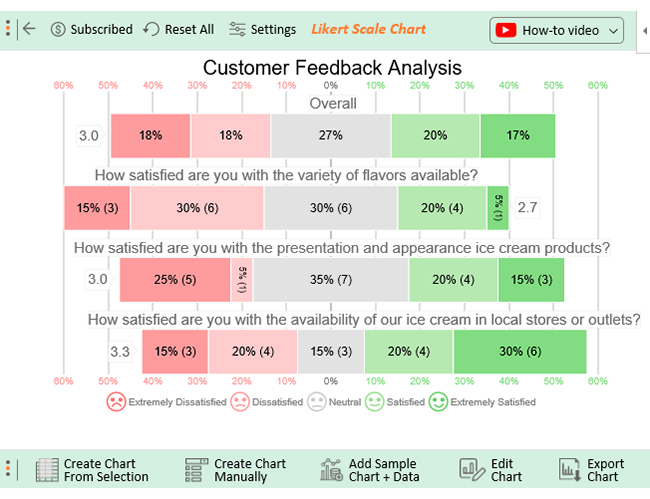
Let’s say your survey yields the data table below.
| Timestamp | How satisfied are you with the variety of flavors available? | How satisfied are you with the presentation and appearance of ice cream products? | How satisfied are you with the availability of our ice cream in local stores or outlets? |
| 10-13-2023 17:47:33 | Satisfied | Neutral | Neutral |
| 10-13-2023 17:47:33 | Dissatisfied | Extremely Satisfied | Dissatisfied |
| 10-13-2023 17:47:33 | Dissatisfied | Extremely Dissatisfied | Satisfied |
| 10-13-2023 17:47:33 | Dissatisfied | Neutral | Satisfied |
| 10-13-2023 17:47:33 | Neutral | Satisfied | Dissatisfied |
| 10-13-2023 17:47:33 | Neutral | Extremely Dissatisfied | Neutral |
| 10-13-2023 17:47:33 | Satisfied | Extremely Satisfied | Satisfied |
| 10-13-2023 17:47:33 | Neutral | Neutral | Neutral |
| 10-13-2023 17:47:33 | Dissatisfied | Neutral | Extremely Satisfied |
| 10-13-2023 17:47:33 | Dissatisfied | Extremely Satisfied | Extremely Dissatisfied |
| 10-13-2023 17:47:33 | Extremely Dissatisfied | Extremely Dissatisfied | Extremely Dissatisfied |
| 10-13-2023 17:47:34 | Neutral | Extremely Dissatisfied | Dissatisfied |
| 10-13-2023 17:47:35 | Dissatisfied | Neutral | Dissatisfied |
| 10-13-2023 17:47:36 | Neutral | Satisfied | Extremely Dissatisfied |
| 10-13-2023 17:47:37 | Satisfied | Dissatisfied | Satisfied |
| 10-13-2023 17:47:38 | Extremely Dissatisfied | Neutral | Extremely Satisfied |
| 10-13-2023 17:47:39 | Extremely Satisfied | Extremely Dissatisfied | Extremely Satisfied |
| 10-13-2023 17:47:40 | Satisfied | Satisfied | Extremely Satisfied |
| 10-13-2023 17:47:41 | Extremely Dissatisfied | Neutral | Extremely Satisfied |
| 10-13-2023 17:47:42 | Neutral | Satisfied | Extremely Satisfied |
This table contains example data. Expect many responses and questions in real life.


While conducting thorough research often comes with a hefty price tag, free surveys offer a surprisingly powerful alternative. Don’t underestimate their potential, for within these cost-effective tools lie a treasure trove of benefits:
No geographical or financial barriers! Online surveys, offered at no cost, democratize the research process, empowering individuals, small businesses, students, and non-profits to access valuable insights. This levels the playing field by providing an opportunity for those with limited resources to harness the power of data through the convenience of the internet.
Online surveys deploy instantly, reaching a global audience in mere minutes. This rapid response time enables you to gather immediate feedback and respond quickly to emerging trends, ensuring that you stay closely attuned to your audience’s preferences.
The ease of online surveys brings joy to respondents, as they have the flexibility to complete surveys at their own pace, using any device, and from any location. This adaptability results in increased engagement and the generation of larger, more inclusive datasets, ultimately enhancing the precision and dependability of your research findings
Forget wrestling with spreadsheets! Numerous no-cost online platforms provide integrated data analysis tools that present results in clear and easily understandable formats. This streamlines the task of identifying trends, drawing conclusions, and conveying insights to stakeholders, ensuring accessibility even for individuals with limited statistical expertise.
Free online surveys offer a low-risk testing ground for your research instruments. Experiment with different question formats, layouts, and distribution channels before investing in paid platforms. This allows you to refine your approach, minimize errors, and maximize the effectiveness of your future research efforts.
Even basic free surveys can unleash a valuable feedback loop. Accumulate valuable insights regarding customer satisfaction, product preferences, campaign effectiveness, and various other aspects. Utilize this data to strengthen your offerings, personalize your messaging, and ultimately foster more robust connections with your audience.
Creating effective surveys requires adherence to certain best practices to ensure accurate and actionable results. Here are some of the best practices for using a free online survey generator:
To craft a free business survey:
You can create a free survey using online platforms by selecting a suitable survey tool, such as Google Forms, SurveyMonkey, or Typeform. Sign up for an account, choose a template or start from scratch, add your questions, customize settings, and share the survey link with your target audience.
The best survey method depends on the survey’s purpose and target audience. Online surveys are cost-effective and easy to distribute, while phone surveys allow for more in-depth responses. Face-to-face surveys are useful when collecting feedback from specific groups or individuals.
Survey creation, once an enigma, is now unraveled.
“How to create a free survey” is your ticket to uncovering valuable insights without draining resources. Platforms like Google Forms, Microsoft Forms, and others offer the magic of inquiry without breaking the bank.
With clear objectives and concise questions, your survey becomes a voyage into understanding. The fusion of question types creates a symphony of quantitative and qualitative data. Guided by logical flow, your survey dances through minds, making sense and sparking revelations.
Remember, neutrality reigns steer clear of leading questions.
Before unveiling your masterpiece, pilot it to perfection. Once responses flow, transform them into actionable insights with ChartExpo.
ChartExpo’s power of visualization elevates your survey experience to new heights. It springs data to life with vibrant visualizations, breathing life into responses and revealing hidden patterns.
It’s not just about creating surveys. It’s about crafting narratives, uncovering truths, and sculpting a better future through the art of data.
Get started with ChartExpo today and watch your insights shine.
How much did you enjoy this article?


Google Forms to Google Sheets keeps your data organized and current with every submission. Learn the steps, methods, and tips now!

Product survey questions reveal what customers truly think. Learn how to ask the right ones and act on the survey results. Read on!

Learn how the 5-Point Performance Rating Scale improves employee evaluations with clear, consistent, and fair performance reviews across teams.


