• Home
  • Tools dropdown img
    • Spreadsheet Charts

      • ChartExpo for Google Sheets
      • ChartExpo for Microsoft Excel
    • Power BI Charts

      • Power BI Custom Visuals by ChartExpo
    • Word Cloud

  • Charts dropdown img
    • Chart Category

      • Bar Charts
      • Circle Graphs
      • Column Charts
      • Combo Charts
      • Comparison Charts
      • Line Graphs
      • PPC Charts
      • Sentiment Analysis Charts
      • Survey Charts
    • Chart Type

      • Box and Whisker Plot
      • Clustered Bar Chart
      • Clustered Column Chart
      • Comparison Bar Chart
      • Control Chart
      • CSAT Survey Bar Chart
      • CSAT Survey Chart
      • Dot Plot Chart
      • Double Bar Graph
      • Funnel Chart
      • Gauge Chart
      • Likert Scale Chart
      • Matrix Chart
      • Multi Axis Line Chart
      • Overlapping Bar Chart
      • Pareto Chart
      • Radar Chart
      • Radial Bar Chart
      • Sankey Diagram
      • Scatter Plot Chart
      • Slope Chart
      • Sunburst Chart
      • Tornado Chart
      • Waterfall Chart
      • Word Cloud
    • Google Sheets
      Microsoft Excel
  • Services
  • Pricing
  • Contact us
  • Blog
  • Support dropdown img
      • Gallery
      • Videos
      • Contact us
      • FAQs
      • Resources
    • Please feel free to contact us

      atsupport@chartexpo.com

Categories
All Data Visualizations Data Analytics Surveys
Add-ons/
  • Google Sheets
  • Microsoft Excel
  • Power BI
All Data Visualizations Data Analytics Surveys
Add-ons
  • Google Sheets
  • Microsoft Excel
  • Power BI

We use cookies

This website uses cookies to provide better user experience and user's session management.
By continuing visiting this website you consent the use of these cookies.

Ok

ChartExpo Survey


Home > Blog > Data Analytics

ACV vs. ARR: Understanding Differences in SaaS Metrics

ACV vs. ARR: these terms float through the boardroom with the weight of a company’s future. Average Contract Value (ACV) and Annual Recurring Revenue (ARR) are critical metrics for any subscription-based business model. They serve as the lifeline for strategic planning and growth forecasting.

ACV vs ARR

Picture a startup, its vibrant office buzzing with the energy of potential. In one corner, a group of executives pore over spreadsheets. They’re not just crunching numbers but shaping the company’s destiny. ACV vs. ARR becomes their mantra. These metrics reflect the health of customer relationships and the stability of revenue streams.

ACV measures the average annualized revenue per customer contract, excluding one-time fees. ARR reveals the predictable and recurring revenue components of your subscription business. The balance between these figures can tell a story of customer loyalty, pricing strategies, and market position.

Now, imagine a different scene. A well-established tech giant monitors its ACV vs. ARR, aiming to optimize these metrics to fuel expansion and outpace competitors. Here, small percentage changes can mean millions in revenue.

But why should ACV vs. ARR matter so much? In a field where customer acquisition costs are skyrocketing, businesses need to maximize the value of each contract. Moreover, they should ensure a stable, growing revenue base.

The challenge is to improve these metrics without sacrificing the others. This requires a keen understanding of customer behavior, competitive analysis, and an agile approach to pricing and packaging.

This blog post delves into actionable strategies for improving your ACV vs. ARR. Welcome to the strategic playbook for ACV vs. ARR excellence.

Table of Contents:

  1. What is ACV?
  2. What is ARR?
  3. ACV vs. ARR: Key Differences
  4. When to Use ACV vs. ARR?
  5. How to Calculate ACV vs. ARR?
  6. How to Evaluate ACV vs. ARR?
  7. How to Improve Your ARR and ACV?
  8. How to Examine Your ACV vs. ARR?
  9. What are the Pros and Cons of ACV vs. ARR?
  10. Wrap Up

First…

What is ACV?

Definition: ACV stands for Annual Contract Value. It is a crucial metric in sales and subscription-based business models. It represents the total value of a contract or subscription over a year.

ACV is determined by the MRR or ARR multiplied by the contractual duration. It represents the annual twelve-month revenue you expect from a customer.

ACV is a vital metric for firms that provide their services on a subscription basis or enter into lengthy contracts. It assists in revenue projections, customer lifetime value, and pipeline health evaluation. A contractual ACV gives insight into strategic pricing decisions, customer acquisitions, and resource allocations. It is also a performance indicator that reveals the state and growth of subscription-based businesses.

What is ARR?

Definition: Annual Recurring Revenue, abbreviated as ARR, is mostly used by subscription billing businesses. It measures the revenue generated from recurring subscriptions on an annual basis. It is a crucial financial metric that provides a company’s solid estimate of predictable and sustainable revenue.

ARR is derived by multiplying the Monthly Recurring Revenue (MRR) by 12 months. Therefore, ARR is a crucial metric for measuring a company’s sustainability, financial growth rate, and geographical expansion. Additionally, companies use ARR to set prices and make informed price comparisons. Why? ARR measures the number of clients they expect to attract throughout the year.

Investors and shareholders use ARR as a key performance indicator (KPI). It helps to assess the profitability of the subscription model on a long-term business scale.

ACV vs. ARR: Key Differences

Understanding the difference between Annual Contract Value (ACV) and Annual Recurring Revenue (ARR) is crucial for subscription-based businesses. It helps to assess financial performance and forecast future growth accurately.

Annual Contract Value (ACV) Annual Recurring Revenue (ARR)
Definition The total value of a contract or subscription over a year. The annualized value of all recurring revenue streams from active subscriptions.
Calculation ACV = Monthly Recurring Revenue (MRR) × Contract Term ARR = MRR × 12
Focus Provides insights into the total value of contracts signed within a specific period. Focuses on the ongoing revenue generated from existing subscriptions over a year.
Use Helps forecast revenue from new contracts and evaluate customer lifetime value. Aids in assessing the predictable and sustainable revenue stream from existing subscriptions.
Period It may include revenue from new and existing contracts signed within a specific period. Represents the cumulative revenue generated from active subscriptions over 12 months.

When to Use ACV vs. ARR?

When to use ACV vs. ARR depends on a subscription-based business’s specific needs and objectives. Both metrics offer valuable insights into revenue generation but serve different purposes and are utilized in distinct contexts.

When to Use ACV:

  • New contract evaluation: ACV is useful when evaluating the value of new contracts signed within a specific period. It provides insights into the total revenue potential of contracts, considering factors like contract duration and pricing.
  • Customer Lifetime Value (CLV): ACV helps assess the long-term value of customers. How? By considering the total value of their contracts over the entire contract term. It aids in predicting revenue from customers throughout their lifecycle with the business.
  • Sales forecasting: ACV is instrumental in forecasting revenue from new contracts and assessing the impact of sales efforts on revenue generation. It helps sales teams set realistic targets and evaluate performance against revenue goals.

When to Use ARR:

  • Revenue stability: ARR is valuable for assessing the predictability and stability of revenue generated from existing subscriptions. It provides a clear picture of the ongoing revenue stream, facilitating better financial planning and budgeting.
  • Business performance analysis: ARR is a key performance indicator (KPI) for evaluating a subscription-based business’s overall health and growth. It helps measure the success of customer retention efforts and identify expansion opportunities.
  • Investor and stakeholder communication: ARR is used in investor communications and financial reporting. It showcases the recurring revenue generated by the business over 12 months. It demonstrates the business’s ability to create consistent revenue streams.

How to Calculate ACV vs. ARR?

Calculating ACV) vs. ARR is essential for understanding the revenue generated from contracts and subscriptions in a subscription-based business.

To calculate ACV (Annual Contract Value):

  1. Identify contracts: Determine the contracts signed within the specified period.
  2. Contract value: Calculate the total value of each contract, considering factors like contract duration and pricing.
  3. Adjustments: Make necessary adjustments, such as discounts or add-ons, to reflect the contract’s value accurately.
  4. Final calculation: Sum up the adjusted values of all contracts to obtain the ACV for the period.

To calculate ARR (Annual Recurring Revenue):

  1. Identify subscriptions: Identify all active subscriptions within the business.
  2. Monthly revenue: Calculate the monthly revenue generated from each subscription.
  3. Annualize: Multiply the monthly revenue by 12 to annualize the revenue for each subscription.
  4. Sum: Sum up the annualized revenue from all active subscriptions to obtain the ARR for the business.

How to Evaluate ACV vs. ARR?

Evaluating ACV vs. ARR is vital for understanding revenue streams and assessing business performance in subscription-based models. While both metrics provide insights into revenue generation, they serve different purposes and offer unique perspectives. Here is a guide on how to evaluate ACV vs. ARR.

Aspect Annual Contract Value (ACV) Annual Recurring Revenue (ARR)
Purpose Evaluates the total value of contracts signed within a specific period. Assesses the annualized value of recurring revenue streams from active subscriptions.
Scope Focuses on new contracts signed within the specified period. Centers on ongoing revenue generated from existing subscriptions over 12 months.
Granularity Provides insights into the value of individual contracts, considering factors like contract duration and pricing. Offers a holistic view of revenue generated from all active subscriptions, irrespective of individual contract terms.
Comparability Enables comparison of contract values over time and across different customers or segments. Facilitates comparison of recurring revenue streams across different periods, allowing for trend analysis and performance evaluation.
Financial Analysis Useful for forecasting revenue from new contracts and assessing customer lifetime value(CLV). Valuable for assessing revenue stability, measuring business performance, and communicating financial health to stakeholders.

How to Improve Your ARR and ACV?

By improving ARR and ACV, businesses can capture growth opportunities and maximize profitability in a subscription-based model. Consider implementing the following strategic actions to drive revenue productivity and ensure long-term business success:

Pricing Optimization:

  • Segmentation: Segment customers based on unique needs, usage patterns, or willingness to pay to offer tailored pricing plans.
  • Value-based pricing: Align pricing with the tangible and intangible value customers can derive from the product or service. Offer higher-tier plans or add-ons that would enable customers to achieve better results.
  • Upselling and cross-selling: Identify opportunities to upsell existing customers to higher-tier plans or cross-sell complementary products.

Customer Holding and Expansion

  • Customer success: Invest in proactive customer success programs to ensure customers achieve their desired outcomes.
  • Renewal optimization: Implement strategies to streamline the annual renewal, such as offering incentives or early renewal discounts.
  • Expansion revenue: Encourage customer expansion for additional features, services, or usage limits, contributing to growing ARR.

Product Enhancements:

  • Feature development: Continue to develop product features based on customer feedback and/or market trends. This will increase perceived value, retain existing customers, and acquire new ones.
  • Feedback loop: Establish a feedback loop with your user base to understand their evolving needs and preferences. Then, leverage these insights to provide product updates and roadmap decisions.
  • Differentiation: Make a unique market proposition and differentiate the product from competitors. Offer unique features or capabilities that solve existing customer pain points or specific industry challenges.

Sales and Marketing Strategies:

  • Targeted marketing: Develop targeted campaigns to attract high-value prospects and nurture leads through personalized messaging and content.
  • Sales enablement: Empower your sales teams with the tools, resources, and training support to effectively communicate the product’s value.
  • Partnerships and channels: Explore various partnership opportunities within a similar industry. You can also leverage other sales channels, such as agency partnerships, to further increase your reach.

How to Examine Your ACV vs. ARR?

Data analysis can often feel like trying to solve a Rubik’s Cube in the dark. Especially with ACV vs. ARR, where the numbers intertwine in a dance of dollars and cents, leaving you dizzy.

Staring at rows of Excel data is like trying to read a novel through a keyhole. Sure, Excel is the old faithful. But when visualizing data, it’s often like bringing a knife to a laser fight.

Enter ChartExpo, the superhero, when pie charts and bar graphs just won’t cut it. This tool transforms the mundane into the magnificent, turning your ACV vs. ARR analysis into a visual feast.

With ChartExpo, data doesn’t just speak; it sings insights.

Let’s learn how to install ChartExpo in Excel.

  1. Open your Excel application.
  2. Open the worksheet and click the “Insert” menu.
  3. You’ll see the “My Apps” option.
  4. In the Office Add-ins window, click “Store” and search for ChartExpo on my Apps Store.
  5. Click the “Add” button to install ChartExpo in your Excel.

ChartExpo charts are available both in Google Sheets and Microsoft Excel. Please use the following CTAs to install the tool of your choice and create beautiful visualizations with a few clicks in your favorite tool.

Example

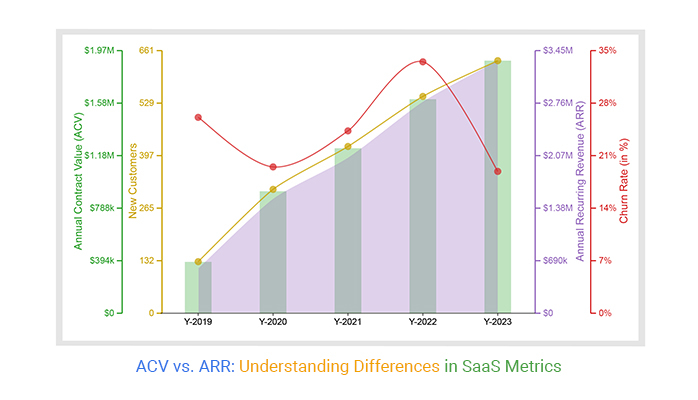
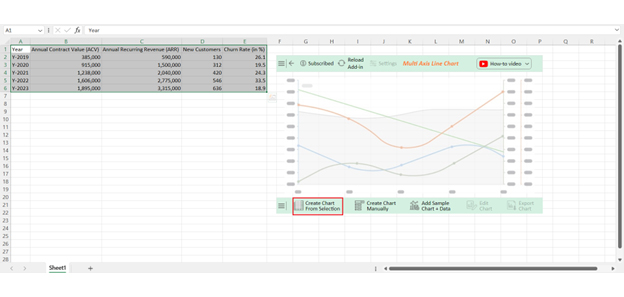
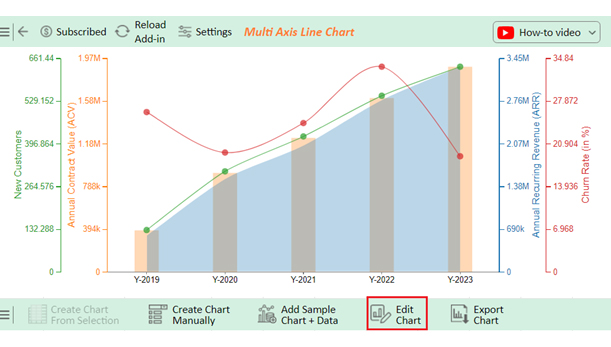
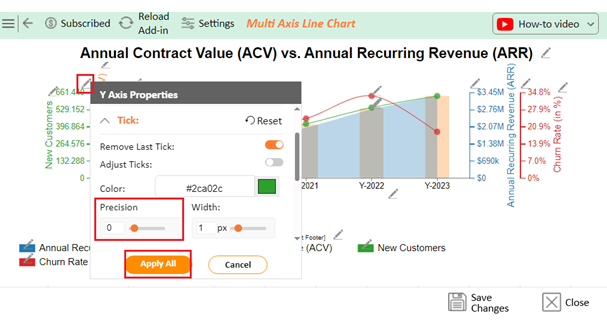
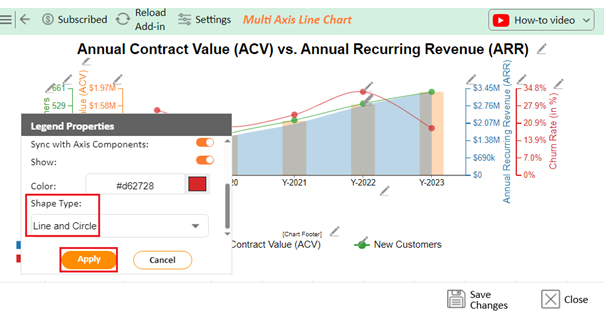
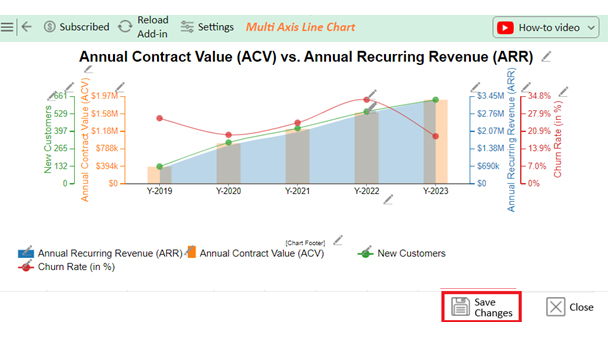
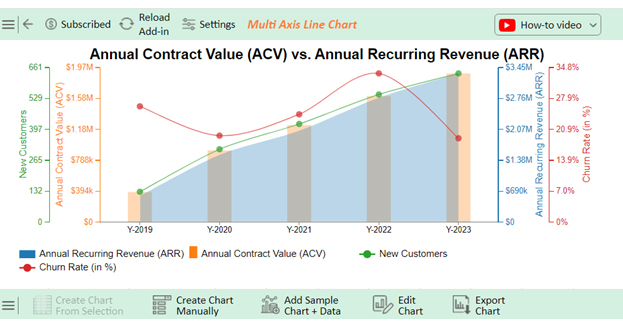
Let’s analyze the ARR vs. ACV sample data below using ChartExpo.

Year Annual Contract Value (ACV) Annual Recurring Revenue (ARR) New Customers Churn Rate (in %)
Y-2019 385,000 590,000 130 26.1
Y-2020 915,000 1,500,000 312 19.5
Y-2021 1,238,000 2,040,000 420 24.3
Y-2022 1,606,000 2,775,000 546 33.5
Y-2023 1,895,000 3,315,000 636 18.9
  • To get started with ChartExpo, install ChartExpo in Excel.
  • Now Click on My Apps from the INSERT menu.
insert chartexpo in excel
  • Choose ChartExpo from My Apps, then click Insert.
open chartexpo in excel
  • Once it loads, scroll through the charts list to locate and choose the “Multi-Axis Line Chart”.
search multi axis line chart in excel
  • Click the “Create Chart From Selection” button after selecting the data from the sheet, as shown.
Click Create Chart From Selection After Learning ACV vs ARR
  • ChartExpo will generate the visualization below for you.
Initial Visual of ACV vs ARR
  • Click on Settings and change the “Data Representation” as follows.
Change Data Representation After Learning ACV vs ARR
  • If you want to add anything to the chart, click the Edit Chart button:
Edit Chart After Learning ACV vs ARR
  • Click the pencil icon next to the Chart Header to change the title.
  • It will open the properties dialog. Under the Text section, you can add a heading in Line 1 and enable Show.
  • Give the appropriate title of your chart and click the Apply button.
Add Chart Header After Learning ACV vs ARR
  • Change the precision value of the Churn Rate to one and add the percentage sign:
Change Precision Value of the Churn Rate After Learning ACV vs ARR
  • Add the dollar sign with (ARR & ACV) as follows:
Add Prefix With ARR & ACV After Learning ACV vs ARR
  • Change the precision value of New Customer to zero:
Change the Precision Value of New Customer After Learning ACV vs ARR
  • Change the Legend shape of the Annual Contract Value to Column and click the Apply button. Change the Legend shape of New Customers & Churn Rate into a Line and Circle and click the Apply button.
Change Legend Shapes After Learning ACV vs ARR
  • Click the Save Changes button to persist the changes made to the chart.
Save Changes After Learning ACV vs ARR
  • Your final Multi Axis Line Chart will look like the one below.
Final ACV vs ARR

Insights

  • There is a continuous rise in ACV each year, showing a consistent increase in the average value of individual contracts.
  • Annual recurring revenue (ARR) growth remains consistent, showing a rise in yearly revenue from ongoing contracts.
  • The acquisition of new customers increases each year, indicating successful sales and marketing strategies.
  • Despite variations, the overall churn rate is on a downward trend, suggesting that customer retention efforts have improved.

What are the Pros and Cons of ACV vs. ARR?

There are pros and cons of both ACV and ARR that you should keep in mind. Understanding where each metric shines and falls short will guide you as you transition to a subscription revenue model.

ACV (Annual Contract Value)

Pros:

  • Granular insight: ACV offers insights down to the granular level of individual contracts. It can help you analyze and compare the sources of revenue.
  • Customer Lifetime Value: You can calculate the average estimated consumer lifetime value. Take the full length and the total contract value of a contract.
  • Flexibility: Knowing ACV enables you to develop a customized pricing and contract management approach. You can optimize your overall renewal strategies and more easily pursue opportunities with upsell and cross-sell potential.
  • Contract management: You can more efficiently manage and support the contracts likely to result in the greatest returns.

Cons:

  • Complexity: ACV calculations can be overly complex and difficult to understand, especially when working with multi-year or variable pricing contracts.
  • Volatility: Because they rely on contract terms and renewals, annual or durational contracts can change unexpectedly to sink your budget.
  • Limited overview: ACV cuts within the boundaries of fiscal quarters. It only provides a sense of activity or progress that occurred in the past year.

ARR (Annual Recurring Revenue):

Pros:

  • Comprehensive overview: Offers a comprehensive view of all recurring revenue streams, providing a holistic picture of the business’s revenue stability.
  • Standardized metric: A standardized metric for evaluating the ongoing revenue generated from existing subscriptions. It facilitates comparability across periods and businesses.
  • Predictability: Provides predictable revenue streams, which are valuable for financial planning, budgeting, and forecasting.
  • Financial modeling: Enables accurate financial modeling and forecasting, supporting strategic decision-making and investment planning.

Cons:

  • Oversimplification: May oversimplify revenue analysis by treating all recurring revenue equally, regardless of contract variations or customer segments.
  • Limited insight: Offers limited insights into the value of individual contracts or customer relationships, focusing solely on recurring revenue streams.
  • Dependency on renewals: ARR depends on subscription renewals. Fluctuations in renewal rates can impact revenue predictability and growth projections.

FAQs

What is ARR vs. ACV Salesforce?

In Salesforce, ARR (Annual Recurring Revenue) is the annualized revenue generated from active subscriptions or recurring contracts. ACV (Annual Contract Value) represents the total value of contracts signed within a specific period.

What does ACV mean in SaaS?

ACV in SaaS is the total value of a SaaS subscription contract over a year. It represents the yearly revenue generated from a customer’s SaaS product or service subscription.

What is ACV vs. TCV vs. ARR?

ACV (Annual Contract Value) represents the total value of a contract over a year. TCV (Total Contract Value) denotes the total value of a contract over its entire duration. ARR (Annual Recurring Revenue) reflects the annualized value of ongoing subscription revenue.

Wrap Up

Improving Annual Contract Value (ACV) and Annual Recurring Revenue (ARR) is pivotal for sustained growth and profitability in subscription-based businesses.

One key aspect of enhancing ACV and ARR is pricing optimization. Segmenting customers based on their needs and offering value-based pricing plans helps to capture higher ACV. Upselling and cross-selling additional products or features to existing customers further bolsters revenue streams.

Customer retention and expansion efforts are crucial in boosting ARR and ACV. Investing in customer success initiatives ensures customers achieve their desired outcomes, leading to higher retention rates and increased ARR. Optimization of renewal processes and proactive identification of expansion opportunities contribute to revenue growth.

Continual product enhancements are essential for attracting new customers and retaining existing ones. Developing features based on customer feedback and market trends can increase the perceived value of offerings. This results in higher ACV and ARR. Establishing a feedback loop with customers ensures product development remains aligned with evolving needs.

Strategic sales and marketing strategies are instrumental in driving ACV and ARR growth. Targeted marketing campaigns that resonate with high-value prospects and effective sales enablement programs empower sales teams to close deals efficiently. Exploring partnerships and additional sales channels expands the reach and drives customer acquisition.

Improving ACV vs. ARR requires a multifaceted approach. It addresses pricing, customer retention, product development, and sales and marketing strategies. Focusing on these key areas and implementing strategic initiatives helps achieve sustainable growth in the competitive subscription-based landscape.

How much did you enjoy this article?

GSAd1
Start Free Trial!
135732

Related articles

next previous
Data Analytics31 min read

Data Analysis Without Nonsense: Fix the Right Problem, Fast

Data analysis can mislead when metrics look right but outcomes fail. Learn how to spot red flags, fix failures, and make better decisions. Read on!

Data Analytics29 min read

Variance Analysis Isn’t a Math Problem, It’s a Trust Problem

Variance analysis helps identify what went wrong, who owns it, and what to do next. Use it to drive decisions, not just reports. Learn more!

Data Analytics10 min read

Supplier Comparison Template: Download It Now

A supplier comparison template streamlines vendor evaluation by comparing cost and quality. Click here to learn its benefits and how to analyze them.

Data Analytics32 min read

Ecommerce Analytics: How to Fix What It Often Gets Wrong

Ecommerce analytics often lead to mixed signals and costly misreads. Fix attribution gaps, align teams, and act on the right data. Get started now!

Data Analytics30 min read

When Sales Funnel Breaks: Failures, Fixes, & Funnel Debt

Is your sales funnel hiding costly gaps? Learn how pipeline stalls, false metrics, and handoff chaos could be draining revenue. Get started now!

ChartExpo logo

Turn Data into Visual
Stories

CHARTEXPO

  • Home
  • Gallery
  • Videos
  • Services
  • Pricing
  • Contact us
  • FAQs
  • Privacy policy
  • Terms of Service
  • Sitemap

TOOLS

  • ChartExpo for Google Sheets
  • ChartExpo for Microsoft Excel
  • Power BI Custom Visuals by ChartExpo
  • Word Cloud

CATEGORIES

  • Bar Charts
  • Circle Graphs
  • Column Charts
  • Combo Charts
  • Comparison Charts
  • Line Graphs
  • PPC Charts
  • Sentiment Analysis Charts
  • Survey Charts

TOP CHARTS

  • Sankey Diagram
  • Likert Scale Chart
  • Comparison Bar Chart
  • Pareto Chart
  • Funnel Chart
  • Gauge Chart
  • Radar Chart
  • Radial Bar Chart
  • Sunburst Chart
  • see more
  • Scatter Plot Chart
  • CSAT Survey Bar Chart
  • CSAT Survey Chart
  • Dot Plot Chart
  • Double Bar Graph
  • Matrix Chart
  • Multi Axis Line Chart
  • Overlapping Bar Chart
  • Control Chart
  • Slope Chart
  • Clustered Bar Chart
  • Clustered Column Chart
  • Box and Whisker Plot
  • Tornado Chart
  • Waterfall Chart
  • Word Cloud
  • see less

RESOURCES

  • Blog
  • Resources
  • YouTube
SIGN UP FOR UPDATES

We wouldn't dream of spamming you or selling your info.

© 2025 ChartExpo, all rights reserved.