• Home
  • Tools dropdown img
    • Spreadsheet Charts

      • ChartExpo for Google Sheets
      • ChartExpo for Microsoft Excel
    • Power BI Charts

      • Power BI Custom Visuals by ChartExpo
    • Word Cloud

  • Charts dropdown img
    • Chart Category

      • Bar Charts
      • Circle Graphs
      • Column Charts
      • Combo Charts
      • Comparison Charts
      • Line Graphs
      • PPC Charts
      • Sentiment Analysis Charts
      • Survey Charts
    • Chart Type

      • Box and Whisker Plot
      • Clustered Bar Chart
      • Clustered Column Chart
      • Comparison Bar Chart
      • Control Chart
      • CSAT Survey Bar Chart
      • CSAT Survey Chart
      • Dot Plot Chart
      • Double Bar Graph
      • Funnel Chart
      • Gauge Chart
      • Likert Scale Chart
      • Matrix Chart
      • Multi Axis Line Chart
      • Overlapping Bar Chart
      • Pareto Chart
      • Radar Chart
      • Radial Bar Chart
      • Sankey Diagram
      • Scatter Plot Chart
      • Slope Chart
      • Sunburst Chart
      • Tornado Chart
      • Waterfall Chart
      • Word Cloud
    • Google Sheets
      Microsoft Excel
  • Services
  • Pricing
  • Contact us
  • Blog
  • Support dropdown img
      • Gallery
      • Videos
      • Contact us
      • FAQs
      • Resources
    • Please feel free to contact us

      atsupport@chartexpo.com

Categories
All Data Visualizations Data Analytics Surveys
Add-ons/
  • Google Sheets
  • Microsoft Excel
  • Power BI
All Data Visualizations Data Analytics Surveys
Add-ons
  • Google Sheets
  • Microsoft Excel
  • Power BI

We use cookies

This website uses cookies to provide better user experience and user's session management.
By continuing visiting this website you consent the use of these cookies.

Ok

ChartExpo Survey


Home > Blog > Google Sheets

How to Use What If Analysis in Google Sheets for Insights?

What if analysis in Google Sheets can transform your data insights?

How?

Imagine you’re a store manager planning for the holiday season. You want to know how changing prices or increasing stock affects your profit. This is where what-if analysis shines.

What If Analysis in Google Sheets

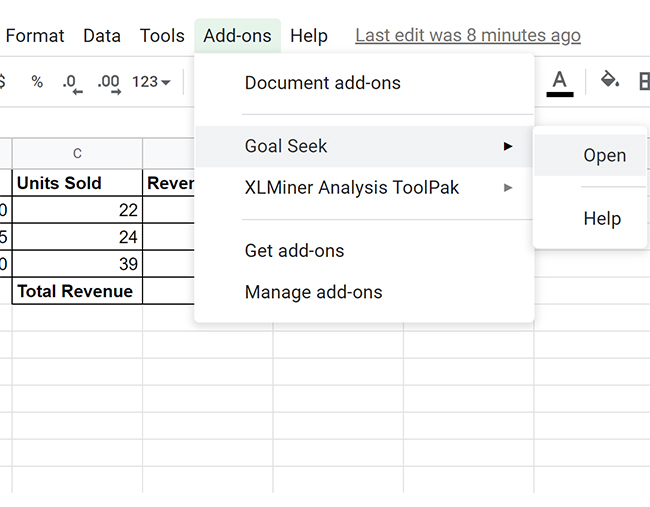
Google Sheets makes this process easier by offering features like Goal Seek. Goal Seek can help you figure out how many units need to be sold to reach a revenue target of $10,000. This powerful feature enables you to forecast outcomes and make informed decisions.

Visualizing data can improve understanding by up to 400%. So, using what-if analysis in Google Sheets aids in planning and data presentation. It allows you to create scenarios that show the impact of different variables on your business.

The versatility of what-if analysis in Google Sheets is its beauty. This tool offers clarity, whether it be sales forecasting, budgeting, or strategic planning. It transforms complicated data into practical insights, simplifying the process of reaching your objectives.

Remember that conducting a what-if analysis in Google Sheets can be extremely useful when working with numbers. It streamlines the decision-making process and allows you to envision the future. This guarantees that you are always ready for what lies ahead.

This blog post will show you how to use what-if analysis in Google Sheets.

Table of Contents:

  1. What is a What-If Analysis?
  2. Why Do You Conduct a What-If Analysis?
  3. How Does What-If Analysis Work?
  4. How Many Types of What If Analysis?
  5. How Do You Perform What-If Analysis in Google Sheets?
  6. How to Visualize in Google Sheets?
  7. Wrap Up

First…

What is a What-If Analysis?

Definition: A what-if analysis is a decision-making tool. It helps predict outcomes based on different scenarios. By changing variables, you can see potential effects on results.

What-if analysis is often used in finance and business planning. For example, you might adjust sales forecasts or costs to see potential profits.

This analysis helps identify risks and opportunities. It supports strategic planning by highlighting possible challenges. You can use it to test assumptions and validate models. Tools like Google Sheets often facilitate this process.

Comprehensively, what-if analysis aids in making data-driven decisions. It offers a clearer picture of future possibilities.

Why Do You Conduct a What-If Analysis?

Imagine you’re planning a big event, like a wedding or a company launch. You have a vision, a budget, and a timeline, but what if things don’t go as planned? This is where a what-if analysis comes into play.

Here’s why conducting a what-if analysis is essential:

  • Risk assessment and management: A what-if analysis allows you to identify potential risks before they become real problems. By evaluating different scenarios, you gain insights into what are key risk indicators that could impact your project. This proactive approach helps you prepare for worst-case situations and develop effective mitigation strategies. By minimizing surprises, you keep projects on track and ensure smoother execution, turning potential challenges into manageable opportunities.
  • Decision making: What-if analysis provides a clear picture of possible outcomes, helping you choose the best course of action. It supports objective decision-making by quantifying the impact of different choices.
  • Financial planning and budgeting: What-if analysis empowers you to forecast revenue, expenses, and profitability under different scenarios, offering invaluable insights for shaping realistic budgets. This approach ensures smarter resource allocation and helps you set and achieve long-term financial goals with confidence.
  • Project management: Project managers leverage what-if analysis to anticipate challenges and allocate resources more effectively. By simulating various project scenarios, they can plan for potential delays, cost overruns, and resource shortages, all while enhancing their task-tracking spreadsheet for smoother project execution.
  • Strategic planning: What-if analysis allows you to test strategies and see their potential impacts. This helps in choosing the most effective and sustainable approach.
  • Problem-solving: When faced with a problem, exploring multiple solutions is helpful. What-if analysis enables you to evaluate the effectiveness of various approaches. This systematic evaluation leads to more effective problem-solving and innovation.
  • Performance improvement: Organizations continually seek ways to improve performance. By analyzing different scenarios, you can identify areas for improvement and implement changes that lead to better outcomes. It’s a powerful tool for continuous improvement.
  • Compliance and regulation: Staying compliant with regulations is critical in many industries. What-if analysis helps assess the impact of regulatory changes on your operations. This ensures you can adapt quickly and remain compliant without disrupting your business.

How Does What-If Analysis Work?

Imagine you’re a chef planning a special menu for a big event. You have a variety of ingredients and recipes to choose from, but you want to ensure everything turns out perfectly. To do this, consider different combinations of dishes, ingredient quantities, and cooking times.

This is similar to how a what-if analysis works. Let’s walk through the process step-by-step:

  1. Identify Variables

First, you must identify the key variables influencing your outcome. In our chef example, these variables might include the types of dishes, ingredients, and preparation methods. In business, variables could be sales numbers, costs, or market conditions.

  1. Define Scenarios

Next, you define different scenarios to explore. For the chef, this could mean creating a vegetarian menu, a seafood-focused menu, or a mix of both. In business, scenarios might involve different levels of sales growth, budget cuts, or market expansions. Each scenario represents a different set of conditions that you want to test.

  1. Model Setup

With your variables and scenarios in hand, you set up a model. This model serves as a framework for your analysis. For the chef, the model might be a detailed kitchen workflow and ingredient use plan. In business, it could be a financial model that calculates profits and losses based on input variables.

  1. Analyze Changes

Now, you start changing the variables within your model to reflect each scenario. For instance, the chef might adjust ingredient quantities and cooking times for each menu option. In a business model, you might tweak sales forecasts or cost estimates to see how they impact overall performance.

  1. Compare Outcomes

After running the scenarios, you compare the outcomes. This means evaluating which menu option offers the chef the best balance of taste, cost, and preparation time. In business, it involves comparing financial metrics like revenue, profit, and risk across different scenarios. This comparison helps you understand the potential impact of each scenario.

  1. Make Decisions

Finally, armed with insights from your analysis, including techniques like chord analysis, you make informed decisions. The chef chooses the menu that promises the best dining experience and efficiency. In business, decision-makers select the strategy that offers the best balance of opportunity and risk. The what-if analysis provides a clear roadmap for moving forward with confidence.

How Many Types of What If Analysis?

There are several types of what-if analysis, each offering unique insights. Here are the main types:

  • Scenario Analysis

Scenario analysis involves creating and analyzing different scenarios to see how variable changes affect outcomes. Think of it like plotting multiple routes through the maze:

    • One route might represent a best-case scenario
    • Another one represents a worst-case scenario
    • Others present various middle-ground possibilities.

In business, this might mean projecting financial outcomes based on different market conditions or strategic decisions. By comparing these scenarios, you can better prepare for various potential futures.

  • Sensitivity Analysis

Sensitivity analysis examines how sensitive your results are to changes in key variables. Imagine tweaking a certain turn in the maze and seeing how it affects your overall path. In a business context, sensitivity analysis might involve changing one variable.

For instance, you can change the price of a product and observe how it impacts profit margins. This type of analysis helps you understand which variables have the most significant impact on your outcomes. It allows you to focus on what matters most.

  • Simulation Analysis

Simulation analysis is like navigating a maze hundreds of times, each with slight tweaks, to discover all possible exit points. In business, it’s akin to running thousands of market scenarios to predict outcomes in financial performance analysis.

By employing techniques like Monte Carlo simulations, this approach offers a broad view of potential results and their probabilities, making it an essential tool for managing uncertainty and optimizing financial performance analysis.

How Do You Perform What-If Analysis in Google Sheets?

What-if analysis enables you to input varying numbers into equations. Then, observe the effects on the outcomes.

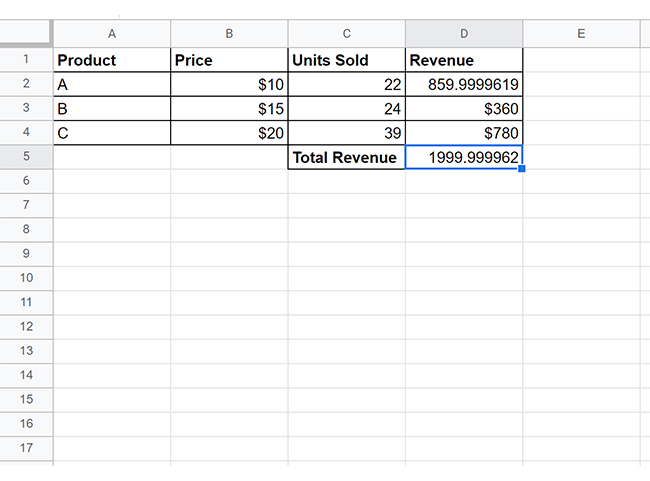
Example of what-if analysis: Imagine a shop that offers three unique items at varying prices and calculates the total revenue generated by these items.

Calculate Total Revenue for Learning What If Analysis in Google Sheets

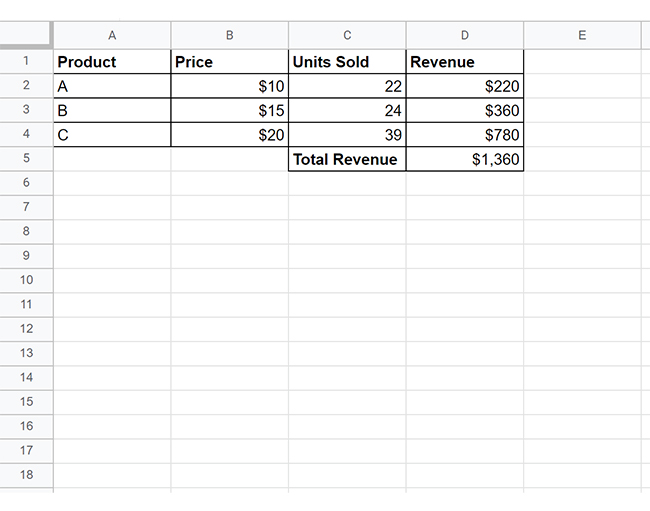
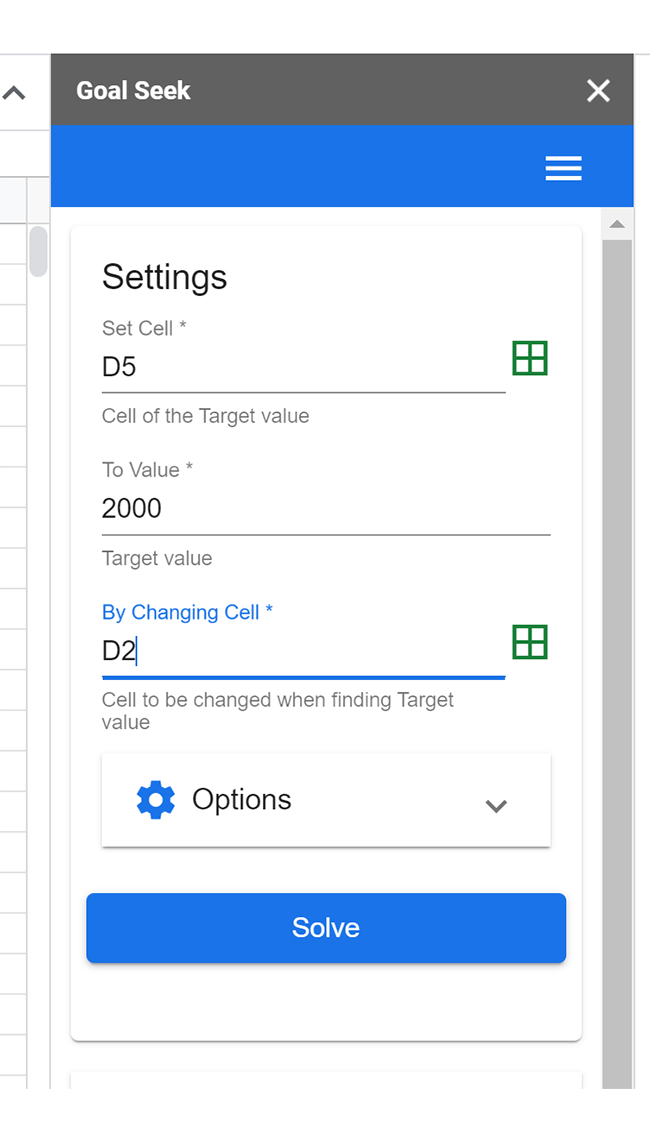
Now, assume the store manager wants to determine the additional units of product A that must be sold to achieve a revenue total of $2,000.

This step-by-step example demonstrates how to conduct a similar what-if analysis in Google Sheets.

Step 1: Get the Goal Seek Add-On

  1. Before conducting a what-if analysis, first obtain the Goal Seek add-on.
  2. To do so, click the Add-ons tab and choose “Get add-ons”.
Click Get add-ons for Learning What If Analysis in Google Sheets
  1. Search for “Goal Seek” and select the first result that reads Goal Seek for Sheets.
Search and Click Goal Seek for Learning What If Analysis in Google Sheets
  1. Next, select Install. Permission will be requested before installing Goal Seek. Choose to accept.
  2. The Goal Seek add-on will be added to the Add-ons tab.

Step 2: Perform What-If Analysis

  1. Click the Add-ons section, click on choose Goal Seek, and select Open.
Choose and Open Goal Seek for Learning What If Analysis in Google Sheets
  1. Enter the specified cell values into the Goal Seek panel and click Solve.
Specified Cell Values into Goal Seek for Learning What If Analysis in Google Sheets
  1. Goal Seek will try different values in D2 until it reaches the value of 2000 in cell D5.
  2. Here is the outcome that it finds:
Goal Seek Try Different Values for Learning What If Analysis in Google Sheets

How to Visualize in Google Sheets?

Data analysis can feel like deciphering hieroglyphics. Numbers blur. Patterns hide. Insights? They play hard to get.

Enter data visualization, the superhero of analysis. It transforms chaos into clarity, especially in what-if analysis scenarios.

What about Google’s basic charts? They’re like crayons for a Picasso. Limited, clunky, slow.

Say hello to ChartExpo. It supercharges Google Sheets with advanced charts and instant insights.

Ready to make data dance? Let’s dive in.

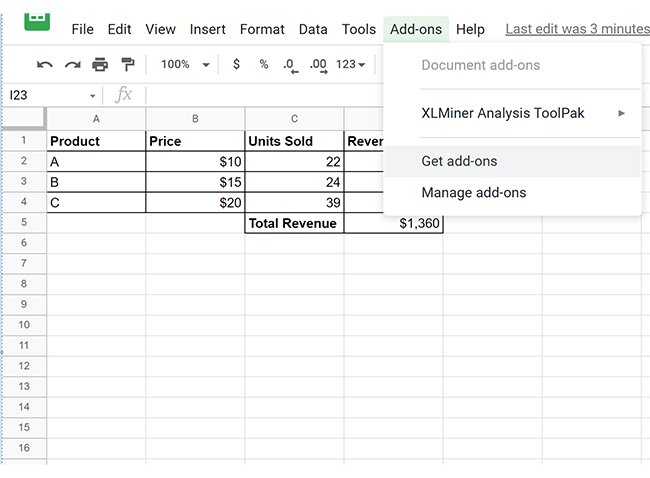
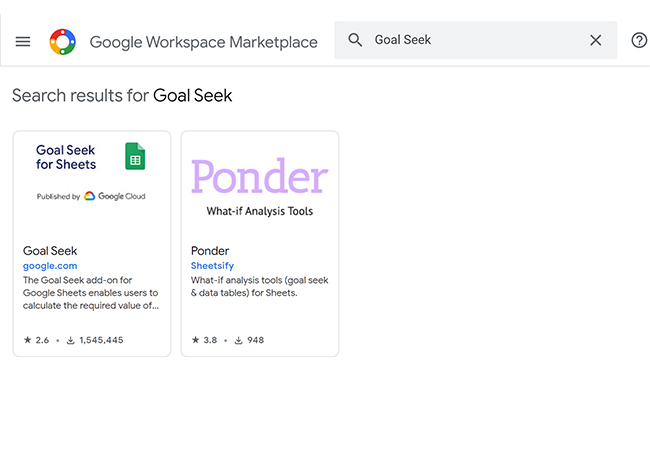
Let’s learn how to install ChartExpo in Google Sheets.

  1. To start using ChartExpo, download it directly from the Google Sheets program. To do this, select Extensions from the top toolbar.
  2. A menu will appear. Click the Get add-ons option.
  3. Search for ChartExpo, and click on Charts, Graphs & Visualizations by ChartExpo when it appears in the results.
  4. Click the Install button. You will have to confirm your Google account and accept some permissions.

ChartExpo charts are available both in Google Sheets and Microsoft Excel. Please use the following CTAs to install the tool of your choice and create beautiful visualizations in a few clicks in your favorite tool.

Google Sheets What-If Analysis Example

Let’s visualize the data below in Google Sheets using ChartExpo.

Scenario Marketing Budget ($) Projected Revenue ($)
Current Budget 50000 500000
Increase by 10% 55000 550000
Increase by 20% 60000 600000
Increase by 30% 65000 640000
Increase by 40% 70000 680000
Increase by 50% 75000 700000
Decrease by 10% 45000 450000
Decrease by 20% 40000 400000
Decrease by 30% 35000 350000
Decrease by 40% 30000 300000
  • To get started with ChartExpo, install ChartExpo in Google Sheets.
  • Go to Extensions > Charts, Graphs & Visualizations by ChartExpo > Open.
search chartexpo google workplace
  • To access the charts library, click the Add new chart button.
click install for chartexpo in google sheets
  • Once ChartExpo is loaded. Click on “Double Bar Graph”.
search double bar graph in google sheets
  • First, insert the data table into the sheet. Then, select the Sheet name from the drop-down menu in the ChartExpo section.
  • Select the metric column; metric is the numeric column in your data sheet.
  • Select the dimensions column; the dimension is the categorical column in your datasheet that contains text information.
  • Click the Create chart button to complete the process.
Click Create Chart Button After Learning What If Analysis in Google Sheets
  • Your tabular data will turn into a Double Bar Graph, as shown below.
  • Click the Edit chart button to make custom changes.
Click Edit Chart After Learning What If Analysis in Google Sheets
  • To change the title of the chart, click the pencil icon next to the Chart Header.
  • It will open the properties dialog. Under the Text section, you can add a heading in Line 1 and enable the Show option. Give the appropriate title of your chart and click the Apply button.
Add Chart Header in Chart After Learning What If Analysis in Google Sheets
  • Add the dollar sign with both values by clicking on the pencil icon:
Add Prefix in Chart After Learning What If Analysis in Google Sheets
  • Now, you can enable the legends as follows:
Enable Legends After Learning What If Analysis in Google Sheets
  •  After making all changes, click the “Save” button:
Click Save What If Analysis in Google Sheets
  • The final visualization of the “Double Bar Graph” is as follows:
Final What If Analysis in Google Sheets

Insights

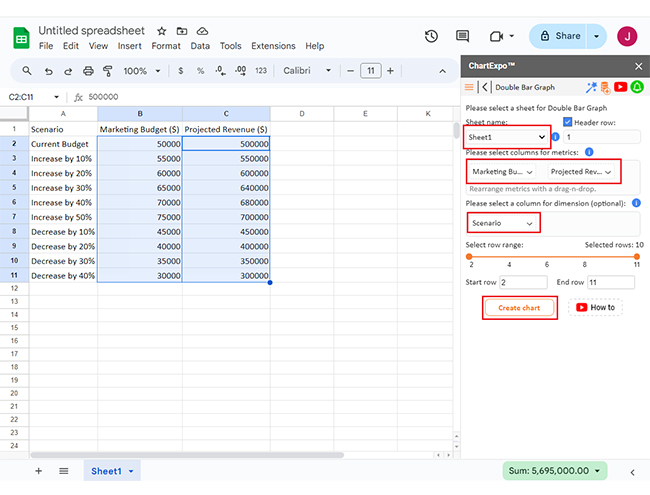
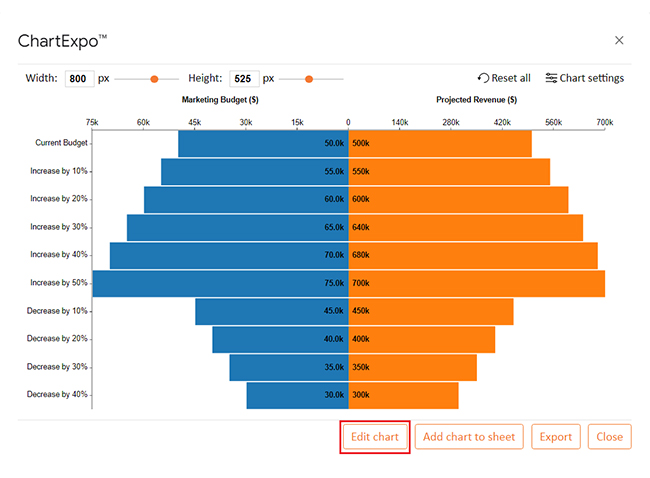
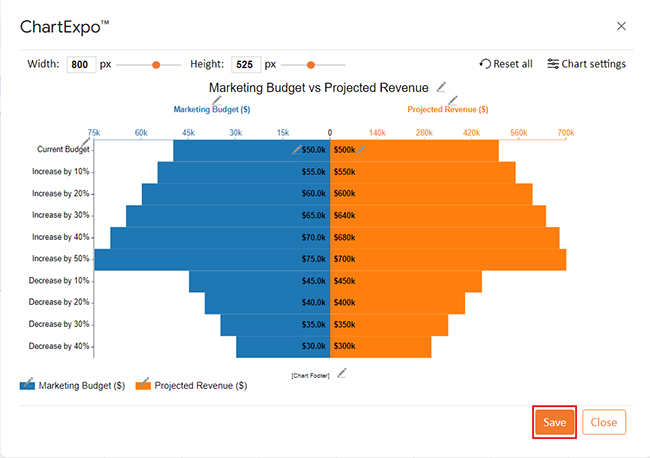
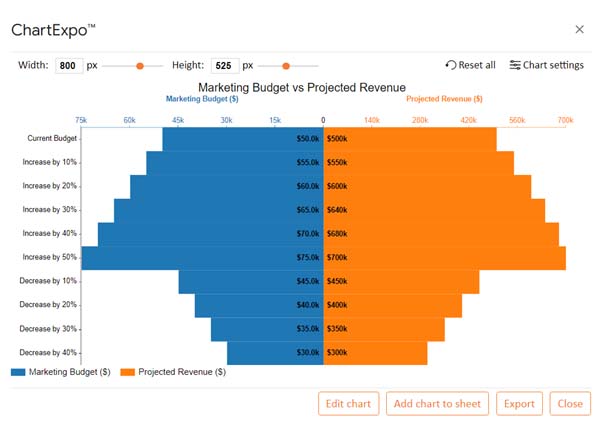
The situation looks into how different marketing budgets affect estimated revenue. Raising the budget leads to gradual revenue growth, and a 50% raise leads to $700,000 in extra revenue. On the other hand, lowering the budget results in reduced revenue. This shows a clear connection between marketing investment and expected revenue increase.

Uncover Insights in What-If Analysis in Google Sheets Using Double Bar Graphs:

  1. Open your Google Sheets Application.
  2. Install ChartExpo Add-in for Google Sheets from Google Workspace Marketplace.
  3. Select the Double Bar Graph from the list of charts.
  4. Fill in the necessary fields.
  5. Click on the “Create Chart” button.
  6. Customize your chart properties to add header, axis, legends, and other required information.
  7. Export your chart and share it with your audience.

The following video will help you to create a Double Bar Graph in Google Sheets.

FAQs

Is there a what-if analysis in Google Sheets?

Yes, Google Sheets has a what-if analysis feature. You can use tools like Goal Seek and data tables to analyze different scenarios. How? By adjusting variables and observing the impact on results.

What if analysis could be used?

What-if analysis can be used to explore different scenarios and understand their outcomes. It helps in making informed decisions by testing variables and predicting results. This analysis is valuable in financial modeling, forecasting, strategic planning, and optimizing processes.

What if analysis is also called?

What-if analysis is also called sensitivity analysis or scenario analysis. These terms refer to the method of exploring how variable changes affect outcomes. It’s used across various fields, including finance, business planning, and engineering, to assess risk and make informed decisions.

Wrap Up

What-if analysis in Google Sheets is a powerful tool. It enables you to explore various scenarios and predict outcomes based on different variables. This helps you make informed decisions. Whether for finance, project management, or strategic planning, it’s invaluable.

Organizing your data is the first step. Clean and well-structured data makes analysis easier. Using named ranges simplifies referencing. It also enhances the clarity of your formulas. This foundation is crucial for accurate analysis.

Setting up baseline scenarios provides a control group. It helps you compare different outcomes effectively. Data validation ensures input consistency, minimizes errors, and maintains data integrity. This step is essential for reliable results.

Conditional formatting highlights important changes. It makes trends and outliers easily visible. Built-in functions like VLOOKUP and QUERY are vital. They allow complex data manipulation effortlessly. Mastering these functions improves your analysis.

Another best practice is creating scenario tables. These tables enable side-by-side comparisons of different scenarios. Documenting assumptions clarifies your logic and ensures transparency in your analysis. This documentation is key for collaboration.

In conclusion, what-if analysis in Google Sheets is a robust technique. It offers clarity and insight for various applications. Following best practices enhances its effectiveness. From data organization to visualization, each step is crucial. Google Sheets provides a versatile platform to perform this valuable analysis.

How much did you enjoy this article?

GSAd2
Start Free Trial!
137438

Related articles

next previous
Google Sheets10 min read

Google Workspace for Education for Better Insights

Google Workspace for Education boosts collaboration and remote learning. Explore its features, benefits, and how ChartExpo enhances data analysis.

Google Sheets9 min read

Google Workspace Marketplace for Boosting Insights

Google Workspace Marketplace provides apps to enhance Gmail, Drive, and Docs. Learn about this tool and how to improve data visualization and analysis.

Google Sheets12 min read

Google Sheets CRM Templates for Insightful Decisions

Google Sheets CRM templates help businesses track contacts, sales, and customer data. Learn their benefits, setup steps, and expert tips to boost efficiency.

Google Sheets10 min read

Histogram Chart in Google Sheets: A Quick Walkthrough

A Google Sheets Histogram makes data visualization simple by revealing patterns. Learn how to create, customize, and optimize histograms for better insight.

Google Sheets10 min read

Google Sheets Amortization Schedule with Clear Visuals

A Google Sheets Amortization Schedule tracks loan payments, interest, and balances. Learn how to create your schedule for better loan management.

ChartExpo logo

Turn Data into Visual
Stories

CHARTEXPO

  • Home
  • Gallery
  • Videos
  • Services
  • Pricing
  • Contact us
  • FAQs
  • Privacy policy
  • Terms of Service
  • Sitemap

TOOLS

  • ChartExpo for Google Sheets
  • ChartExpo for Microsoft Excel
  • Power BI Custom Visuals by ChartExpo
  • Word Cloud

CATEGORIES

  • Bar Charts
  • Circle Graphs
  • Column Charts
  • Combo Charts
  • Comparison Charts
  • Line Graphs
  • PPC Charts
  • Sentiment Analysis Charts
  • Survey Charts

TOP CHARTS

  • Sankey Diagram
  • Likert Scale Chart
  • Comparison Bar Chart
  • Pareto Chart
  • Funnel Chart
  • Gauge Chart
  • Radar Chart
  • Radial Bar Chart
  • Sunburst Chart
  • see more
  • Scatter Plot Chart
  • CSAT Survey Bar Chart
  • CSAT Survey Chart
  • Dot Plot Chart
  • Double Bar Graph
  • Matrix Chart
  • Multi Axis Line Chart
  • Overlapping Bar Chart
  • Control Chart
  • Slope Chart
  • Clustered Bar Chart
  • Clustered Column Chart
  • Box and Whisker Plot
  • Tornado Chart
  • Waterfall Chart
  • Word Cloud
  • see less

RESOURCES

  • Blog
  • Resources
  • YouTube
SIGN UP FOR UPDATES

We wouldn't dream of spamming you or selling your info.

© 2025 ChartExpo, all rights reserved.