• Home
  • Tools dropdown img
    • Spreadsheet Charts

      • ChartExpo for Google Sheets
      • ChartExpo for Microsoft Excel
    • Power BI Charts

      • Power BI Custom Visuals by ChartExpo
    • Word Cloud

  • Charts dropdown img
    • Chart Category

      • Bar Charts
      • Circle Graphs
      • Column Charts
      • Combo Charts
      • Comparison Charts
      • Line Graphs
      • PPC Charts
      • Sentiment Analysis Charts
      • Survey Charts
    • Chart Type

      • Box and Whisker Plot
      • Clustered Bar Chart
      • Clustered Column Chart
      • Comparison Bar Chart
      • Control Chart
      • CSAT Survey Bar Chart
      • CSAT Survey Chart
      • Dot Plot Chart
      • Double Bar Graph
      • Funnel Chart
      • Gauge Chart
      • Likert Scale Chart
      • Matrix Chart
      • Multi Axis Line Chart
      • Overlapping Bar Chart
      • Pareto Chart
      • Radar Chart
      • Radial Bar Chart
      • Sankey Diagram
      • Scatter Plot Chart
      • Slope Chart
      • Sunburst Chart
      • Tornado Chart
      • Waterfall Chart
      • Word Cloud
    • Google Sheets
      Microsoft Excel
  • Services
  • Pricing
  • Contact us
  • Blog
  • Support dropdown img
      • Gallery
      • Videos
      • Contact us
      • FAQs
      • Resources
    • Please feel free to contact us

      atsupport@chartexpo.com

Categories
All Data Visualizations Data Analytics Surveys
Add-ons/
  • Google Sheets
  • Microsoft Excel
  • Power BI
All Data Visualizations Data Analytics Surveys
Add-ons
  • Google Sheets
  • Microsoft Excel
  • Power BI

We use cookies

This website uses cookies to provide better user experience and user's session management.
By continuing visiting this website you consent the use of these cookies.

Ok

ChartExpo Survey


Home > Blog > Data Analytics

Social Media Marketing Plan Template for SMM Success

A template for a social media marketing plan could save you hours of confusion and endless spreadsheets.

How?

Marketing teams spend nearly 30% of their time organizing data instead of acting on it. That is a lot of wasted opportunity. A clear structure brings clarity, and clarity fuels action.

Template for Social Media Marketing Plan

Think about how fast digital conversations move. Every scroll, share, and comment adds up to signals you cannot afford to ignore. Yet without a plan, those signals scatter. A social media marketing plan template creates order from chaos. It is a single place where strategy, goals, and performance come together.

Marketers today crave speed and insight, and a marketing dashboard enables real-time tracking. Moreover, a marketing analytics platform enables deeper measurement. Together, they bridge the gap between posting content and proving value. Numbers stop being random once you frame them inside a plan.

Google Sheets makes it simple. No heavy software. No expensive subscriptions. Anyone with access can read, update, or share instantly. That makes collaboration seamless across teams and clients. The best part is the flexibility. You can expand it as your marketing funnel grows or shrink it when testing smaller campaigns.

A template for a social media marketing plan in Google Sheets is not just about organization. It is about moving from scattered activity to measurable growth. The difference between guessing and knowing lies in the plan you use. And the right plan starts here.

Table of Content:

  1. What is a Social Media Marketing Plan Template in Google Sheets?
  2. Why Use a Template for a Social Media Marketing Plan?
  3. What Should Be Included in a Social Media Plan Template in Google Sheets?
  4. Key Component of a Social Media Strategy Template in Google Sheets
  5. Examples of Social Media Marketing Plan Template in Google Sheets
  6. How to Create a Social Media Plan Format in Google Sheets?
  7. Top 5 Social Media Marketing Plan Templates for Google Sheets
  8. How to Analyze a Social Media Marketing Plan Template in Google Sheets?
  9. How to Download and Use the Social Media Marketing Plan Template in Google Sheets?
  10. Benefits of Using a Template for Social Media Marketing Plan
  11. FAQs
  12. Wrap Up

What is a Social Media Marketing Plan Template in Google Sheets?

Definition: A social media marketing plan template in Google Sheets is a structured spreadsheet that organizes campaigns, goals, and results. It gives marketers a simple way to track posts, measure reach, and manage budgets. With built-in formulas, it turns raw numbers into clear insights.

Teams use this template to align strategies and monitor progress in one place. It works well with social media analytics tools to capture performance data. You can also connect it with social media reporting templates to present results to clients or managers. The template makes planning easier, faster, and far more transparent.

Why Use a Template for a Social Media Marketing Plan?

Sometimes social media feels like running on a treadmill. You keep moving, but progress is hard to measure. A template for a social media marketing plan changes that. It brings order, clarity, and confidence to every campaign.

Here is why using one makes such a difference:

  • Saves time: A template organizes content, goals, and performance in one place. You spend less time tracking posts and more time improving them.
  • Improves accuracy: By linking with social media analytics tools, data flows directly into your plan, enhancing its accuracy. This reduces errors and keeps reporting clear.
  • Simplifies reporting: Templates pair well with marketing report examples to present results. Clients and managers see insights without confusion.
  • Supports smarter spending: A template helps you control costs with structured planning. It works even better alongside a marketing spend template for budget clarity.
  • Strengthens teamwork: Everyone works from the same sheet, which keeps teams aligned. Updates are instant, so collaboration never stalls.

What Should Be Included in a Social Media Plan Template in Google Sheets?

A social media plan in Google Sheets becomes powerful when it covers the correct elements. Too often, teams post content without a clear strategy, resulting in scattered outcomes. A structured template turns ideas into action, making performance easy to measure and track.

Here is what you should include to make the plan effective:

  • Goals and objectives: Clear goals set the direction for your strategy. They define what success means and keep every campaign aligned with business outcomes.
  • Content calendar: A content calendar helps map out posts in advance across platforms. It ensures consistency, reduces stress, and keeps messaging on track.
  • Performance metrics: These metrics reveal whether your efforts are effective. Connecting them with social media reporting templates makes insights easier to share with clients or teams.
  • Budget tracking: Managing spend is critical for sustainable campaigns. Including costs alongside a marketing spend template keeps budgets under control and prevents overspending.
  • Data analysis section: A plan is incomplete without room for reflection. Adding space for data analysis for marketing allows you to learn from results and improve future strategies.

Key Component of a Social Media Strategy Template in Google Sheets

A social media strategy without structure is like building a house without a foundation. A Google Sheets template brings that foundation. It makes every step of the strategy visible, measurable, and actionable. By pairing it with social media analytics tools and social media reporting templates, the strategy turns from guesswork into clarity.

Here are the core components every template should include:

  • Goals and objectives: Goals keep the strategy focused and aligned. They define outcomes and provide a benchmark for success.
  • Content plan: This section organizes what to post and when. It ensures content speaks to the audience with purpose.
  • Channel strategy: Not every platform works the same. A clear plan shows where to invest effort for maximum impact.
  • Engagement tactics: Engagement is about building trust. Adding tactics here helps maintain honest conversations with followers.
  • Performance tracking: Tracking is vital for growth. Including a section for data analysis for marketing makes it easier to review results. From here, you can refine strategies and share updates on a marketing agency client dashboard.

Examples of Social Media Marketing Plan Template in Google Sheets

A good plan becomes even better when you see it in action. Templates in Google Sheets bring ideas to life and make execution smoother. They keep campaigns structured and results measurable. With the proper setup, social media analytics tools and social media reporting templates connect seamlessly to boost efficiency.

Here are examples worth using:

  • Monthly content calendar: This calendar outlines posts for each week and month, providing a clear schedule for content creation. It creates consistency and ensures content is always ready.
  • Campaign tracker: A tracker follows campaigns from planning to completion. It highlights goals, timelines, and results in one place.
  • Analytics Dashboard: This dashboard collects performance insights in real-time. Linking data analysis for marketing reveals what is working and what needs improvement.
  • Client reporting sheet: This sheet organizes performance updates for agencies. Paired with a marketing agency client dashboard, it makes results clear and easy to present.

How to Create a Social Media Plan Format in Google Sheets?

Creating a social media plan in Google Sheets is easier than most people think. It gives structure, clarity, and flexibility all in one place. With the correct format, you can track content, measure results, and share progress instantly. Here are the steps to build it.

  1. Set your goals: Define what you want to achieve with social media. Clear goals keep every part of the plan aligned.
  2. Build a content calendar: Map out posts by date and platform. This ensures consistency and avoids last-minute planning.
  3. Add channel strategy: List each platform and its purpose. This helps you focus effort where it matters most.
  4. Track performance metrics: Use columns to capture reach, clicks, and conversions. Pair it with social media analytics tools for more profound insight.
  5. Create a reporting section: Include space for summaries and charts. This works well with social media reporting templates to present results.
  6. Review with data analysis: Dedicate a section for reflection and improvement. Adding data analysis for marketing helps refine future campaigns.

Top 5 Social Media Marketing Plan Templates for Google Sheets

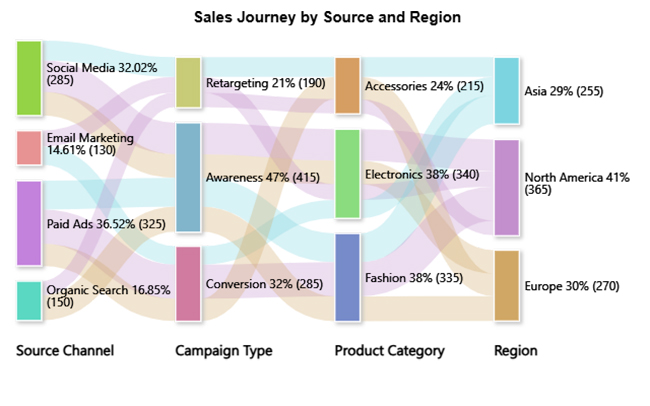
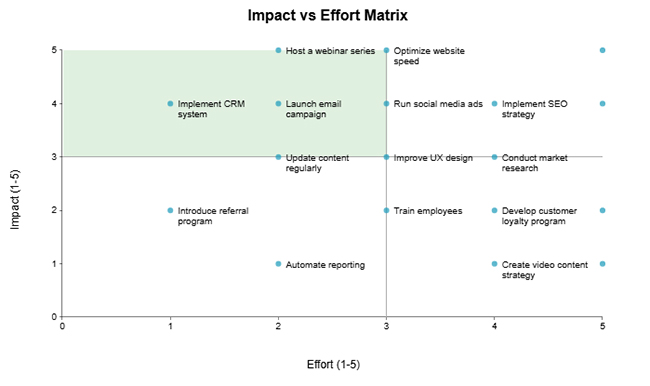
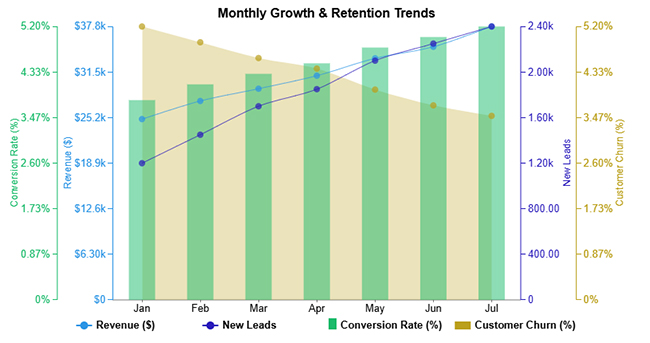
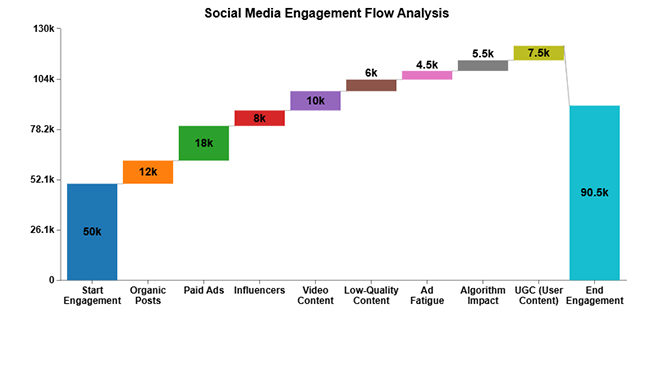
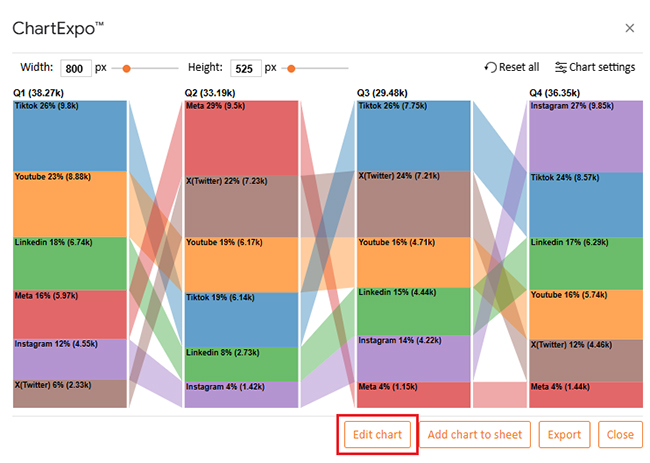
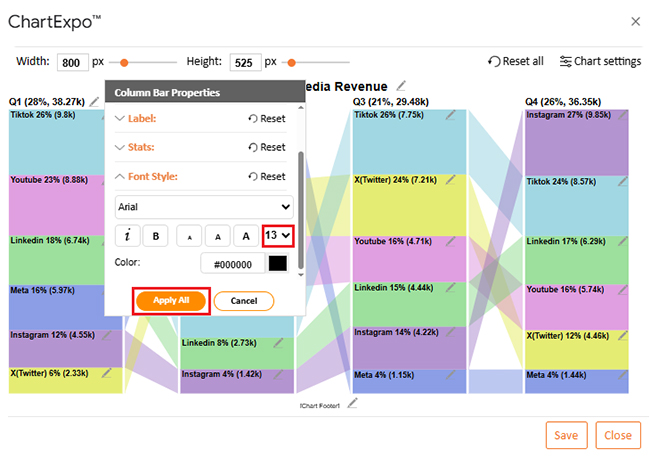
Visuals make data easier to understand and more persuasive. Instead of scanning endless rows in a spreadsheet, charts tell the story at a glance. In Google Sheets, ChartExpo offers visuals that transform a basic social media marketing plan into clear insights. Here are the top five examples you can use.

  • Sankey Chart: A Sankey Chart visualizes traffic flows through distinct stages, including awareness, engagement, and conversion. It helps you identify which channels have the most significant impact.
Template for Social Media Marketing Plan 1
  • Scatter Plot Chart: A Scatter Plot shows the relationship between two variables, such as post frequency and engagement. It highlights trends and outliers that guide campaign decisions.
Template for Social Media Marketing Plan 2
  • Comparison Bar Chart: A Comparison Bar Chart lets you evaluate channels or time periods side by side. It makes it easy to identify high-performing platforms and areas that need improvement.
Template for Social Media Marketing Plan 3
  • Multi-axis Line Chart: A Multi-Axis Line Chart tracks several KPIs together, such as leads, conversions, and churn. It reveals how metrics interact and shift over time.
Template for Social Media Marketing Plan 4
  • Waterfall Chart: A Waterfall Chart breaks down how different factors affect a key metric. It shows which activities drive growth and which drag performance down.
Template for Social Media Marketing Plan 5

How to Analyze a Social Media Marketing Plan Template in Google Sheets?

Spreadsheets are great until you try to make them tell a story. Numbers sit neatly in rows and columns, but without visuals, the meaning gets lost. Data visualization is the bridge that turns raw figures into real insight.

Google Sheets does the basics, but its charts often fall short of expectations. They lack the depth and flexibility required for serious data analysis in marketing. This is where ChartExpo steps in. It transforms dull spreadsheets into visuals that speak louder than numbers ever could.

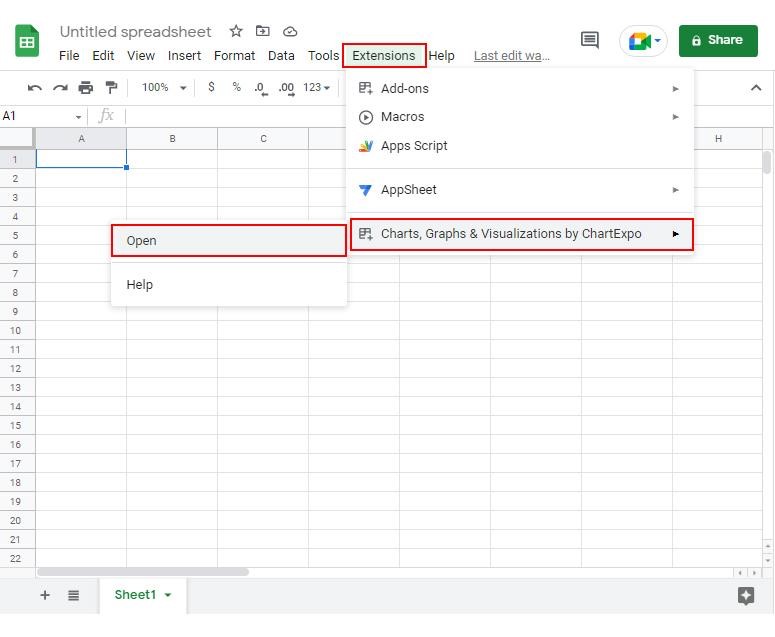
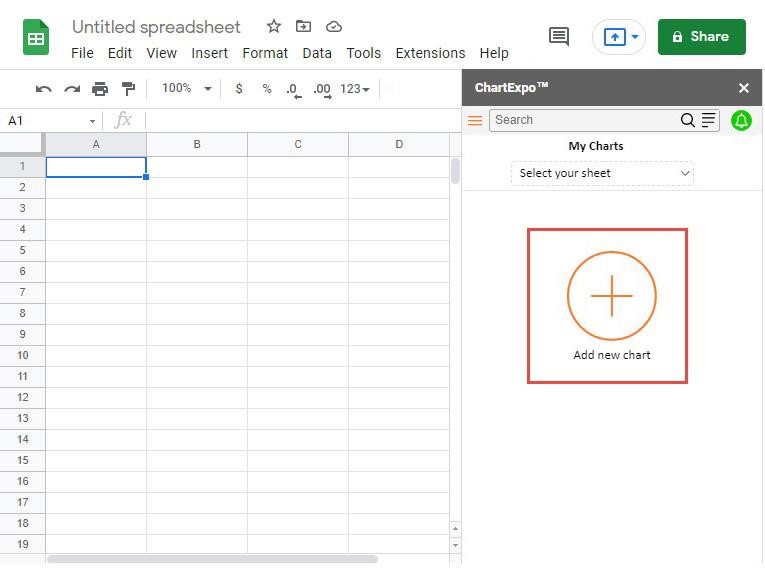
How to Install ChartExpo in Google Sheets?

  1. To start using ChartExpo, download it directly from the Google Sheets program. To do this, select Extensions from the top toolbar.
  2. A menu will appear. Click the Get add-ons option.
  3. Search for ChartExpo, and click on Charts, Graphs & Visualizations by ChartExpo when it appears in the results.
  4. Click the Install button. You will have to confirm your Google account and accept some permissions.

ChartExpo charts are available both in Google Sheets and Microsoft Excel. Please use the following CTAs to install the tool of your choice and create beautiful visualizations in a few clicks in your favorite tool.

Example

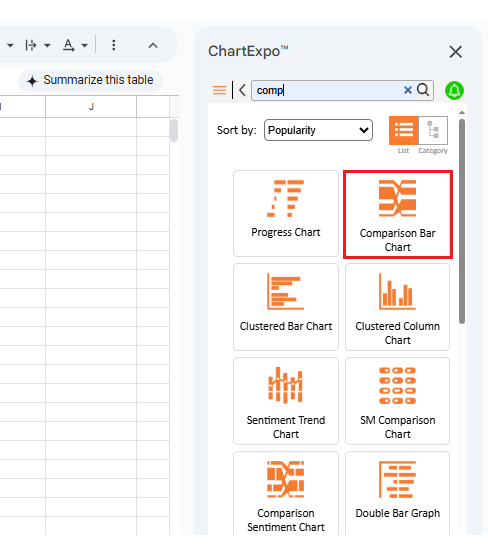
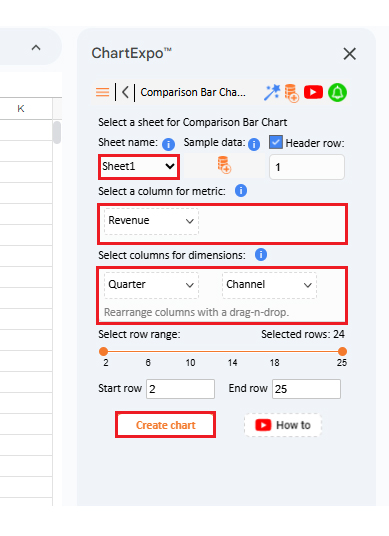
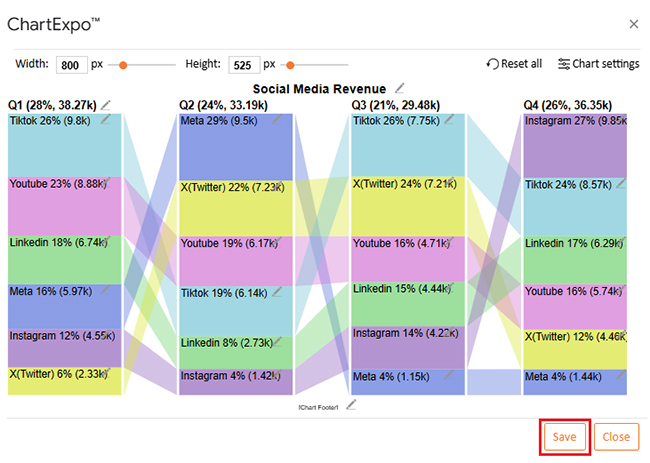
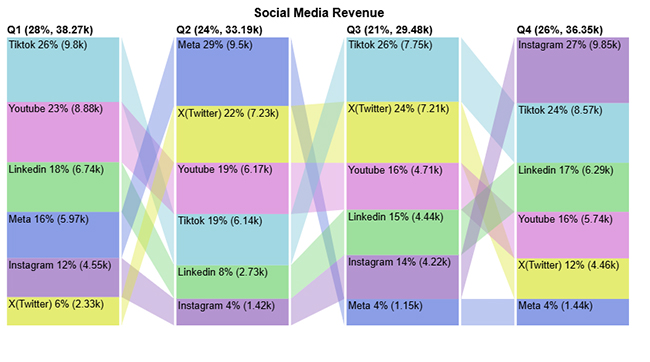
Let’s analyze this sample data in Google Sheets using ChartExpo.

Quarter Channel Revenue
Q1 YouTube 8879
Q2 YouTube 6168
Q3 YouTube 4708
Q4 YouTube 5739
Q1 TikTok 9798
Q2 TikTok 6144
Q3 TikTok 7750
Q4 TikTok 8569
Q1 X(Twitter) 2333
Q2 X(Twitter) 7233
Q3 X(Twitter) 7212
Q4 X(Twitter) 4463
Q1 Meta 5973
Q2 Meta 9504
Q3 Meta 1149
Q4 Meta 1441
Q1 Instagram 4549
Q2 Instagram 1419
Q3 Instagram 4216
Q4 Instagram 9848
Q1 LinkedIn 6743
Q2 LinkedIn 2725
Q3 LinkedIn 4443
Q4 LinkedIn 6289
  • To get started with ChartExpo, install ChartExpo in Google Sheets.
  • Go to Extensions > Charts, Graphs & Visualizations by ChartExpo > Open.
Template for Social Media Marketing Plan 6
  • To access the charts library, click the Add new chart button.
Template for Social Media Marketing Plan 7
  • Once ChartExpo is loaded. Click on “Comparison Bar Chart”.
Template for Social Media Marketing Plan 8
  • Select the sheet holding your data and select the Metric option. Fill in the numerical value.
  • Select the Dimensions button and fill in the dimensional data
  • Click the Create chart button to complete the process.
Template for Social Media Marketing Plan 9
  • Your tabular data will turn into a Comparison Bar chart, as shown below.
Template for Social Media Marketing Plan 10
  • To change the chart’s title, click the pencil icon next to the Chart Header.
  • It will open the properties dialog. Under the Text section, you can add a heading in Line 1 and enable the Show option. Give the appropriate title of your chart and click the Apply button.
Template for Social Media Marketing Plan 11
  • You can change the bar color as follows:
Template for Social Media Marketing Plan 12
  • You can show the percentage on the label as follows:
Template for Social Media Marketing Plan 13
  • You can also increase font size for better readability from “Font Style”.
Template for Social Media Marketing Plan 14
  • Click the “Save” button:
Template for Social Media Marketing Plan 15
  • Your final chart will appear as follows.
Template for Social Media Marketing Plan 16

Insights

  • TikTok: Leads in Q1 (26%) and Q3 (26%), still strong in Q4 (24%).
  • Meta: Peaks in Q2 (29%) but falls sharply to 4% in Q3 and Q4.
  • Instagram: Surges in Q4 with 27%, becoming the top channel after weaker earlier quarters.
  • X (Twitter): Grows from 6% in Q1 to 24% in Q3, then dips to 12% in Q4.

How to Download and Use the Social Media Marketing Plan Template in Google Sheets?

Getting started with a ready-to-use template makes planning smoother and faster. Instead of building everything from scratch, you can download a social media marketing plan template in Google Sheets. Then customize it for your goals. It saves time, keeps campaigns structured, and makes tracking results effortless. Here is how to download and use it:

  • Find a reliable template: Search for trusted sources that provide free or premium templates. Look for one that includes sections for goals, content, and performance tracking.
  • Download and open in Google Sheets: Most templates come in Excel or CSV format. Upload the file to Google Drive and open it directly in Google Sheets.
  • Customize the sections: Edit goals, timelines, and platforms to suit your specific needs. This ensures the template reflects your exact strategy.
  • Integrate analytics data: Connect the sheet with social media analytics tools or copy key metrics into the tracking section. This ensures that performance updates are accurate and easy to analyze.
  • Share and collaborate: Utilize Google Sheets’ sharing feature to work with your team or clients in real-time. You can also link it to a marketing agency client dashboard for better reporting.

Benefits of Using a Template for Social Media Marketing Plan

Planning social media without structure often feels messy and unorganized. A social media marketing plan template solves this by consolidating everything in one place. It simplifies strategy, saves time, and helps teams stay aligned.

Here are the key benefits of using one.

  • Keeps strategy organized: The template clearly maps out goals, content, and timelines. This prevents last-minute scrambling and missed opportunities.
  • Improves reporting: It pairs well with social media reporting templates to present data in a clean and organized manner. Clients and managers can understand results at a glance.
  • Supports smarter spending: Tracking costs alongside a marketing spend template keeps budgets in check. It makes financial decisions easier and more transparent.
  • Enhances data insights: By allocating space for data analysis in marketing, you can determine what works and what does not. This helps refine campaigns for better outcomes.
  • Boosts team collaboration: Google Sheets enables multiple users to edit in real-time. Everyone stays aligned, whether working in-house or with a client.

FAQs

How to make a social media calendar in Google Sheets?

  • Open Google Sheets.
  • Add columns for date, platform, content, and status.
  • Fill in planned posts.
  • Use color codes for clarity.
  • Update regularly to track progress.

How do I create a social media marketing plan?

  • Define clear goals.
  • Identify your target audience.
  • Choose platforms strategically.
  • Plan content in advance.
  • Track performance using social media analytics tools.
  • Adjust marketing strategies with insights from data analysis.

Wrap Up

A strong social media plan is not built on guesswork. It is built on structure, clarity, and consistent tracking. A template for a social media marketing plan in Google Sheets makes this possible. It brings order to campaigns and makes goals easier to reach.

Spreadsheets are simple, flexible, and easy to share. Teams can edit together and stay aligned. A plan in Google Sheets ensures every step is visible—no confusion and no missed details.

Adding numbers alone is not enough. You need insights that reveal the true meaning of the data. This is where social media analytics tools and data analysis for marketing come in. They turn plain figures into patterns that guide smart decisions.

Reporting is another key step. With social media reporting templates, presenting results becomes easier. A marketing agency client dashboard adds even more clarity. Clients and managers see the real impact without needing to dig through raw numbers.

But Google Sheets has limits in visualization. Standard charts often fail to convey the story effectively. This is why installing ChartExpo matters. It transforms plain spreadsheets into visuals that explain trends at a glance.

The next step is action. Install ChartExpo today and bring your template to life. Use it to track, analyze, and present your social media strategy with confidence. The right plan, powered by the right visuals, will make your marketing more innovative and more effective.

How much did you enjoy this article?

GSAd1
Start Free Trial!
158106

Related articles

next previous
Data Analytics12 min read

Cash Flow Analysis Template: A Complete Guide

A cash flow analysis template helps track inflows and outflows with clarity. Discover how Google Sheets and smart tools improve analysis and decision-making.

Data Analytics12 min read

Cap Table Template: Simplifying Equity Analysis

A cap table template tracks ownership and dilution. This blog shows how to create, analyze, and visualize cap tables in Google Sheets for better decisions.

Data Analytics14 min read

Visual Encoding: The Rules That Improve Insights

Visual encoding converts complex data into visuals that are simple to read. It uses color, size, shape, and position to reveal trends, comparisons, and insights.

Data Analytics15 min read

Operational Reporting for Data-Driven Operations

Operational Reporting tracks daily performance with real-time data. Discover its benefits, examples, and Power BI tips to make smarter business decisions.

Data Analytics12 min read

Restaurant Profit and Loss Template for Data Insights

A Restaurant Profit and Loss Template shows income and costs. Learn how to create, use, and analyze it in Excel to make smarter decisions and boost profits.

ChartExpo logo

Turn Data into Visual
Stories

CHARTEXPO

  • Home
  • Gallery
  • Videos
  • Services
  • Pricing
  • Contact us
  • FAQs
  • Privacy policy
  • Terms of Service
  • Sitemap

TOOLS

  • ChartExpo for Google Sheets
  • ChartExpo for Microsoft Excel
  • Power BI Custom Visuals by ChartExpo
  • Word Cloud

CATEGORIES

  • Bar Charts
  • Circle Graphs
  • Column Charts
  • Combo Charts
  • Comparison Charts
  • Line Graphs
  • PPC Charts
  • Sentiment Analysis Charts
  • Survey Charts

TOP CHARTS

  • Sankey Diagram
  • Likert Scale Chart
  • Comparison Bar Chart
  • Pareto Chart
  • Funnel Chart
  • Gauge Chart
  • Radar Chart
  • Radial Bar Chart
  • Sunburst Chart
  • see more
  • Scatter Plot Chart
  • CSAT Survey Bar Chart
  • CSAT Survey Chart
  • Dot Plot Chart
  • Double Bar Graph
  • Matrix Chart
  • Multi Axis Line Chart
  • Overlapping Bar Chart
  • Control Chart
  • Slope Chart
  • Clustered Bar Chart
  • Clustered Column Chart
  • Box and Whisker Plot
  • Tornado Chart
  • Waterfall Chart
  • Word Cloud
  • see less

RESOURCES

  • Blog
  • Resources
  • YouTube
SIGN UP FOR UPDATES

We wouldn't dream of spamming you or selling your info.

© 2026 ChartExpo, all rights reserved.