Categories
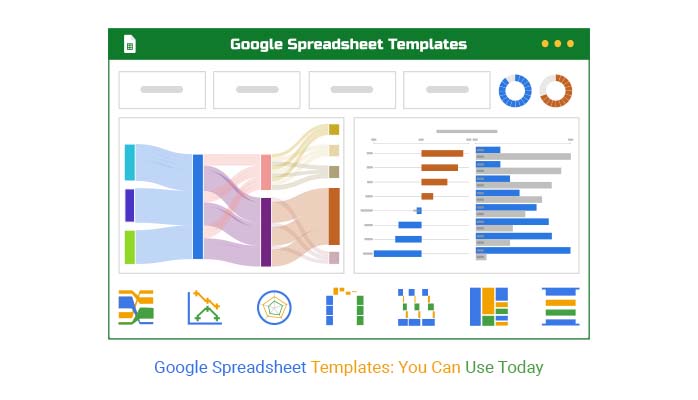
Google spreadsheet templates—Have you explored how much time they could save you?
Spreadsheets aren’t just for data crunching anymore. Billions of people use Google Workspace, and many rely on templates to simplify their daily workflow. Businesses that use tools like the job application tracker template have faster hiring processes and fewer bottlenecks.
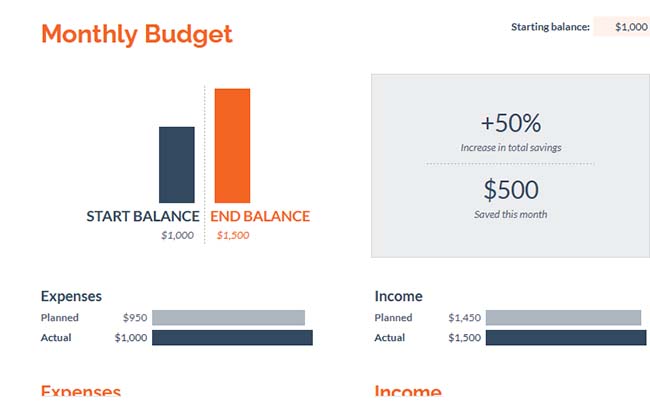
Innovative teams build systems that work for them. A Google spreadsheets profit and loss template helps you monitor your business’s financial health without complicated software. And a good budget template ensures you always know where your money is going, down to the cent.
Google spreadsheet templates eliminate guesswork. Whether managing expenses, hiring new talent, or monitoring profits, the proper structure saves hours.
The good news? You don’t need to build these tools from scratch. We’ve gathered powerful templates that cover essential areas—from operations to HR to finance.
This post will show you how to streamline your workday using efficient, flexible tools. Faster workflows start with innovative templates. And it all begins right here.
So…
Definition: Google spreadsheet templates are pre-formatted spreadsheets built for specific tasks. They help you skip setup and focus on results. Whether it’s a market analysis template or an analytical report template, these tools simplify your workflow.
How does it work?
You enter your data, and the structure takes care of the rest. Charts, formulas, and layouts are ready to go. Businesses use them to save time and reduce errors. As a result, reporting and planning become faster, cleaner, and easier to manage.
Running a business is all about speed, clarity, and teamwork. But chaos creeps in when every department uses a different system. That’s where Google Spreadsheets templates step in—they bring order and momentum with almost zero setup.
How?
Managing business tasks can quickly become overwhelming without the right tools. Google Spreadsheets templates simplify your workload by offering ready-made solutions that save time and boost efficiency. Here are 10 essential templates explained in simple terms:


Creating your own Google Spreadsheet template can save you hours. It’s about making a tool that fits your needs perfectly. And the best part? You don’t need to be a spreadsheet expert to build one that works smoothly. Here’s how to create the best template step-by-step:
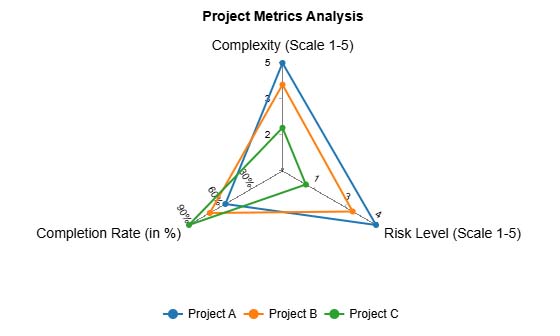
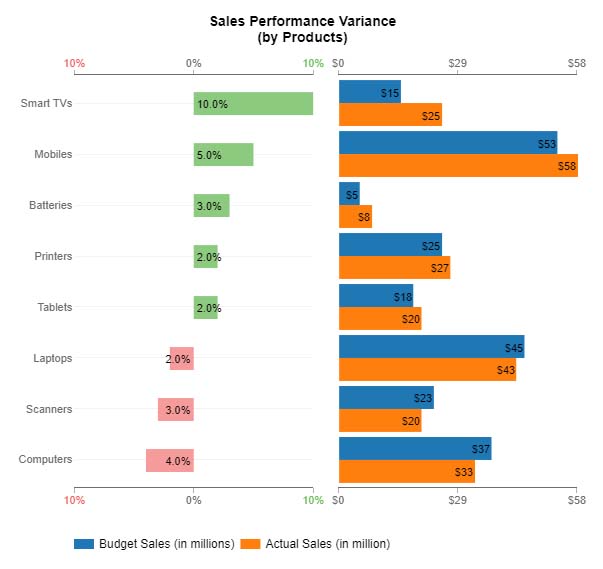
Visuals are the secret sauce for turning raw data into clear insights. ChartExpo in Google Spreadsheets makes creating these visuals easy and impactful, including a progress bar in Google Sheets. Let’s break down the top 10 visual types that bring data to life—simple to understand and powerful to use:


Let’s face it—staring at endless rows in Google Spreadsheets can feel like decoding hieroglyphics. You’ve got data, but turning it into insightful decisions? That’s another story. Google Spreadsheet templates help you stay organized and efficient. But when it comes to visuals, Sheets tends to play it safe—and a little flat.
Basic graphs can’t always tell the whole story. And that’s where ChartExpo steps in. This Google Sheets add-on transforms dull data into sharp, insightful visuals that mean something. From tracking budgets to building out your market analysis template, ChartExpo adds the punch that Google Spreadsheets is missing.
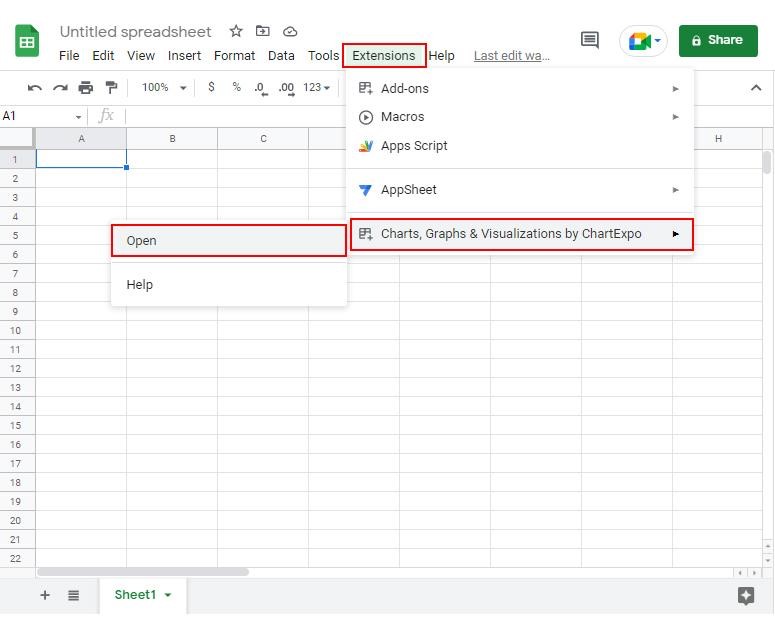
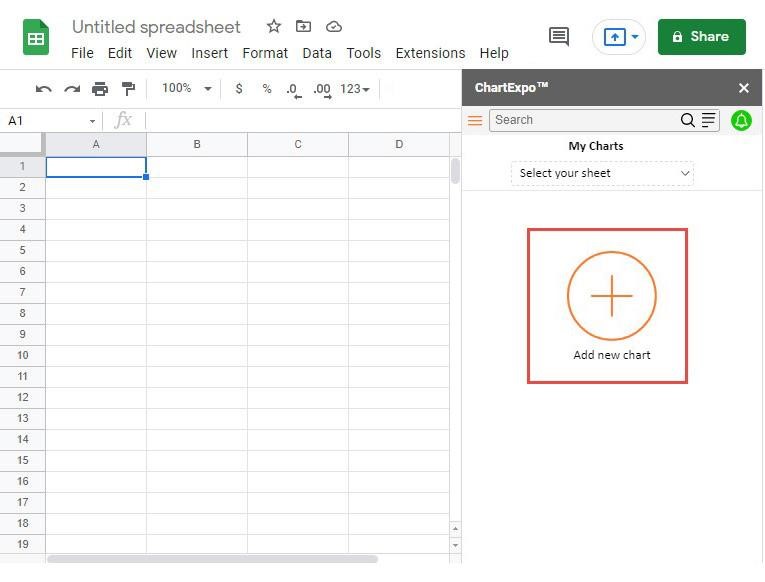
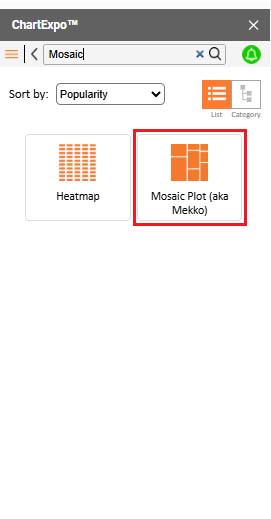
How to Install ChartExpo in Google Spreadsheets?
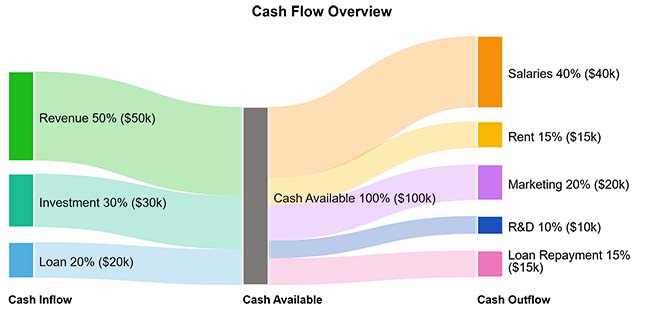
ChartExpo is available for both Google Sheets and Microsoft Excel. Use the following CTAs to install your preferred tool and create a Sankey diagram in Google Sheets or other stunning visualizations in just a few clicks.
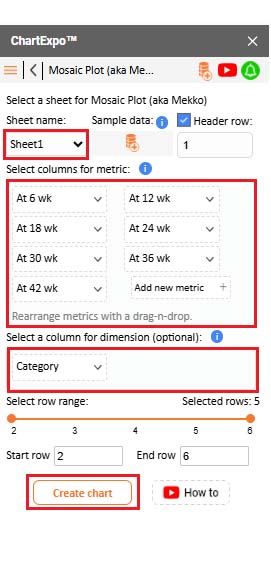
Let’s analyze this sample data in Google Spreadsheets using ChartExpo, and analyze it.
| Category | At 6 wk | At 12 wk | At 18 wk | At 24 wk | At 30 wk | At 36 wk | At 42 wk |
| NE | 7 | 42 | 96 | 134 | 158 | 203 | 230 |
| PSA increase | 109 | 73 | 40 | 25 | 23 | 10 | 18 |
| >=0-<50% decline | 93 | 49 | 35 | 22 | 16 | 18 | 8 |
| >=50-<90% decline | 89 | 104 | 87 | 65 | 54 | 33 | 18 |
| >=90% decline | 22 | 52 | 62 | 74 | 69 | 56 | 46 |
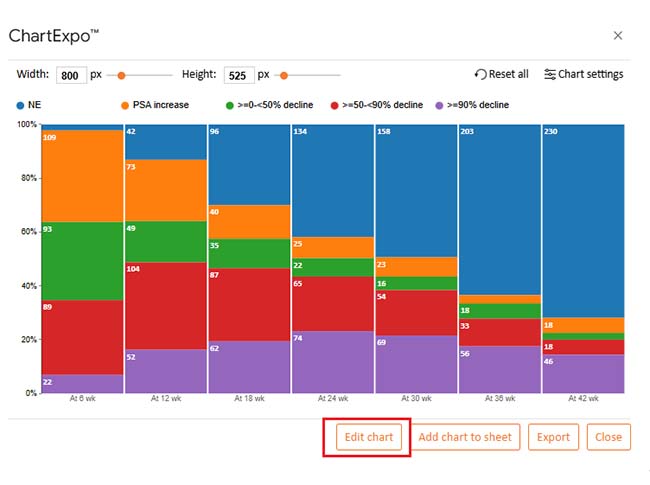
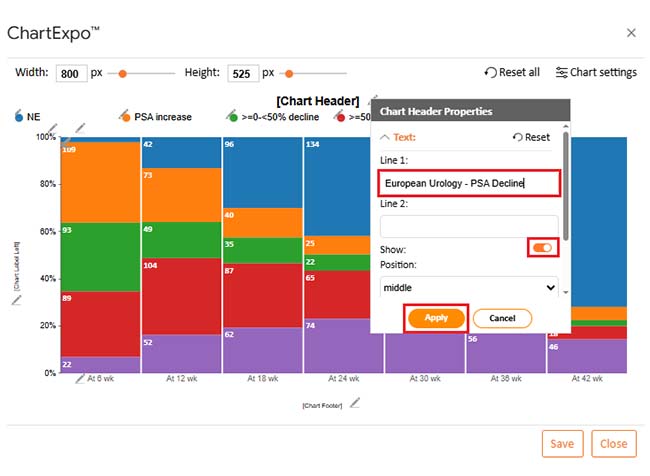
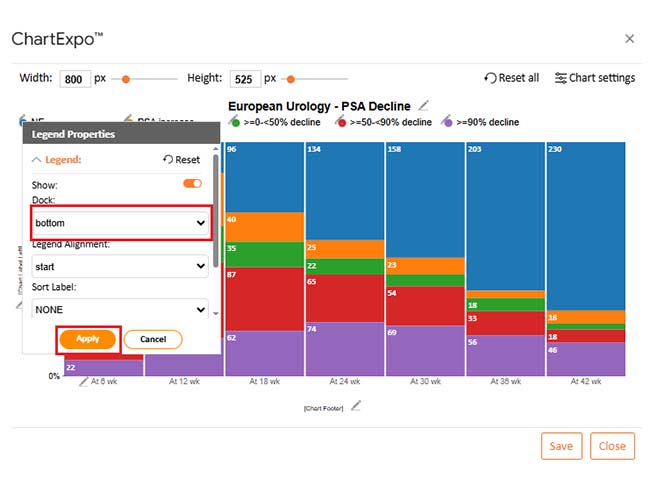
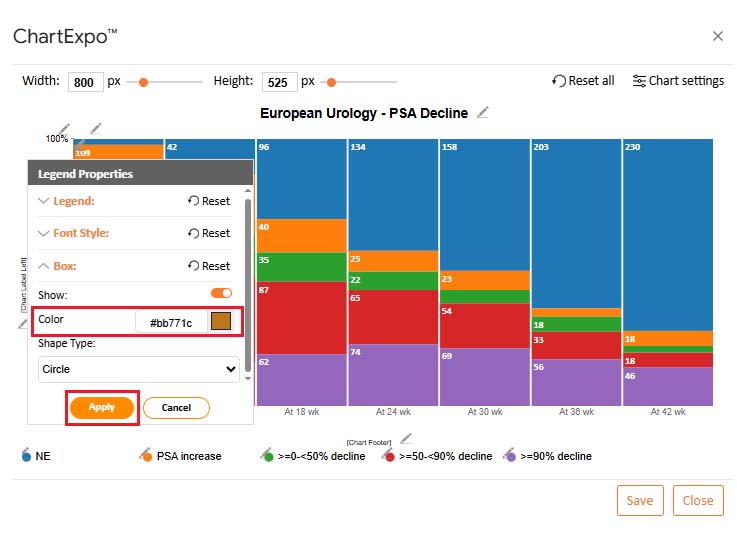
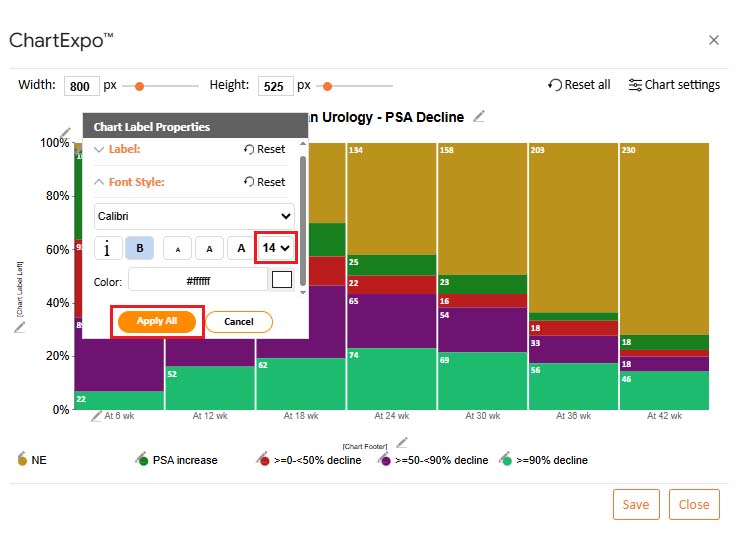
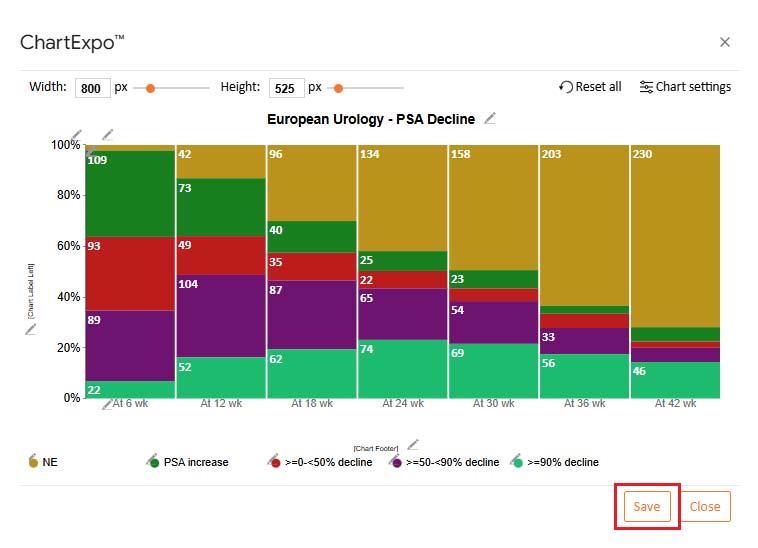
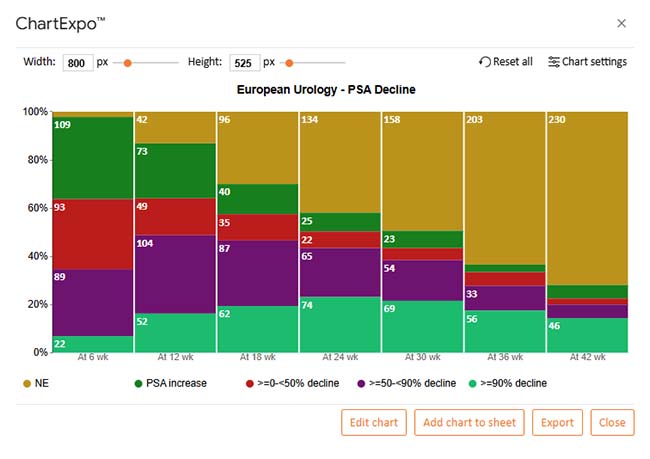
We can track PSA response trends over 42 weeks (European Urology study).
Non-Evaluable (NE) Group:
90% PSA decline group:
Moderate responders:
Minimal responders & PSA rise group:
Let’s be honest—starting with a blank spreadsheet can feel overwhelming. But Google Spreadsheets gives you more innovative options. Whether you need a job application or a detailed profit and loss template, downloading ready-to-use templates is fast and straightforward, making it the best graph to show profit and loss. Here’s how to get them:
Spreadsheets don’t have to be a chore. With the right template, they become your shortcut to clarity, speed, and more intelligent decisions. Whether you’re running a startup or managing team goals, templates help you skip the setup and dive straight into the work.
Here’s why they’re worth using:
Templates can make your spreadsheets feel less like a chore and more like a secret weapon. Whether you’re tracking leads or planning budgets, innovative use of templates keeps your business sharp and organized. Here are some tips to follow:
Google spreadsheet templates make your work faster and smarter. You don’t have to start from scratch; templates save time and reduce errors. They help keep everything organized.
Whether you’re tracking travel or managing leads, there’s a template for that. A travel expenses spreadsheet template keeps trip costs in check. It tracks flights, hotels, and meals in one place. You’ll never lose track of receipts again.
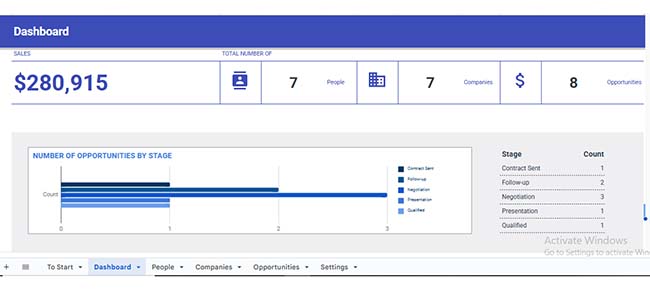
Need to manage clients? Use Google Spreadsheets templates. They help you follow leads, track contacts, and manage deals. Everything stays in one simple dashboard—no expensive software needed.
For deeper insights, try a market research report template. Collect and sort customer data with ease, see trends, and take action faster. Clear visuals help you make decisions.
Conclusively, templates boost teamwork. Everyone sees the same structure, as real-time updates keep your team aligned. No confusion, no duplication. So, do not hesitate; start using templates today. Pick one that fits your goal, save it, share it, and reuse it. With the right tools, your workflow runs smoothly.
How much did you enjoy this article?


SUMPRODUCT in Google Sheets handles multi-condition calculations without extra columns. Master its syntax, uses, and errors. Read on!

An annual budget template in Google Sheets organizes your yearly finances, tracks every dollar, and reveals spending patterns. Read on!

Learn the best graph to show profit and loss with practical examples and use cases. Discover how to visualize your business data, track trends, and make smarter financial decisions.


