Categories
Picture this: You’re in a room full of mirrors, surrounded by your colleagues, and they all have megaphones. They start shouting their opinions about your performance and feel like you’re drowning in a sea of feedback.


Sounds like a nightmare, right?
Welcome to the world of performance reviews.
There’s a secret weapon that can turn this chaos into clarity: the 360-degree review template. It’s like a supercharged feedback compass that shows you the way to self-improvement. This template will help you gather feedback from all angles: your boss, your teammates, and even yourself.
No longer will you be at the mercy of a single person’s biased opinion. The employee 360 review template gives you a panoramic view of your strengths, weaknesses, and areas for improvement. It’s like strapping on a pair of 360-degree goggles and seeing your performance from every angle.
Get ready to revolutionize your feedback game and take control of your professional destiny. This blog post will take you through the employee 360 review template to help you gather well-rounded feedback.
Let’s get started.
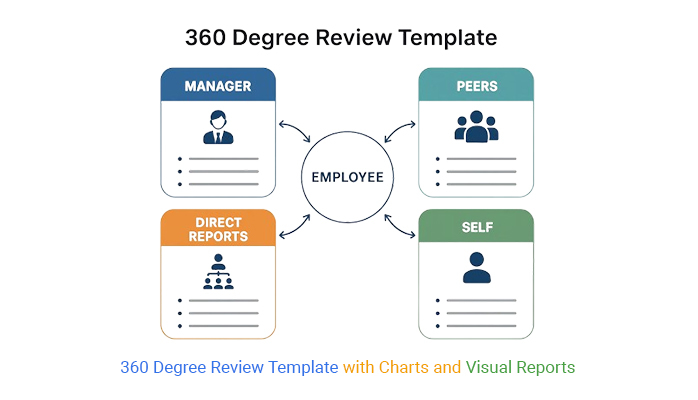
Definition: A 360-degree review template is a structured tool used to gather feedback on an employee’s performance from multiple perspectives, including managers, peers, direct reports, and self-assessments.
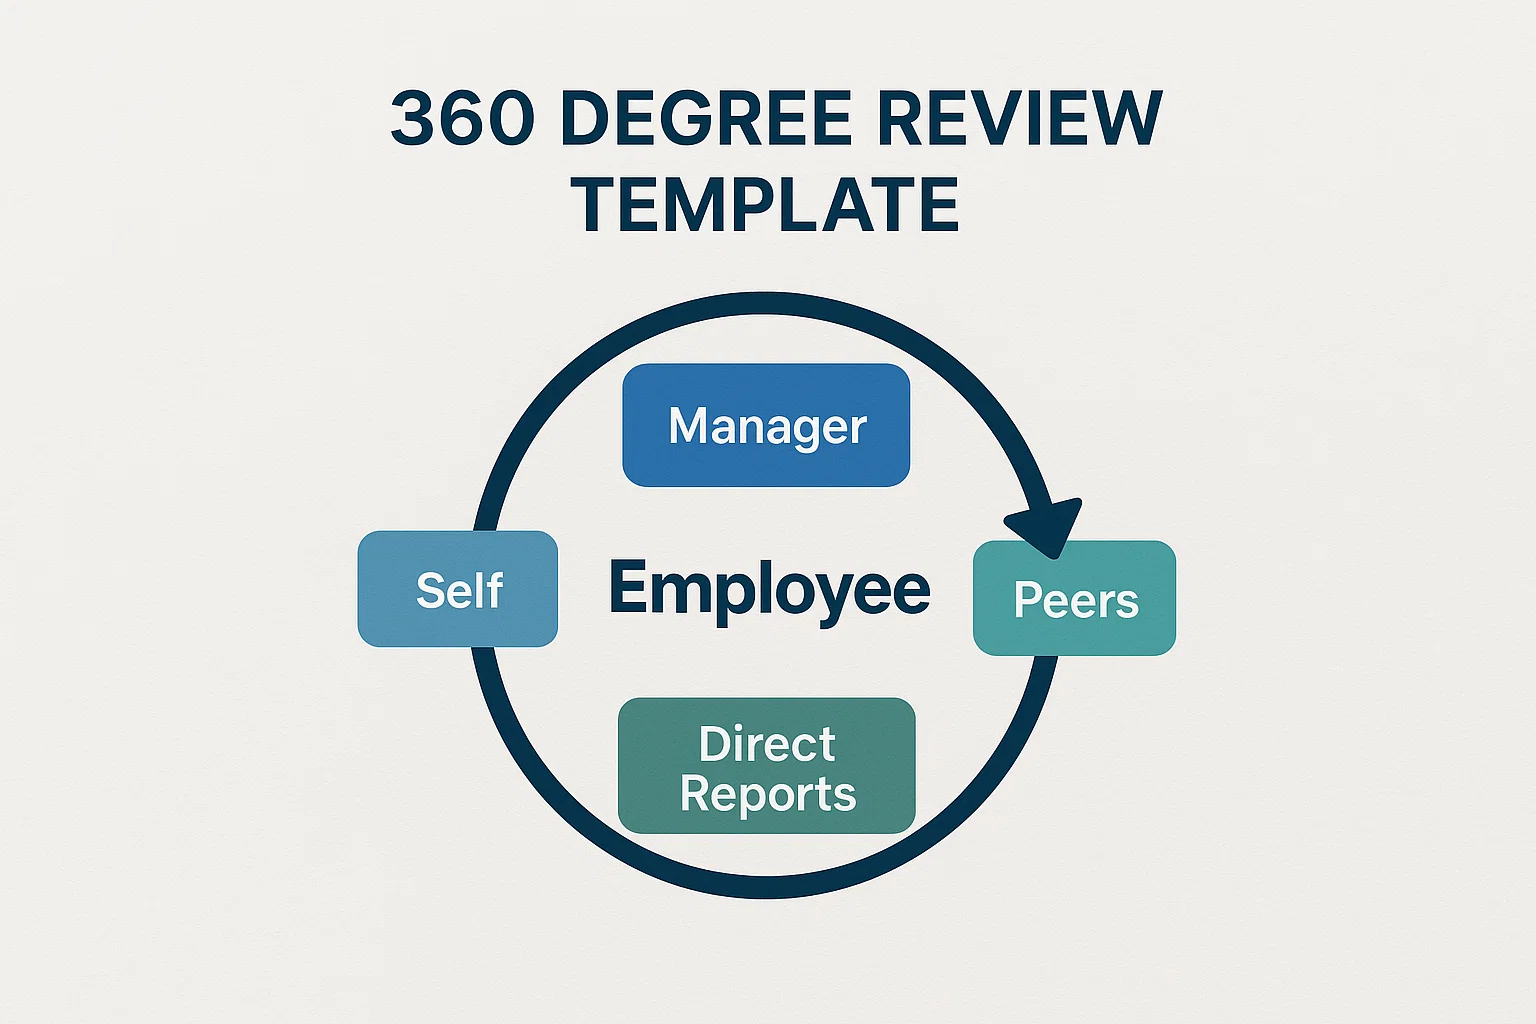
It combines rating scales and open-ended questions to evaluate skills, behaviors, and competencies, giving a well-rounded view of strengths and areas for improvement. This format helps organizations support employee growth, enhance teamwork, and make performance evaluations more balanced and fair.
A 360 review template is essential because it provides a complete view of an employee’s performance, rather than relying on just one perspective. Traditional reviews often focus only on a manager’s feedback, which can leave blind spots. With a 360 employee review template, you collect input from managers, peers, direct reports, and even self-evaluations.
This balanced approach helps:
Covers core areas like communication, teamwork, and accountability. Perfect for small teams or first-time use.
Focuses on leadership qualities such as decision-making, strategic thinking, and team management. Useful for managers and executives.
A 360 peer review template is designed to gather input from colleagues at the same level. It helps identify collaboration skills, reliability, and interpersonal effectiveness.
Encourages employees to evaluate their own strengths and weaknesses. Promotes self-awareness and goal alignment.
Includes rating scales, open-ended questions, and goal-setting sections. Best for organizations seeking a complete view of performance and development needs.
Here are 10 common 360 performance review questions:
Here are the 7 steps to follow in the 360 review process template:
Decide what you want to achieve with the feedback: employee development, leadership assessment, or performance improvement.
List the core skills and behaviors to evaluate, such as communication, teamwork, problem-solving, and leadership.
Use a mix of rating scale questions for measurable insights and open-ended questions for detailed 360 feedback.
Ensure responses remain confidential to encourage honesty and unbiased feedback.
Include inputs from managers, peers, subordinates, and even self-assessments for a complete 360 view.
Avoid overly complex or lengthy questions. Make the template easy to understand and complete.
Pilot the template with a small group, gather feedback, and adjust before rolling it out organization-wide.
Data analysis, my friend, is no stroll through the park. It’s more like a treacherous hike up Mount Everest, filled with complex algorithms and mind-boggling statistics.
But fear not, for there is a superhero in the world of data analysis – data visualization. Data visualization transforms dull numbers into captivating visuals that even your grandma would understand.
However, Excel, the trusty sidekick, falls short in the realm of data visualization. That’s where ChartExpo comes to the rescue with its superpowers of creating appealing, insightful charts and graphs. It makes data analysis a thrilling adventure rather than a mind-numbing chore.
Benefits of Using ChartExpo
How to Install ChartExpo in Excel?
ChartExpo charts are available both in Google Sheets and Microsoft Excel. Please use the following CTA’s to install the tool of your choice and create beautiful visualizations in a few clicks in your favorite tool.
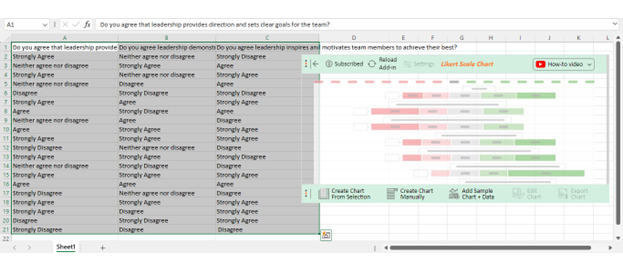
Assume you have conducted a 360 review survey and obtained the data below.
| Do you agree that leadership provides direction and sets clear goals for the team? | Do you agree that leadership demonstrates adaptability and resilience in challenging situations? | Do you agree that leadership inspires and motivates team members to achieve their best? |
| Strongly Agree | Neither agree nor disagree | Strongly Disagree |
| Neither agree nor disagree | Strongly Agree | Agree |
| Strongly Agree | Neither agree nor disagree | Strongly Agree |
| Neither agree nor disagree | Disagree | Agree |
| Disagree | Strongly Disagree | Strongly Disagree |
| Strongly Agree | Agree | Strongly Agree |
| Agree | Strongly Disagree | Agree |
| Neither agree nor disagree | Agree | Disagree |
| Agree | Strongly Agree | Strongly Agree |
| Strongly Agree | Strongly Agree | Strongly Agree |
| Strongly Disagree | Neither agree nor disagree | Disagree |
| Strongly Agree | Strongly Agree | Strongly Disagree |
| Neither agree nor disagree | Strongly Disagree | Disagree |
| Strongly Agree | Strongly Agree | Strongly Agree |
| Agree | Agree | Agree |
| Strongly Disagree | Neither agree nor disagree | Disagree |
| Strongly Agree | Strongly Agree | Strongly Agree |
| Strongly Agree | Disagree | Strongly Agree |
| Disagree | Strongly Disagree | Strongly Agree |
| Strongly Disagree | Disagree | Disagree |
This table contains example data. Expect many responses and questions in real life.


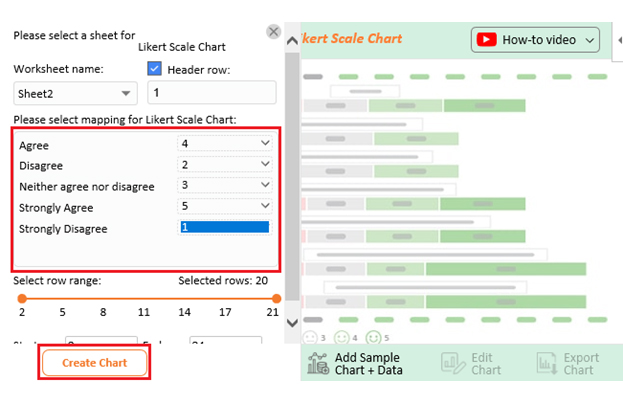
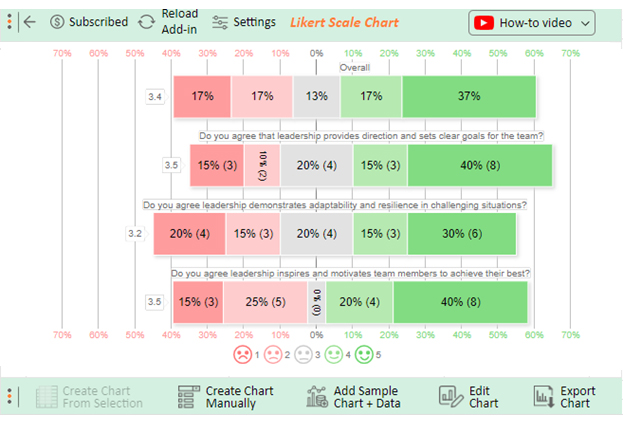
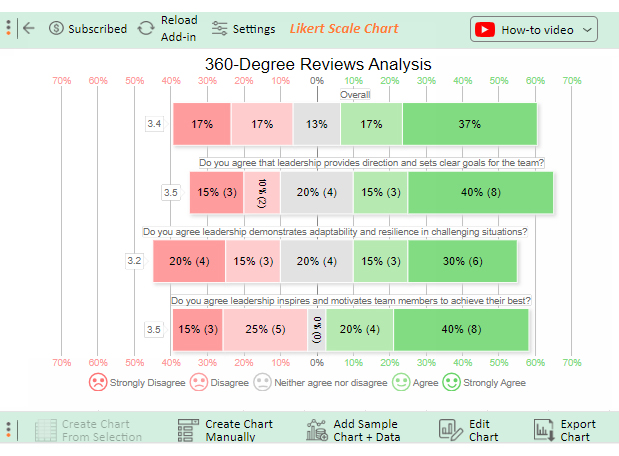
The data from the 5-point performance rating scale shows a generally positive view of leadership, with strong agreement on providing guidance, flexibility, and motivation. However, there are slight variations in responses, suggesting room for improvement—especially in handling challenging situations and inspiring team members to enhance overall leadership effectiveness.
Collects insights from managers, peers, subordinates, and self-assessments for a complete performance view.
Helps employees understand how others perceive their strengths and weaknesses.
Highlights areas for development, guiding employees in skill-building and career progression.
Strengthens communication and trust within teams by incorporating multiple perspectives.
Identifies leadership qualities and areas to improve, useful for succession planning and promotions.
Feedback may be influenced by personal relationships, leading to unfair evaluations.
Gathering and analyzing input from multiple sources can take significant time and effort.
Employees may feel stressed about receiving critical feedback from multiple directions.
Without clear guidelines, the process can lead to confusion or misinterpretation of results.
Feedback may lack specificity, making it hard for employees to turn insights into measurable improvements.
Make sure you know why you’re conducting the review—whether it’s for employee development, leadership growth, or a 360-degree performance review template.
Include questions that reflect key skills, behaviors, and competencies that matter most to your organization.
Allow participants to share input confidentially so they feel comfortable being open and constructive.
Encourage reviewers to give both positive recognition and constructive suggestions for improvement.
Support employees with coaching, resources, or action plans so they can turn insights into real growth.
A 360 review usually includes questions about communication, teamwork, leadership, accountability, problem-solving, adaptability, and overall performance. These can be a mix of rating-scale questions (e.g., “How effectively does the employee collaborate with others?”) and open-ended questions (e.g., “What are this employee’s key strengths?”).
The 360-degree review process is a feedback method where employees receive evaluations from multiple sources—such as managers, peers, subordinates, and sometimes clients. This approach provides a well-rounded view of performance by combining different perspectives to highlight strengths and areas for improvement.
The duration of a 360 review varies but typically spans 4-6 weeks. This allows ample time for participants to provide thoughtful feedback and reviewers to analyze responses. Also, it allows for follow-up discussions and action planning.
A 360-degree review template is essential for obtaining diverse feedback from peers, subordinates, and supervisors. It promotes comprehensive self-awareness, identifies blind spots, enhances accountability, and aids in continuous development. Thus, it fosters a holistic understanding of individual performance.
A 360-degree review template is an essential tool for cultivating a comprehensive understanding of individual performance. Its significance lies in its ability to gather feedback from peers, subordinates, and supervisors, offering a holistic perspective. This diversity of viewpoints ensures a more nuanced and accurate evaluation compared to traditional assessments.
This template is a catalyst for personal development, providing individuals with a structured mechanism for self-awareness and improvement. Identifying blind spots and areas for growth guides professionals toward continuous development. Moreover, the template fosters accountability by showcasing the impact of your actions on team dynamics. This creates a culture of responsibility and collaboration.
Embracing the 360-degree review template contributes to organizational excellence. It aligns individual goals with broader objectives, ensuring that each team member’s contribution supports the overall mission. The template’s incorporation of varied viewpoints not only promotes fairness but also aids in strategic decision-making. Managers make informed choices based on a comprehensive understanding of individual strengths and areas for improvement.
Coupling the 360 peer review template with ChartExpo transforms feedback into actionable insights. This collaboration ensures a comprehensive understanding of performance, fostering self-awareness and guiding targeted development.
Do not hesitate.
Join the ChartExpo party and make your data the life of the party.
How much did you enjoy this article?


Google Forms to Google Sheets keeps your data organized and current with every submission. Learn the steps, methods, and tips now!

Product survey questions reveal what customers truly think. Learn how to ask the right ones and act on the survey results. Read on!

Learn how the 5-Point Performance Rating Scale improves employee evaluations with clear, consistent, and fair performance reviews across teams.


