• Home
  • Tools dropdown img
    • Spreadsheet Charts

      • ChartExpo for Google Sheets
      • ChartExpo for Microsoft Excel
    • Power BI Charts

      • Power BI Custom Visuals by ChartExpo
    • Word Cloud

  • Charts dropdown img
    • Chart Category

      • Bar Charts
      • Circle Graphs
      • Column Charts
      • Combo Charts
      • Comparison Charts
      • Line Graphs
      • PPC Charts
      • Sentiment Analysis Charts
      • Survey Charts
    • Chart Type

      • Box and Whisker Plot
      • Clustered Bar Chart
      • Clustered Column Chart
      • Comparison Bar Chart
      • Control Chart
      • CSAT Survey Bar Chart
      • CSAT Survey Chart
      • Dot Plot Chart
      • Double Bar Graph
      • Funnel Chart
      • Gauge Chart
      • Likert Scale Chart
      • Matrix Chart
      • Multi Axis Line Chart
      • Overlapping Bar Chart
      • Pareto Chart
      • Radar Chart
      • Radial Bar Chart
      • Sankey Diagram
      • Scatter Plot Chart
      • Slope Chart
      • Sunburst Chart
      • Tornado Chart
      • Waterfall Chart
      • Word Cloud
    • Google Sheets
      Microsoft Excel
  • Services
  • Pricing
  • Contact us
  • Blog
  • Support dropdown img
      • Gallery
      • Videos
      • Contact us
      • FAQs
      • Resources
    • Please feel free to contact us

      atsupport@chartexpo.com

Categories
All Data Visualizations Data Analytics Surveys
Add-ons/
  • Google Sheets
  • Microsoft Excel
  • Power BI
All Data Visualizations Data Analytics Surveys
Add-ons
  • Google Sheets
  • Microsoft Excel
  • Power BI

We use cookies

This website uses cookies to provide better user experience and user's session management.
By continuing visiting this website you consent the use of these cookies.

Ok

ChartExpo Survey


Home > Blog > Microsoft Excel

Social Media Reporting Templates for Tracking Success

Are social media reporting templates truly useful?

Imagine this: You are a social media manager overwhelmed by data from various platforms. Your manager requires a thorough report by tomorrow. Panic sets in.

But wait! There’s a solution – social media reporting templates – your lifeline in the digital marketing storm.

Social Media Reporting Templates

These templates aren’t mere time-savers. These are effective instruments that turn unprocessed data into valuable insights. Did you know that 92% of marketers believe social media is essential for their business? Yet, many struggle to prove its value. Social media reporting templates bridge this gap.

They offer structure and consistency. Monthly reports track short-term goals. Quarterly reports reveal long-term trends. Campaign-specific templates spotlight individual initiatives. Each serves a unique purpose, tailored to your needs.

But the benefits don’t stop there. These templates boost efficiency. They help identify what’s working and what’s not. They provide competitor insights and justify your social media investments to stakeholders.

Imagine presenting a visually appealing, data-rich report that showcases your Instagram Reels outperforming Carousel posts. Or discovering an unexpected surge in Latvian teenage followers. Social media reporting templates make these insights accessible and actionable.

Let’s demystify social media reporting templates – your secret weapon in the fast-paced world of social media marketing.

Table of Contents:

  1. What is a Social Media Reporting Template?
  2. Top 5 Charts for Social Media Reporting
  3. Why is the Social Media Report Format Useful?
  4. What is Included in a Social Media Reporting Template?
  5. How Many Types of Social Media Analytic Reporting Templates?
  6. How to Create the Best Social Media Reporting Template?
  7. What are the Best Practices for Building Your Social Media Report Template?
  8. Wrap Up

First…

What is a Social Media Reporting Template?

Definition: A social media reporting template is a tool for tracking and analyzing social media performance. It organizes key metrics and data in one place. This helps to understand trends and measure success.

The template typically includes sections for engagement, reach, and follower growth. It can be customized to fit specific goals and platforms.

Regular use of this template simplifies reporting. It provides a clear overview of social media efforts, allowing for better strategy adjustments. Ultimately, it helps make data-driven decisions and improve overall social media effectiveness.

Top 5 Charts for Social Media Reporting

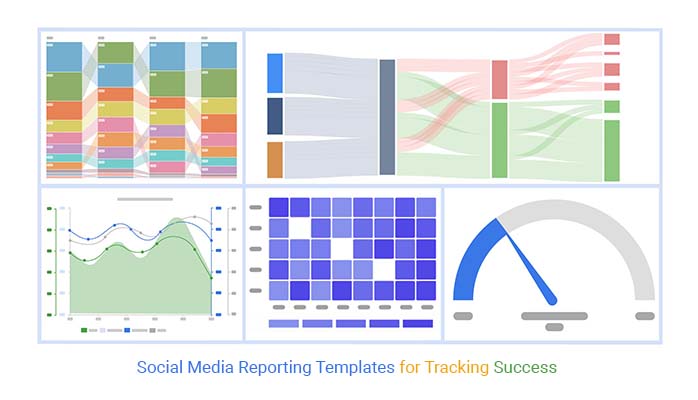
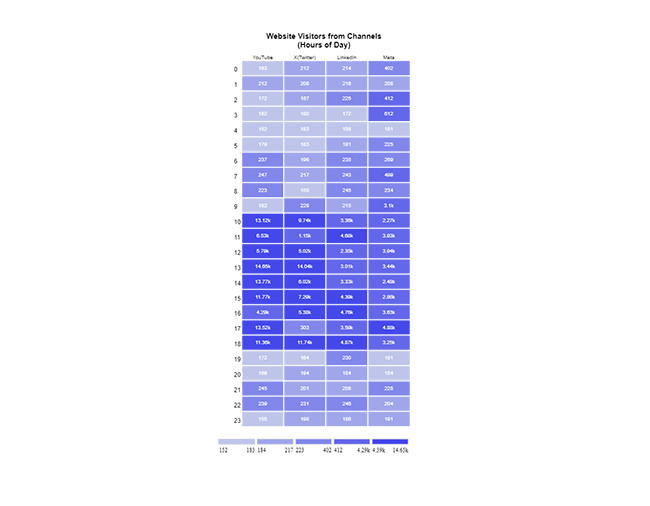
Here are the top 5 charts for social media reporting created in Excel using ChartExpo.

Comparison Bar Chart

Comparison Bar Chart for Social Media Reporting Templates

Gauge Chart

Gauge Chart for Social Media Reporting Templates

Sankey Chart

Sankey Chart for Social Media Reporting Templates

Heatmap

Heatmap for Social Media Reporting Templates

Multi Axis Line Chart

Multi Axis Line Chart for Social Media Reporting Templates

Why is the Social Media Report Format Useful?

A well-structured social media report format can revolutionize how you handle your online presence. Here are the key reasons why it’s so useful:

  • Organized insights and performance tracking: Structuring your data analysis helps you easily track and monitor your social media performance. This enables you to stay on top of trends and metrics.
  • Enhanced decision-making through data visualization: Visualizing data, including through a YouTube analytics report, allows for quick interpretation, making it easier to make informed decisions that boost your strategy.
  • Effective communication and continuous improvement: Sharing clear, concise reports improves communication with stakeholders and fosters continuous improvement by identifying areas for enhancement.

What is Included in a Social Media Reporting Template?

Creating a social media reporting template can make managing your online presence a breeze. Here’s what you should include:

  1. Overview: Summarize your social media activities and performance over the data reporting period. Highlight major achievements, such as significant growth in followers or successful campaigns.
  2. Key metrics: Include essential data points such as engagement rate, reach, impressions, follower count, and click-through rates. These metrics provide a snapshot of your social media health and effectiveness.
  3. Platform performance: Break down performance by each social media platform (e.g., Facebook, Instagram, X). This helps identify which platforms drive the most engagement and where your audience is most active.
  4. Content analysis: Analyze the performance of individual posts and types of content (e.g., videos, images, stories). Identify which content resonates most with your audience, leading to higher engagement and interactions.
  5. Audience insights: Examine your audience demographics and customer behaviors. Understand the age, gender, location, and interests of your followers to tailor your content and engagement strategies effectively.
  6. Trends and comparisons: Compare current performance with previous periods to identify trends and patterns. Look at month-over-month or year-over-year changes to see how your strategy evolves and where you can improve.
  7. Goals and recommendations: Set specific, measurable goals based on your analysis. Provide actionable recommendations for improving performance, such as adjusting content strategy, increasing posting frequency, or exploring new platforms.

How Many Types of Social Media Analytic Reporting Templates?

Social media can be overwhelming, but having the right reporting templates can make all the difference. Here are the various types of social media analytic reporting templates you can use:

  1. Weekly Report Templates: These provide a quick snapshot of your social media performance on a week-to-week basis, helping you stay agile and responsive.
  2. Monthly Report Templates: Offering a more comprehensive view, these templates summarize your social media activities and performance over a month. They allow for deeper insights and trend analysis.
  3. Quarterly Report Templates: Ideal for long-term planning, these reports track your social media efforts over three months. They highlight significant trends and overall progress.
  4. Campaign-Specific Report Templates: Focused on individual marketing campaigns, these templates analyze the performance and impact of specific social media initiatives.
  5. Platform-Specific Report Templates: Tailored to individual social media platforms, these reports track each channel’s unique metrics and performance indicators.
  6. Competitor Analysis Report Templates: These templates help you monitor your competitors by comparing your social media performance against theirs. You can identify strengths and opportunities for improvement.
  7. Audience Profiling Report Templates: These templates support comprehensive audience analysis, helping you better understand your followers. They inform your strategy by breaking down audience demographics, behaviors, and preferences effectively.
  8. Content Performance Report Templates: These templates focus on the success of your individual posts and content types. They help you identify what resonates most with your audience and optimize future content.
  9. ROI and Conversion Report Templates: These templates measure your social media efforts’ return on investment and conversions. They provide clear insights into your strategy’s financial impact.
  10. Influencer Marketing Report Templates: Track the effectiveness of your influencer partnerships using a marketing analytics platform, analyzing reach, engagement, and overall influence on your brand’s social media presence.

How to Create the Best Social Media Reporting Template?

Social media reports: where data goes to die of boredom. But not anymore! It’s time to turn those yawn-inducing numbers into scroll-stopping visuals.

Data visualization is the secret sauce of analysis. It transforms dry stats into juicy stories. But Excel? It’s the flip phone of the data world. Functional, sure. Exciting? Not so much.

Enter ChartExpo, the superhero of data viz. It’s here to rescue your reports from Excel’s clutches. Think of it as Excel’s cooler, more popular sibling. ChartExpo doesn’t just show data; it makes it pop, sizzle, and dance.

Ready to make your social media reports Instagram-worthy? Install ChartExpo.

Let’s learn how to install ChartExpo in Excel.

  1. Open your Excel application.
  2. Open the worksheet and click the “Insert” menu.
  3. You’ll see the “My Apps” option.
  4. In the Office Add-ins window, click “Store” and search for ChartExpo on my Apps Store.
  5. Click the “Add” button to install ChartExpo in your Excel.

ChartExpo charts are available both in Google Sheets and Microsoft Excel. Please use the following CTAs to install the tool of your choice and create beautiful visualizations with a few clicks in your favorite tool.

Social Media Report Example

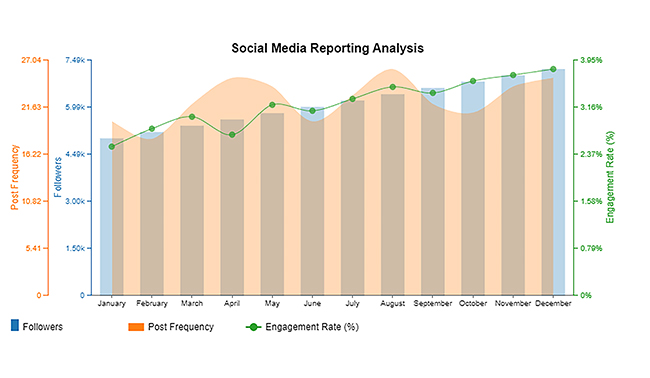
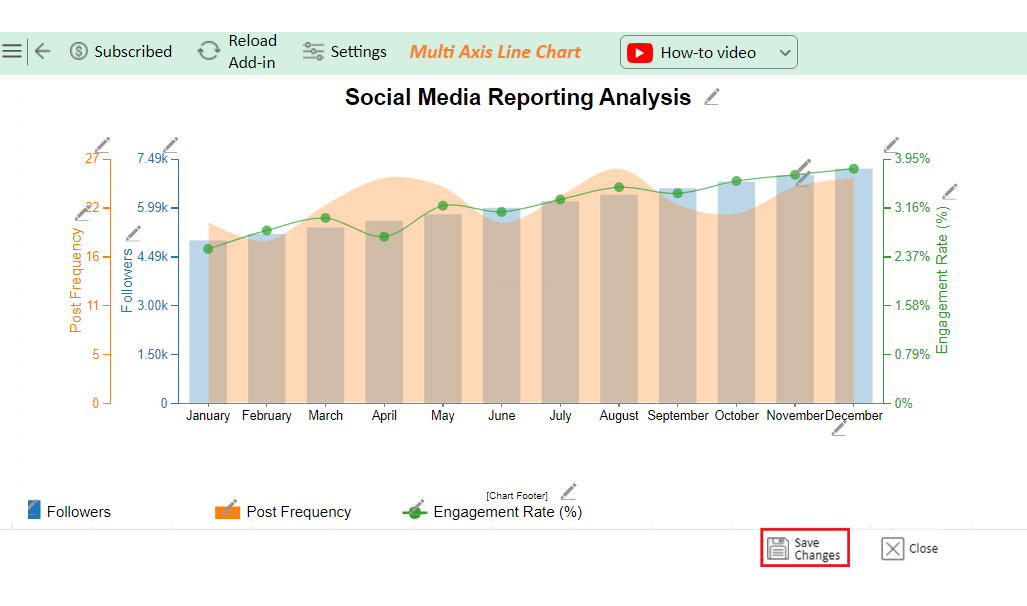
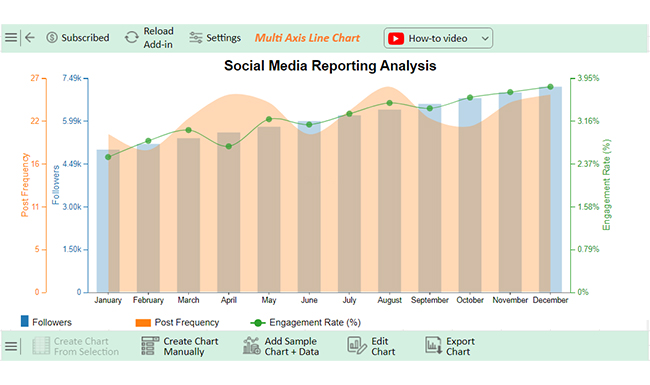
Let’s create a social media report chart using ChartExpo from the data below.

Month Followers Engagement Rate (%) Post Frequency
January 5000 2.5 20
February 5200 2.8 18
March 5400 3 22
April 5600 2.7 25
May 5800 3.2 24
June 6000 3.1 20
July 6200 3.3 23
August 6400 3.5 26
September 6600 3.4 22
October 6800 3.6 21
November 7000 3.7 24
December 7200 3.8 25
  • To get started with ChartExpo, install ChartExpo in Excel.
  • Now Click on My Apps from the INSERT menu.
insert chartexpo in excel
  • Choose ChartExpo from My Apps, then click Insert.
open chartexpo in excel
  • Once it loads, scroll through the charts list to locate and choose the “Multi-Axis Line Chart”.
search multi axis line chart in excel
  • Click the “Create Chart From Selection” button after selecting the data from the sheet.
Click Create Chart From Selection for Making Social Media Reporting Templates
  • ChartExpo will generate the visualization below for you.
Initial Visual After Making Social Media Reporting Templates
  • Click on Settings and change the “Data Representation” as follows.
Change Data Representation After Making Social Media Reporting Templates
  • If you want to add anything to the chart, click the Edit Chart button:
  • Click the pencil icon next to the Chart Header to change the title.
  • It will open the properties dialog. Under the Text section, you can add a heading in Line 1 and enable Show.
  • Give the appropriate title of your chart and click the Apply button.
Add Chart Header After Making Social Media Reporting Templates
  • You can add the sign of (%) with the Engagement Rate value:
Add Postfix in Chart After Making Social Media Reporting Templates
  • You can change the precision value to zero:
Change Precision Value to Zero After Making Social Media Reporting Templates
  • Change the Legend shape of “Followers” to Column and click the “Apply” button.
Change Legend Shape of Followers After Making Social Media Reporting Templates
  • Change the Legend shape of “Engagement Rate” into a Line and Circle and click the “Apply” button.
Change Legend Shape of Engagement Rate After Making Social Media Reporting Templates
  • Click the “Save Changes” button to persist the changes made to the chart.
Click Save Changes After Making Social Media Reporting Templates
  • Your final Multi Axis Line Chart will look like the one below.
Final Social Media Reporting Templates

Insights

  • The follower count grew steadily to 7,200 by December.
  • Engagement rate peaked at 3.8%.
  • Post frequency was varied but consistent, reflecting effective growth and engagement strategies.

Enhance Your Social Media Insights with Expert Social Media Reporting Templates in Excel:

  1. Open your Excel Application.
  2. Install ChartExpo Add-in for Excel from Microsoft AppSource to create interactive visualizations.
  3. Select the Multi-Axis Line Chart from the list of charts.
  4. Select your data.
  5. Click on the “Create Chart from Selection” button.
  6. Customize your chart properties to add header, axis, legends, and other required information.

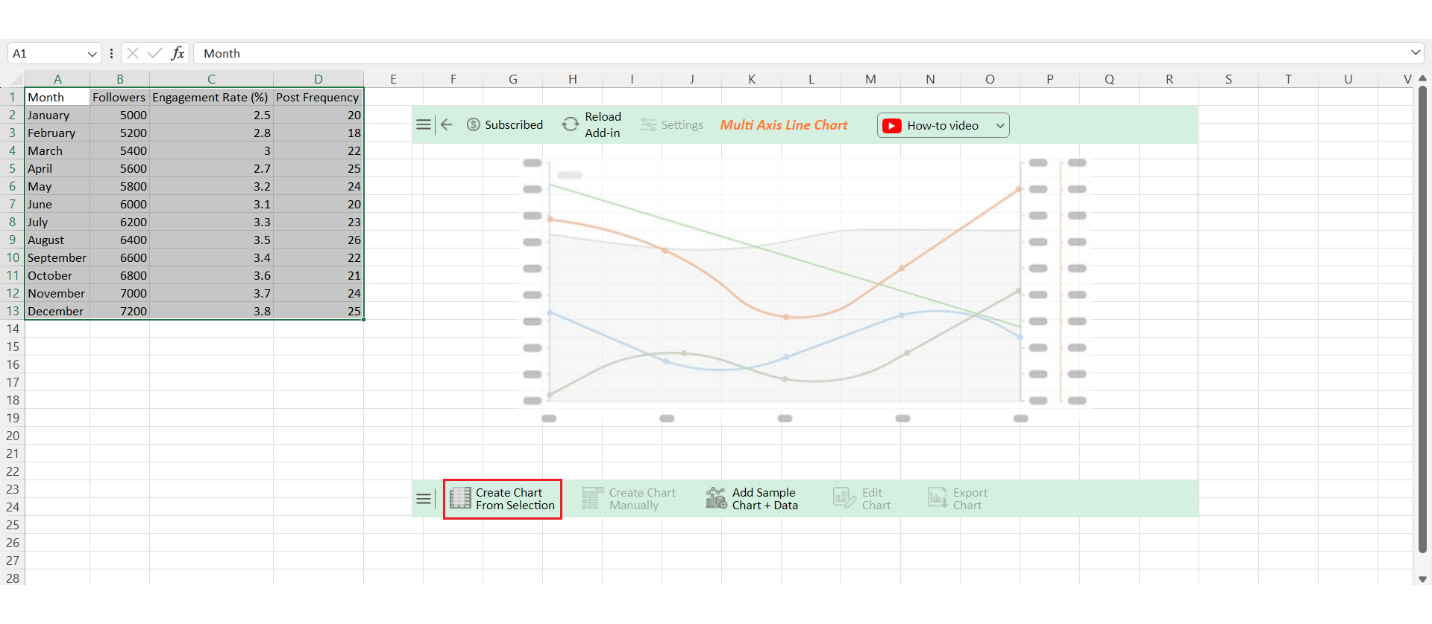
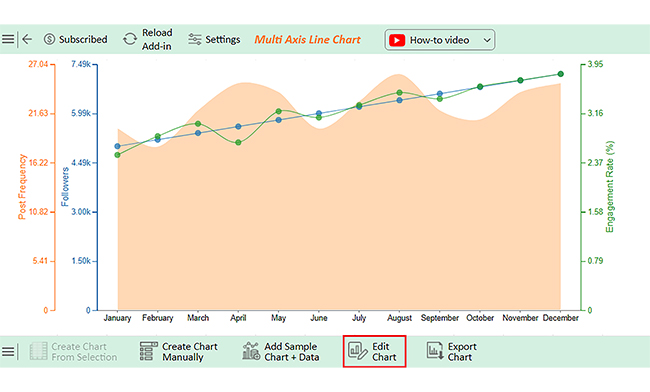
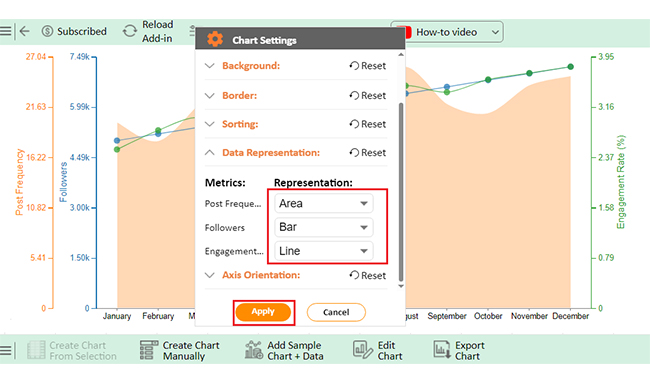
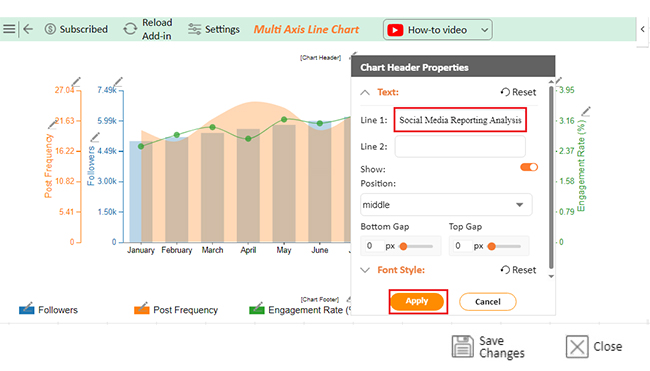
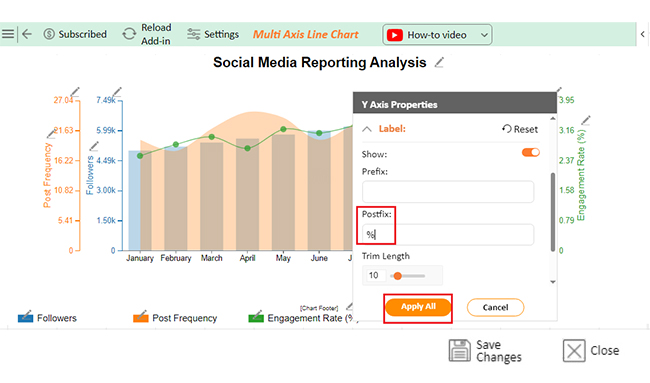
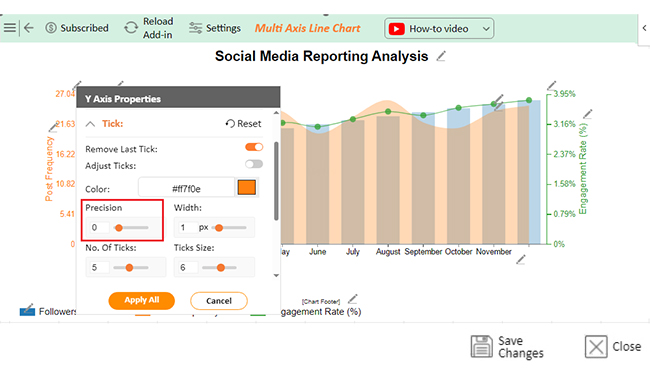
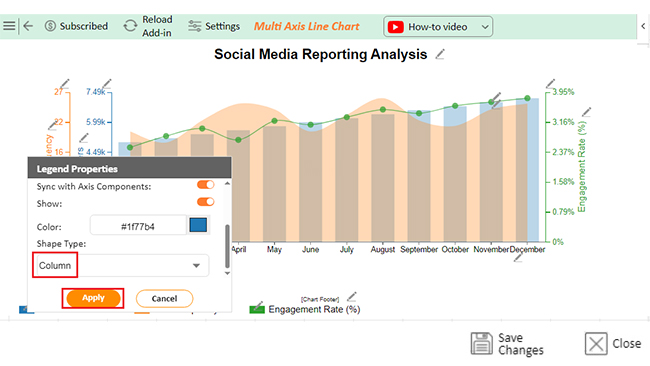
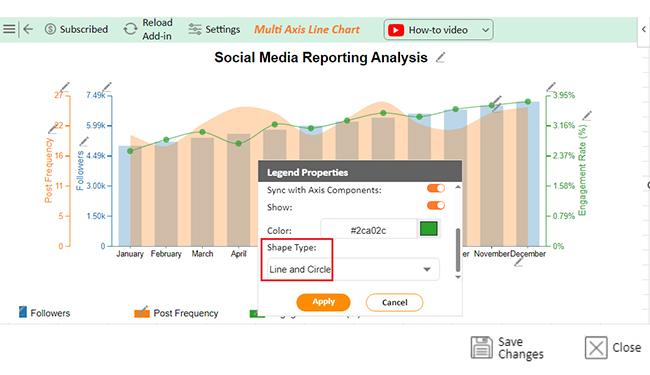
The following video will help you create the Multi-Axis Line Chart in Microsoft Excel.

What are the Best Practices for Building Your Social Media Report Template?

Creating an effective social media report template can streamline your analysis and improve your strategy. Here are the best practices to keep in mind:

  • Define objectives and select KPIs: Start by clearly defining your goals. Choose key performance indicators (KPIs) that align with these objectives to ensure your report focuses on what matters most.
  • Organize layout and incorporate visuals: Structure your report in a logical, easy-to-follow format. Use different types of charts, graphs, and other visuals to make data more digestible and engaging.
  • Include context and schedule regular updates: Provide context for your data by explaining what the numbers mean and offering insights. Schedule regular updates to keep your reports current and relevant.
  • Customize for different audiences and be concise: Tailor your reports to suit the needs of different stakeholders. Keep the information concise and clear to ensure everyone can understand and use it effectively.

FAQs

What KPIs are used in social media reporting?

Key KPIs in social media reporting include:

  • Follower growth
  • Engagement rate
  • Reach
  • Impressions
  • Click-through rate
  • Conversion rate

These metrics track audience growth, interaction quality, content visibility, and strategy effectiveness.

What social media metrics to report?

Track these key social media metrics:

  • Follower growth
  • Interaction rates
  • Audience reach
  • Content impressions
  • Clicks and actions
  • Conversion rates

These reveal how well you build your audience, engage them, and achieve your goals.

Where to get social media templates?

You can find social media templates on:

  • Canva
  • Adobe Spark
  • Crello
  • Piktochart
  • Envato Elements

These platforms offer customizable templates for various social media needs and can streamline your content creation process.

Wrap Up

Social media reporting templates are incredibly useful tools. They help streamline the reporting process by organizing data in a clear format, saving time and effort. This efficiency allows you to focus on analysis rather than data collection.

These templates provide consistency. Each report follows the same structure. This makes it easier to compare performance over time. Consistent reports help identify trends and patterns. Understanding these trends is crucial for strategy adjustments.

Templates also enhance clarity. They present data in an organized manner. Key metrics are highlighted and easy to find. This clarity aids in quick decision-making. Clear reports are essential for communicating with stakeholders.

Visualization is another benefit. Templates often include graphs and charts. Visuals make complex data easier to understand. They help convey your message effectively. Good visuals can highlight successes and areas for improvement.

Customizability is key. Templates can be tailored to fit specific needs. Different audiences require different information. Custom reports ensure everyone gets the data they need. This flexibility makes templates highly valuable.

Do not hesitate.

Start using social media reporting templates with ChartExpo today for better insights and decisions.

How much did you enjoy this article?

ExcelAd2
Start Free Trial!
139851

Related articles

next previous
Microsoft Excel8 min read

Excel Task Tracker Template for Smarter Task Insights

Task tracker template in Excel organizes tasks, tracks deadlines, and boosts efficiency. Learn its benefits, and explore expert tips to simplify task management.

Microsoft Excel10 min read

Invoice Tracker Template in Excel for Better Insights

An invoice tracker Excel template helps track invoices, due dates, and payments. Learn how to use this template for better financial management.

Microsoft Excel12 min read

Key Performance Indicators in Healthcare for Better Insights

Key Performance Indicators in healthcare track patient care and efficiency. Learn about these KPIs, top examples, and how to use them to improve outcomes.

Microsoft Excel10 min read

BMI Calculation Formula in Excel for Better Fitness Insights

The BMI calculation formula in Excel helps track and analyze body mass index. Explore step-by-step instructions and tips to simplify BMI tracking in Excel.

Microsoft Excel29 min read

How to Create a Tornado Chart in Excel? A Complete Guide

Click to learn how to plot a Tornado Chart in Excel using easy-to-follow steps. Also, we’ll address the following question: what is a Tornado Diagram?

ChartExpo logo

Turn Data into Visual
Stories

CHARTEXPO

  • Home
  • Gallery
  • Videos
  • Services
  • Pricing
  • Contact us
  • FAQs
  • Privacy policy
  • Terms of Service
  • Sitemap

TOOLS

  • ChartExpo for Google Sheets
  • ChartExpo for Microsoft Excel
  • Power BI Custom Visuals by ChartExpo
  • Word Cloud

CATEGORIES

  • Bar Charts
  • Circle Graphs
  • Column Charts
  • Combo Charts
  • Comparison Charts
  • Line Graphs
  • PPC Charts
  • Sentiment Analysis Charts
  • Survey Charts

TOP CHARTS

  • Sankey Diagram
  • Likert Scale Chart
  • Comparison Bar Chart
  • Pareto Chart
  • Funnel Chart
  • Gauge Chart
  • Radar Chart
  • Radial Bar Chart
  • Sunburst Chart
  • see more
  • Scatter Plot Chart
  • CSAT Survey Bar Chart
  • CSAT Survey Chart
  • Dot Plot Chart
  • Double Bar Graph
  • Matrix Chart
  • Multi Axis Line Chart
  • Overlapping Bar Chart
  • Control Chart
  • Slope Chart
  • Clustered Bar Chart
  • Clustered Column Chart
  • Box and Whisker Plot
  • Tornado Chart
  • Waterfall Chart
  • Word Cloud
  • see less

RESOURCES

  • Blog
  • Resources
  • YouTube
SIGN UP FOR UPDATES

We wouldn't dream of spamming you or selling your info.

© 2025 ChartExpo, all rights reserved.