• Home
  • Tools dropdown img
    • Spreadsheet Charts

      • ChartExpo for Google Sheets
      • ChartExpo for Microsoft Excel
    • Power BI Charts

      • Power BI Custom Visuals by ChartExpo
    • Word Cloud

  • Charts dropdown img
    • Chart Category

      • Bar Charts
      • Circle Graphs
      • Column Charts
      • Combo Charts
      • Comparison Charts
      • Line Graphs
      • PPC Charts
      • Sentiment Analysis Charts
      • Survey Charts
    • Chart Type

      • Box and Whisker Plot
      • Clustered Bar Chart
      • Clustered Column Chart
      • Comparison Bar Chart
      • Control Chart
      • CSAT Survey Bar Chart
      • CSAT Survey Chart
      • Dot Plot Chart
      • Double Bar Graph
      • Funnel Chart
      • Gauge Chart
      • Likert Scale Chart
      • Matrix Chart
      • Multi Axis Line Chart
      • Overlapping Bar Chart
      • Pareto Chart
      • Radar Chart
      • Radial Bar Chart
      • Sankey Diagram
      • Scatter Plot Chart
      • Slope Chart
      • Sunburst Chart
      • Tornado Chart
      • Waterfall Chart
      • Word Cloud
    • Google Sheets
      Microsoft Excel
  • Services
  • Pricing
  • Contact us
  • Blog
  • Support dropdown img
      • Gallery
      • Videos
      • Contact us
      • FAQs
      • Resources
    • Please feel free to contact us

      atsupport@chartexpo.com

Categories
All Data Visualizations Data Analytics Surveys
Add-ons/
  • Google Sheets
  • Microsoft Excel
  • Power BI
All Data Visualizations Data Analytics Surveys
Add-ons
  • Google Sheets
  • Microsoft Excel
  • Power BI

We use cookies

This website uses cookies to provide better user experience and user's session management.
By continuing visiting this website you consent the use of these cookies.

Ok

ChartExpo Survey


Home > Blog > Data Analytics

Marketing Spend Template for Smarter Insights

The Marketing Spend Template helps business owners allocate, track, and optimize their marketing budget efficiently. It offers a structured approach to measure ROI, monitor expenses, and make data-driven decisions. This enables better campaign performance and cost management.

Marketing Spend Template

In this guide, you’ll discover what a Marketing Spend Template is, why you need a Marketing Budget Template, and when to use a Marketing Budget Template.

This guide shows you how to use Power BI and also serves as a data visualization guide. As an analyst, this guide will show you various data visualization tools and how Power BI data visualization works.

Furthermore, you’ll discover who uses a Marketing Budget Template, top Marketing Budget Templates examples, and what to include in a Marketing Budget Worksheet.

Table of Contents:

  1. What is a Marketing Spend Template?
  2. Why do you need a Marketing Budget Template?
  3. When to Use a Marketing Budget Template?
  4. Who Uses a Marketing Budget Template?
  5. What to Include in a Marketing Budget Worksheet?
  6. How to Create a Marketing Budget Plan?
  7. How to Analyze Marketing Budget Sheets in Power BI?
  8. Pros and Cons of the Marketing Budget Format
  9. Tips for Using the Annual Marketing Budget Template
  10. FAQs
  11. Wrap Up

What is a Marketing Spend Template?

Definition: A Marketing Spend Template is a structured tool used for tracking, allocating, and managing marketing budgets. It helps business owners monitor expenses and compare actual spending against planned budgets. It also plays a role in measuring the return on investment (ROI) of marketing campaigns.

Why do you need a Marketing Budget Template?

  • Efficient Budget Allocation: It helps in distributing funds across different marketing channels like content marketing, events, SEO, and digital ads.
  • Performance Measurement and ROI Analysis: It helps in tracking the effectiveness of marketing campaigns. This is done by comparing spending with generated revenue. This way, the business owner will be able to make data-driven adjustments to optimize future campaigns.
  • Expense Tracking and Control: It monitors actual spending versus planned budgets to avoid overspending. The marketing budget template also identifies cost-saving opportunities and prevents financial inefficiencies.
  • Strategic Planning and Forecasting: It helps businesses use historical data and market trends to plan future budgets. This ensures long-term financial stability and growth.

When to Use a Marketing Budget Template?

  • At the start of a Financial Year or Quarter: This helps set a structured budget for planned marketing activities. It also ensures funds are allocated across different campaigns.
  • Launching a New Marketing Campaign: It enables you to track expenses for content marketing, promotions, events, and digital ads. It also plays a role in optimizing spending. That’s done by monitoring costs against expected returns.
  • When evaluating ROI and Performance: It Plays a role in measuring actual spending against campaign performance. This will, in turn, help you identify high-ROI activities and areas that need budget adjustments.
  • During Financial Planning and Forecasting: It assists in preparing accurate financial reports and provides historical data for a more robust future budget planning.

Who Uses a Marketing Budget Template?

  • Marketing Managers and Directors: It comes in handy when planning, allocating, and overseeing marketing budgets. It also ensures spending aligns with business goals and delivers maximum ROI.
  • Business Owners and Executives: Assess marketing investments and their impact on business growth. It also helps in making strategic financial decisions based on budget reports.
  • Marketing Analysts and Strategists: They play a major role in analyzing cost-performance ratios and tracking spend effectiveness. Furthermore, it plays a role in optimizing budget distribution across different marketing channels.
  • Finance and Accounting Teams: A marketing budget template is used to monitor the overall marketing expenditures. It also ensures financial accountability and budget compliance.

What to Include in a Marketing Budget Worksheet?

  • Marketing Channels: You have to break down spending by digital marketing (PPC, SEO, social media), events, and traditional advertising (TV, print, radio).
  • Planned vs. Actual Budget: To track overspending (or savings) and compare estimated costs with real expenditures.
  • Advertising and Promotions: You have to include costs for influencer partnerships, sponsorships, and paid ads.
  • Software and Tools: Track expenses for marketing automation, analytics tools, and CRM.

How to Create a Marketing Budget Plan?

  • Define Business Goals: Align the budget with marketing objectives like lead generation, sales growth, or brand awareness.
  • Identify Marketing Channels: You have to select the right mix of digital (social media, PPC, SEO) and traditional (events, print, TV) marketing.
  • Estimate Costs: Allocate funds for content creation, tools, advertising, and personnel based on industry benchmarks and past data.
  • Set Budget Allocation: You should prioritize high-ROI activities and distribute the budget accordingly.
  • Measure ROI and Optimize: Always evaluate campaign effectiveness and refine future budget plans.

How to Analyze Marketing Budget Sheets in Power BI?

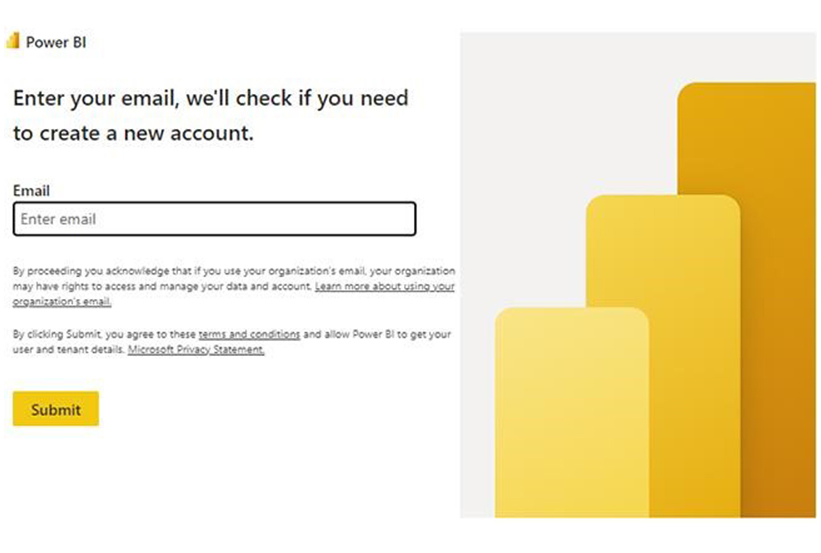
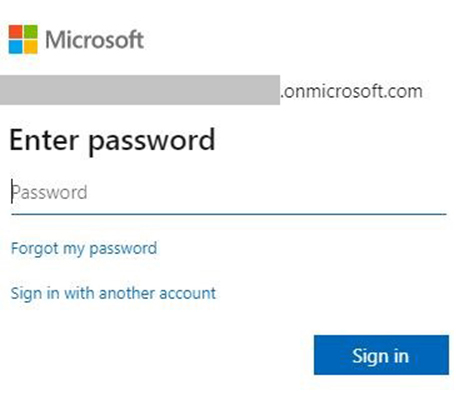
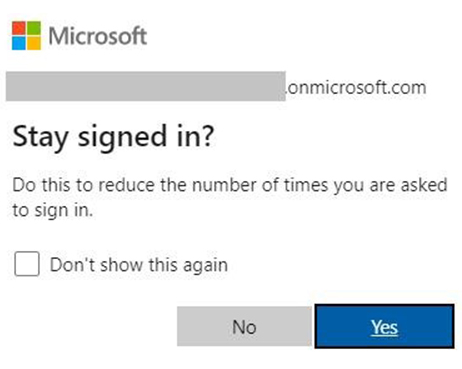
Whether you’re using Power BI in Office 365 or the Power BI report builder, this section will show you how to use them to analyze marketing budget sheets. You’ll also discover some Power BI design ideas, and how the Power BI dashboard vs report works.

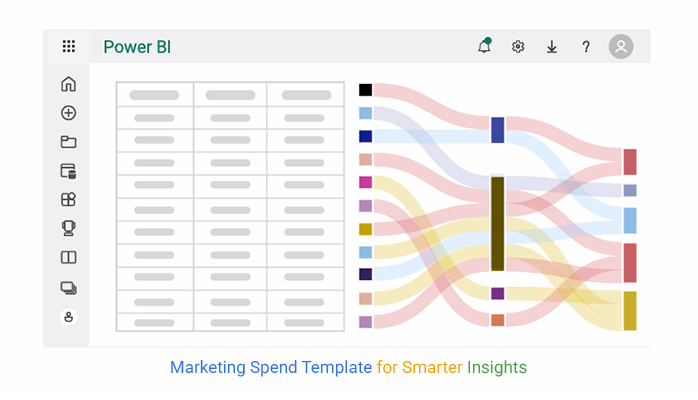
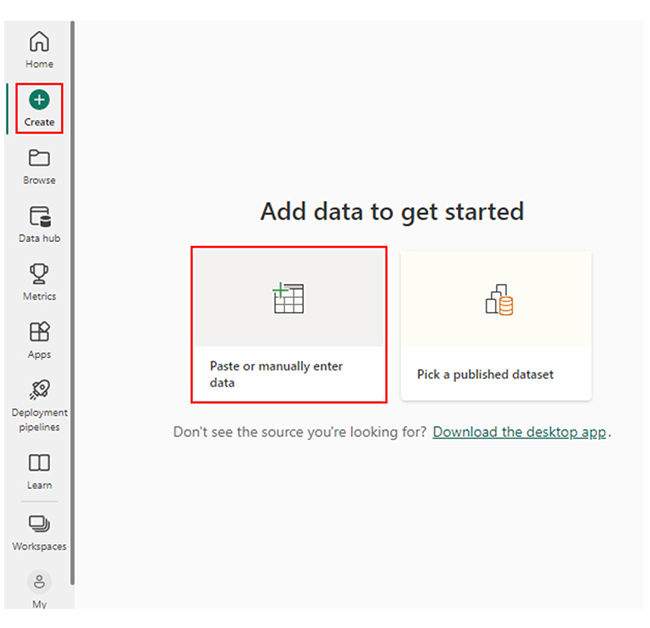
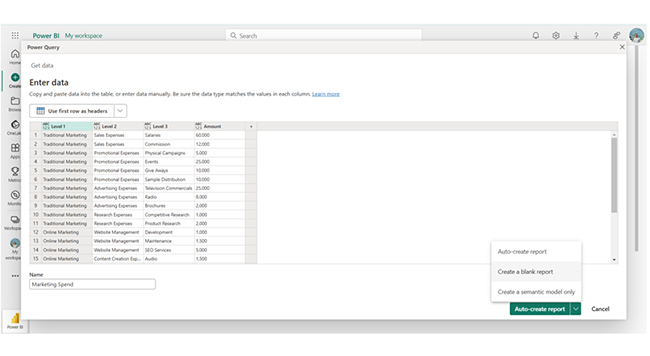
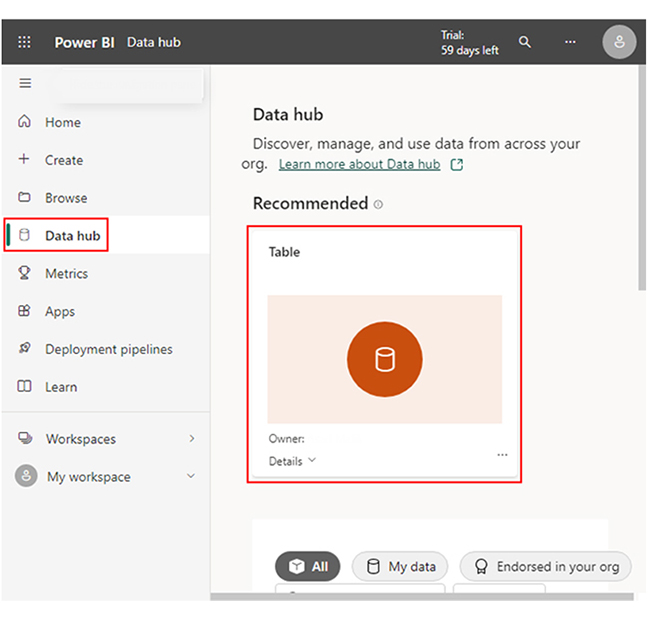
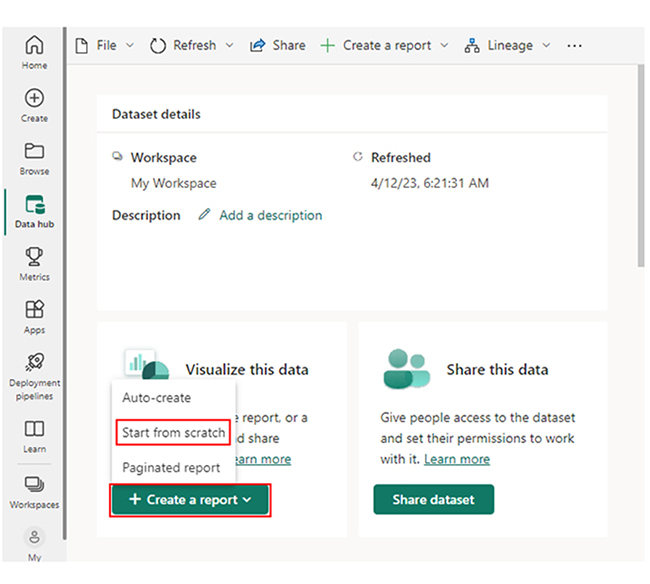
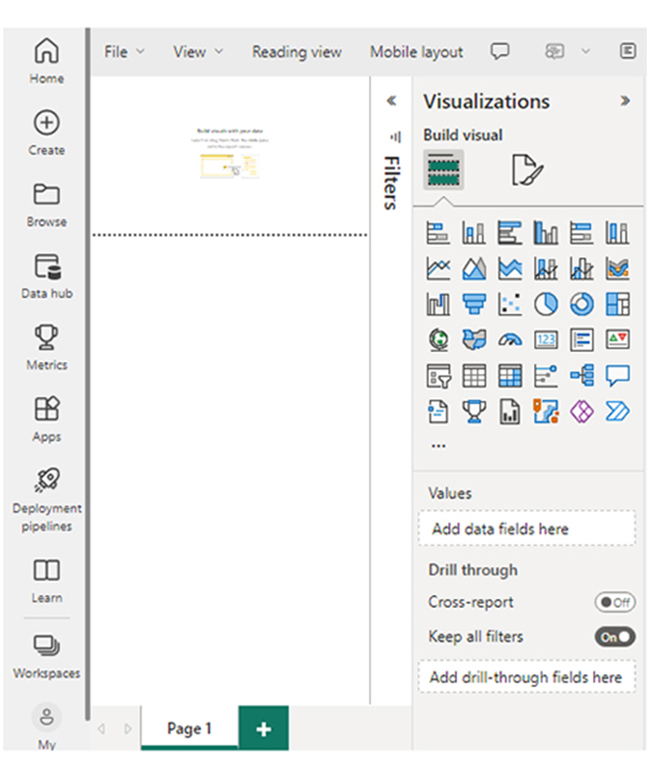
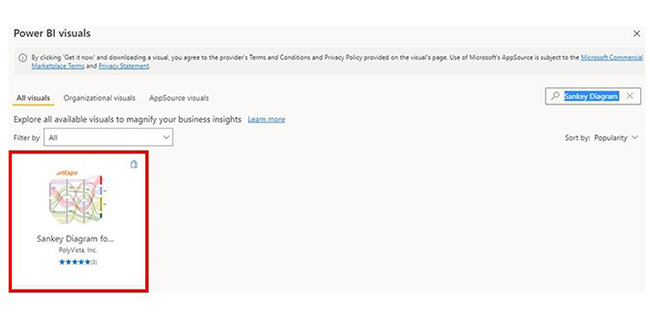
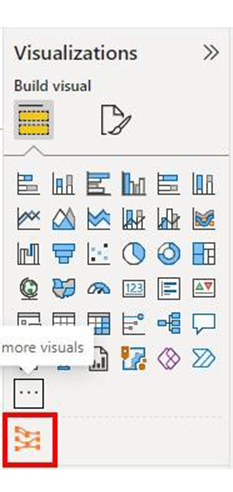
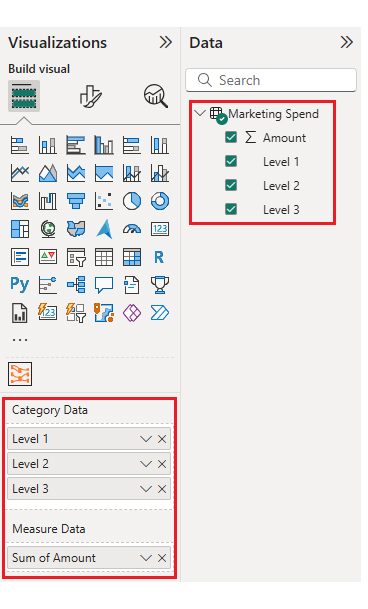
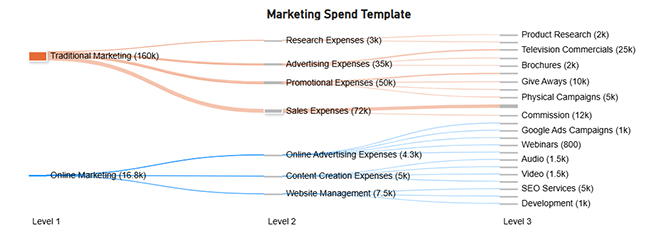
Here are the various stages that will help you analyze the marketing budget sheet in Power BI.

  • Stage 1: Log into Power BI, enter your email, and click the “Submit” button.
Marketing Spend Template
  • You’ll be redirected to a Microsoft account. Enter your password, and click “Sign in.”
Marketing Spend Template
  • You can opt to stay signed in.
Marketing Spend Template
  • Stage 2: Create a Data Set and Select the Data Set to Use in the Sankey Chart
  • Navigate to the left-side menu, and click on the “Create” option. After that, select “Paste or manually enter data.”
Marketing Spend Template
  • Paste the online store data table into the “Power Query” window. You’ll have to select the “Create a blank report” option.
Marketing Spend Template
  • Navigate to the left-side menu, and click on the “Data Hub” option. Power BI will populate the data set list. If no data set has been created, you’ll get an error message.
Marketing Spend Template
  • Choose a data set for the Sankey chart. Power BI will populate the screen as shown below.
Marketing Spend Template
  • Click on the “Create a report” dropdown, and select “Start from scratch.”
Marketing Spend Template
  • The report canvas screen appears.
Marketing Spend Template
  • Stage 3: Adding the Power BI Sankey Diagram Extension by ChartExpo
  • To create the Sankey Diagram, you’ll have to use an add-in or Power BI visual from AppSource. Navigate to the right side of the Power BI dashboard and open the Power BI visualizations panel. Click the ellipsis symbol (…) to import the Power BI Sankey Diagram extension by ChartExpo.
Marketing Spend Template
  • In the following menu that opens, select the “Get more visuals” option.
Marketing Spend Template
  • Enter “Sankey Diagram for Power BI by ChartExpo” in the highlighted search box. You’ll see the “Sankey Diagram for Power BI by ChartExpo.”
Marketing Spend Template
  • Click the highlighted “Add” button.
Marketing Spend Template
  • Power BI will add the “Sankey Diagram for Power BI by ChartExpo” icon in the visualization panel.
Marketing Spend Template
  • Stage 4: Drawing the Sankey Diagram with ChartExpo’s Power BI extension
  • You’ll have to select the “Sankey Diagram for Power BI by ChartExpo” icon in the visualization panel. After that, a window similar to the image below opens in the report section of your dashboard.
Marketing Spend Template
  • You can resize the visual. To do that, navigate to the right side of the Power BI dashboard. You’ll see “Fields” next to “Visualizations.” Select the fields to use in the Sankey chart.
  • You’ll have to select the ChartExpo visual. Use the following sequence to select the fields:
    • Level 1
    • Level 2
    • Level 3
    • Amount
  • You’ll have to provide your email address or a ChartExpo license key.
Marketing Spend Template
  • Stage 5: Activate the ChartExpo Trial or Apply a Subscription Key
  • Select the ChartExpo visual. You’ll see three icons below “Build Visual” in the Visualizations panel.
Marketing Spend Template
  • You’ll have to select the middle icon, “Format visual.” The visual properties will be populated.
Marketing Spend Template
  • To begin using ChartExpo as a new user, enter your email address in the textbox under the “Trial Mode” section. Toggle “Enable Trial” to activate the 7-day trial.
Marketing Spend Template
  • The Sankey Diagram created under the 7-day trial comes with the ChartExpo watermark.
  • If you have a license key, enter it in the “ChartExpo License Key” textbox in the “License Settings” section. After that, slide the toggle switch next to “Enable License” to “On.”
Marketing Spend Template
  • The Sankey Diagram will appear without a watermark.
Marketing Spend Template
  • You can add the header text on top of the chart.
Marketing Spend Template
  • To add colors to each node, expand the “Level Colors” properties and select the colors.
Marketing Spend Template
  • There’s the option to disable the percentage sign and add the dollar sign.
Marketing Spend Template
  • Here’s the final Sankey Chart.
Marketing Spend Template

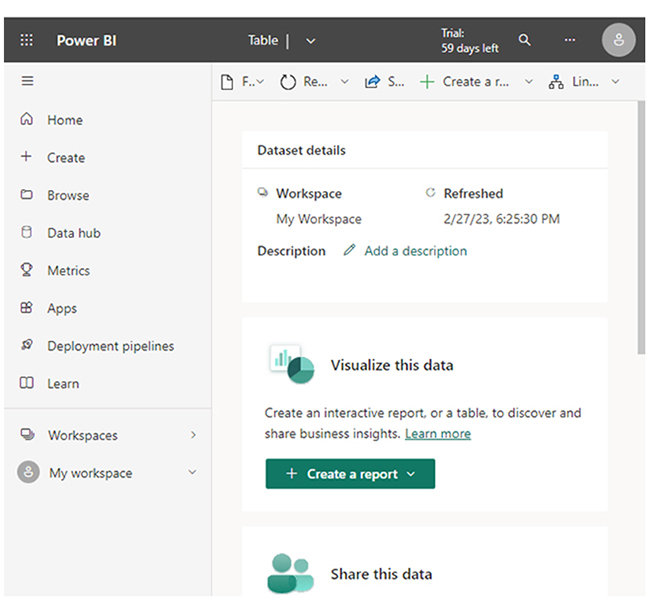
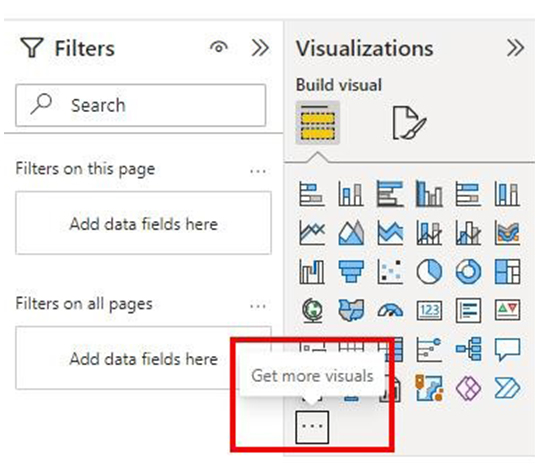
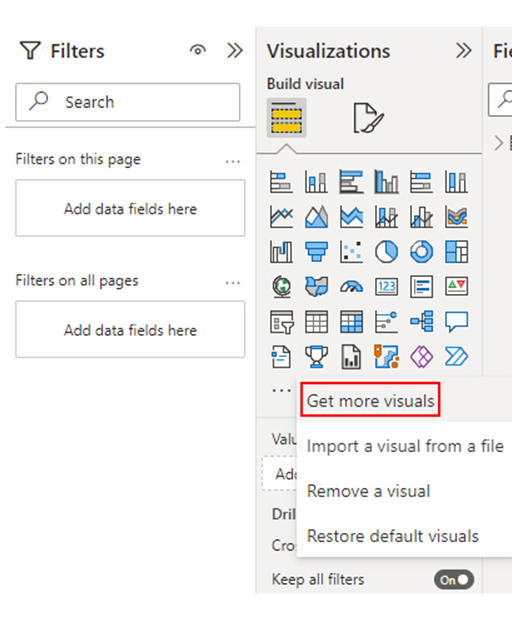
Whether you’re using the Sankey Diagram in Power BI to represent the Power BI dataset or you opt for other visualization options, the stages above will help you showcase and interpret your data.

There are cases where you’ll use advanced features like the Power BI Connectors.

Insights

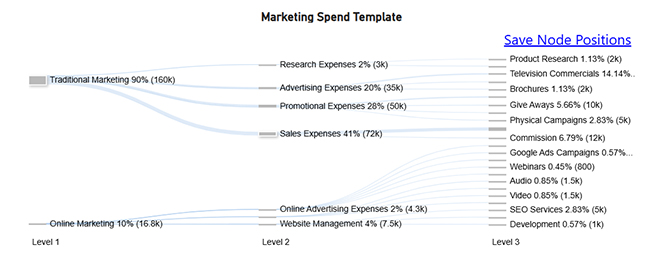
Traditional marketing dominates expenses, with promotions ($50K) and salaries ($60K) as major costs. Advertising ($35K) focuses on radio and TV. Online marketing ($16.8K) emphasizes content, SEO, and ads, with web management ($7.5K) as a key investment. Digital spend is significantly lower.

Pros and Cons of the Marketing Budget Format

Pros:

  • Financial Control: It tracks and manages marketing expenses.
  • Transparency and Accountability: Supports data-driven adjustments for optimization.
  • Performance Measurement: It enables comparison of planned vs. actual spending.
  • Better Resource Allocation: It ensures funds are spent on high-ROI activities.

Cons:

  • Limited Flexibility: It may restrict spontaneous marketing opportunities
  • Overgeneralization Risk: The rigid format may not be a good fit for business needs.
  • Data Dependency: The accuracy depends on reliable financial and performance data.

Tips for Using the Annual Marketing Budget Template

  • Set Clear Marketing Goals: You have to align the budget with business objectives like lead generation, sales growth, or brand awareness.
  • Break Down Expenses by Category: Allocate funds for digital marketing, events, content creation, advertising, and tools.
  • Adjust for Seasonal Changes: You should allocate higher budgets for peak seasons and promotions.
  • Track ROI for Each Channel: Focus spending on the most effective marketing channels.

FAQs

How to make a marketing budget Spreadsheet?

To create a marketing budget spreadsheet, outline expense categories (content, advertising, tools), set planned vs. actual costs, and track ROI. Use formulas for calculations, and perform regular updates for accurate financial management.

What should marketing spend be?

Marketing spending should range from 5% — 10% of total revenue for established businesses. It’s 10% — 20% for startups looking for rapid growth and brand awareness.

What is the 70/20/10 rule for a marketing budget?

The 70/20/10 rule for marketing budget allocates 70% to proven strategies, 20% to new but promising strategies, and 10% to innovative marketing efforts.

Wrap Up

A Marketing Spend Template helps businesses track and manage marketing expenses. It plays a great role when allocating resources, measuring ROI, and controlling costs. The Marketing Spend Template ensures data-driven decision-making for better campaign effectiveness and financial planning.

To get the most out of the marketing budget template, you’ll have to set clear marketing goals and break down expenses by category. You have to align the budget with business objectives like lead generation, sales growth, or brand awareness.

You should also allocate funds for digital marketing, events, tools, content creation, and advertising.

Now you know how to create a marketing spend template, what things will you consider when creating yours?

How much did you enjoy this article?

PBIAd1
Start Free Trial!
151007

Related articles

next previous
Data Analytics12 min read

Business Intelligence in Healthcare Industry: A Visual Approach

Business Intelligence in the healthcare industry improves patient care and streamlines operations. Learn how BI works and benefits healthcare providers.

Data Analytics10 min read

Analytics in Telecom Industry for Better Insights

Analytics in the telecom industry optimizes networks, enhances customer experience, and detect fraud. Learn its key benefits, challenges, and use cases.

Data Analytics7 min read

Financial Forecasting for Startups: A Complete Guide

This guide dives deep into financial forecasting for startups. You'll also discover elements of a financial projection for a startup, and tips for creating one.

Data Analytics32 min read

Data Reporting: Making Your Reports Irresistible

Data reporting turns numbers into insights that guide decisions. Learn how to simplify complex data and make confident choices. Read on for key strategies!

Data Analytics10 min read

Employee Performance KPIs: Insights That Drive Action

Employee performance KPIs track productivity and success. Learn the key metrics, measurement methods, and analysis techniques to boost performance.

ChartExpo logo

Turn Data into Visual
Stories

CHARTEXPO

  • Home
  • Gallery
  • Videos
  • Services
  • Pricing
  • Contact us
  • FAQs
  • Privacy policy
  • Terms of Service
  • Sitemap

TOOLS

  • ChartExpo for Google Sheets
  • ChartExpo for Microsoft Excel
  • Power BI Custom Visuals by ChartExpo
  • Word Cloud

CATEGORIES

  • Bar Charts
  • Circle Graphs
  • Column Charts
  • Combo Charts
  • Comparison Charts
  • Line Graphs
  • PPC Charts
  • Sentiment Analysis Charts
  • Survey Charts

TOP CHARTS

  • Sankey Diagram
  • Likert Scale Chart
  • Comparison Bar Chart
  • Pareto Chart
  • Funnel Chart
  • Gauge Chart
  • Radar Chart
  • Radial Bar Chart
  • Sunburst Chart
  • see more
  • Scatter Plot Chart
  • CSAT Survey Bar Chart
  • CSAT Survey Chart
  • Dot Plot Chart
  • Double Bar Graph
  • Matrix Chart
  • Multi Axis Line Chart
  • Overlapping Bar Chart
  • Control Chart
  • Slope Chart
  • Clustered Bar Chart
  • Clustered Column Chart
  • Box and Whisker Plot
  • Tornado Chart
  • Waterfall Chart
  • Word Cloud
  • see less

RESOURCES

  • Blog
  • Resources
  • YouTube
SIGN UP FOR UPDATES

We wouldn't dream of spamming you or selling your info.

© 2025 ChartExpo, all rights reserved.