• Home
  • Tools dropdown img
    • Spreadsheet Charts

      • ChartExpo for Google Sheets
      • ChartExpo for Microsoft Excel
    • Power BI Charts

      • Power BI Custom Visuals by ChartExpo
    • Word Cloud

  • Charts dropdown img
    • Chart Category

      • Bar Charts
      • Circle Graphs
      • Column Charts
      • Combo Charts
      • Comparison Charts
      • Line Graphs
      • PPC Charts
      • Sentiment Analysis Charts
      • Survey Charts
    • Chart Type

      • Box and Whisker Plot
      • Clustered Bar Chart
      • Clustered Column Chart
      • Comparison Bar Chart
      • Control Chart
      • CSAT Survey Bar Chart
      • CSAT Survey Chart
      • Dot Plot Chart
      • Double Bar Graph
      • Funnel Chart
      • Gauge Chart
      • Likert Scale Chart
      • Matrix Chart
      • Multi Axis Line Chart
      • Overlapping Bar Chart
      • Pareto Chart
      • Radar Chart
      • Radial Bar Chart
      • Sankey Diagram
      • Scatter Plot Chart
      • Slope Chart
      • Sunburst Chart
      • Tornado Chart
      • Waterfall Chart
      • Word Cloud
    • Google Sheets
      Microsoft Excel
  • Services
  • Pricing
  • Contact us
  • Blog
  • Support dropdown img
      • Gallery
      • Videos
      • Contact us
      • FAQs
      • Resources
    • Please feel free to contact us

      atsupport@chartexpo.com

Categories
All Data Visualizations Data Analytics Surveys
Add-ons/
  • Google Sheets
  • Microsoft Excel
  • Power BI
All Data Visualizations Data Analytics Surveys
Add-ons
  • Google Sheets
  • Microsoft Excel
  • Power BI

We use cookies

This website uses cookies to provide better user experience and user's session management.
By continuing visiting this website you consent the use of these cookies.

Ok

ChartExpo Survey


Home > Blog > Microsoft Excel

Project Tracker Template in Excel to Enhance Productivity

What is a project tracker template in Excel? It’s a tool that helps you manage projects efficiently. Keeping everything organized can be challenging with deadlines, budgets, and multiple tasks. That’s where this template makes a difference.

Project management is critical for business success. Studies show that organizations waste 11.4% of their resources due to poor project performance. A project tracker template in Excel ensures you stay on track. It keeps tasks, timelines, and responsibilities clear and accessible. Moreover, it offers the flexibility to eliminate duplicates in Excel, ensuring data accuracy and consistency.

Project Tracker Template in Excel

This template simplifies planning and monitoring. You can list tasks, assign team members, and set due dates—all in one place. This adaptability extends to creating financial models in Excel, making it a versatile tool for broader business needs.

Using a project tracker template in Excel promotes accountability. Everyone knows their role, which reduces delays and misunderstandings. It also provides a visual overview of progress. A dynamic graph Excel feature can further enhance your ability to track milestones and make real-time adjustments.

In today’s dynamic work environment, staying organized is essential. Excel project management templates provide an affordable solution to simplify your workflow. They help save time, enhance productivity, and keep you aligned with objectives.

This blog post shows you how these templates are reliable tools for achieving success.

Table of Contents:

  1. What is a Project Tracker Template in Excel?
  2. Why Use Excel for Tracking Projects?
  3. How Do I Create a Project Tracker in Excel?
  4. How to Use Project Tracker Template in Excel?
  5. How to Download Project Tracker Template for Excel?
  6. How to Analyze Project Tracking Spreadsheets?
  7. What are the Advantages and Disadvantages of Excel for Multiple Project Tracker Templates?
  8. Wrap Up

But before we get there. Let’s first understand the basics…

What is a Project Tracker Template in Excel?

Definition: An Excel project tracker template is a versatile tool for managing tasks and timelines. It helps organize projects by tracking progress, deadlines, and responsibilities. This template allows you to assign tasks, set priorities, and monitor milestones.

Excel’s flexibility, which also applies to tools like an income statement template in Excel, enables easy customization to suit different needs. It promotes accountability and ensures team members stay aligned. Ideal for businesses, teams, or individuals, this tool enhances efficiency, helping you stay organized and meet goals effectively.

Why Use Excel for Tracking Projects?

Effectively tracking projects is key to achieving success. A project-tracking spreadsheet in Excel provides a practical and efficient solution for managing tasks, timelines, and resources. Its flexibility and functionality make it a top choice for businesses and individuals.

Here’s why it’s an ideal tool for project management:

  • Customizable templates: Excel allows you to create or modify templates to fit your needs. It quickly adapts to suit your needs – when managing a simple task list or a complex project.
  • Ease of use: Excel is user-friendly and accessible. This makes it perfect for business analytics without a steep learning curve.
  • Comprehensive data analysis: Excel excels at organizing and analyzing data. Its powerful formulas and charts provide clear insights from progress tracking to budgeting.
  • Collaboration and sharing: Excel supports cloud-based sharing, ensuring everyone stays aligned in real-time. Its flexibility also enhances information design. It allows you to present updates in a clear, structured, and visually engaging way for better understanding.
  • Cost-effectiveness: Excel is affordable compared to specialized project management tools. It’s ideal for small businesses or individuals on a budget.
  • Integration capabilities: Excel integrates with various tools and platforms. It ensures smooth workflows and streamlined data sharing.

How Do I Create a Project Tracker in Excel?

Creating a project tracker in Excel is easy and powerful. For better results; use data visualization tools to turn raw data into clear insights. Follow these steps to build a customized tracker that fits your needs:

  1. Enable the Developer Mode in Excel. It allows you to add interactive features.
Enable Developer Mode in Excel for Making Project Tracker Template in Excel
  1. You can now select the checkbox from the Developer tab as shown below:
Select Checkbox from Developer Tab for Making Project Tracker Template in Excel
  1. Add a check box under the “At Risk” cell. Use the Developer tab to insert checkboxes where needed.
Use Developer Tab to Insert Checkboxes for Making Project Tracker Template in Excel
  1. Next, create all the columns you’ll need for your project. Include fields like Task Name, Assigned To, Deadline, Status, and Progress.
Create All Columns Need for Your Project for Making Project Tracker Template in Excel
  1. Add headings at the top of your columns for clarity and organization. Ensure each heading reflects a key part of your project.
Add Headings at Top of Your Columns for Making Project Tracker Template in Excel
  1. Use Excel’s formatting tools to give your sheet a polished look. Add borders around your data for better readability.
Use Excel Formatting Tools to Give Sheet for Making Project Tracker Template in Excel
  1. Fill in the details of your project to complete your tracker.
Fill in Details of Your Project for Making Project Tracker Template in Excel

How to Use Project Tracker Template in Excel?

Want to manage your projects like an expert? Excel’s project tracker template is your secret weapon and here’s how to use it effectively:

  1. Start with the right template: Download a pre-designed template or build your own. Ensure it aligns with your project’s scope and goals for a strong foundation.
  2. Add project details: Enter tasks, deadlines, team members, and milestones. A clear structure ensures no detail is missed.
  3. Track progress visually: Use conditional formatting to highlight deadlines and progress. This enhances data mining, helping you extract insights from your project data.
  4. Collaborate and share updates: Share the tracker with your team. Real-time collaboration keeps everyone aligned and ensures seamless updates.
  5. Review and adjust regularly: Monitor your tracker, adapt plans as needed, and address roadblocks. Continuous improvement keeps your project on course.

How to Download Project Tracker Template for Excel?

Do you feel like your projects are running you? A project tracker template in Excel can help. With statistical graphs, you’ll gain better insights and stay organized. Follow these simple steps:

    1. Search online for templates: Google “Project Tracker Template for Excel”. Tons of options will appear; from basic to feature-packed. Pick one that fits your style.
    2. Choose a template: Browse through the previews. Do you want something colorful? Minimalist? Packed with automation? Choose the one that speaks to you.
    3. Download the template: Click that download button! Most templates are free or super affordable. Save it to your computer where you can easily find it later.
  1. Open in Excel: Double-click the file to open it in Excel. Boom—your tracker is ready to go.
  2. Save and share: Personalize it, save it, and share it with your team (or just keep it for yourself). Collaboration has never been easier.

How to Analyze Project Tracking Spreadsheets?

Managing projects without a clear plan is like sailing without a compass. Enter the project tracker template in Excel—a trusty tool to organize tasks, deadlines, and progress. It helps with organization and supports data interpretation, turning raw numbers into meaningful insights for better decision-making.

Excel has limitations in advanced data analytics and visualization. Transforming raw data into actionable insights can feel clunky and constrained. That’s where ChartExpo steps in. This powerful add-on converts your Excel sheets into insightful, easy-to-understand visuals, helping you see the big picture.

Are you ready to level up your project tracking? Install ChartExpo!

5 Best Excel Project Management Templates

Sankey Chart

Sankey Chart After Making Project Tracker Template in Excel

Progress Chart

Progress Chart After Making Project Tracker Template in Excel

Multi-Axis Spider Chart

Multi Axis Spider Chart After Making Project Tracker Template in Excel

Waterfall Chart

Waterfall Chart After Making Project Tracker Template in Excel

Progress Circle Chart

Progress Circle Chart After Making Project Tracker Template in Excel

Let’s learn how to install ChartExpo in Excel.

  1. Open your Excel application.
  2. Open the worksheet and click the “Insert” menu.
  3. You’ll see the “My Apps” option.
  4. In the Office Add-ins window, click “Store” and search for ChartExpo on my Apps Store.
  5. Click the “Add” button to install ChartExpo in your Excel.

ChartExpo charts are available both in Google Sheets and Microsoft Excel. Please use the following CTAs to install the tool of your choice and create beautiful visualizations with a few clicks in your favorite tool.

Example

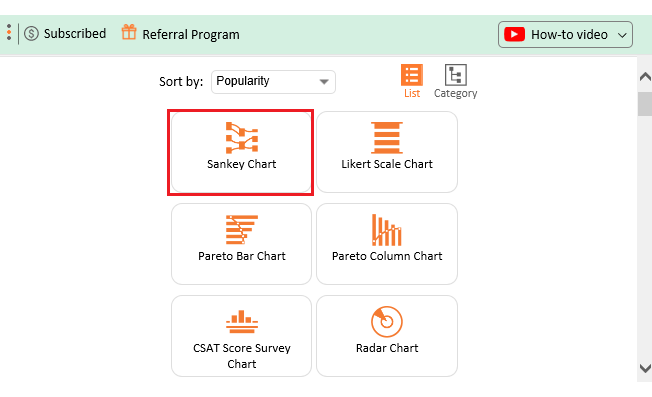
Let’s visualize the sample data below in Excel using ChartExpo and glean valuable insights. How to select data for a chart in Excel will become easier than ever.

Phases Tasks Status Assigned To % Complete
Phase 1 Task 1 Completed Terry 100
Phase 1 Task 2 Completed Bruk 100
Phase 1 Task 3 Completed Terry 100
Phase 2 Task 4 Pending Review Peter 100
Phase 2 Task 5 In Progress Harry 90
Phase 3 Task 6 On Hold Peter 25
Phase 3 Task 7 Approved Terry 5
Phase 3 Task 8 In Progress Peter 10
Phase 3 Task 9 Completed Bruk 100
Phase 3 Task 10 Delayed Harry 15
  • To get started with ChartExpo, install ChartExpo in Excel.
  • Now Click on My Apps from the INSERT menu.
insert chartexpo in excel
  • Choose ChartExpo from My Apps, then click Insert.
open chartexpo in excel
  • Once it loads, choose the “Sankey Chart” from the charts list.
search sankey chart in excel
  • Click the “Create Chart From Selection” button after selecting the data from the sheet, as shown.
Click Create Chart From Selection After Making Project Tracker Template in Excel
  • ChartExpo will generate the visualization below for you.
Initial Visual After Making Project Tracker Template in Excel
  • If you want to have the chart’s title, click Edit Chart, as shown in the above image.
  • Click the pencil icon next to the Chart Header to change the title.
  • It will open the properties dialog. Under the Text section, you can add a heading in Line 1 and enable Show.
  • Give the appropriate title of your chart and click the Apply button.
Add Chart Header After Making Project Tracker Template in Excel
  • You can disable the percentage sign on the values as follows:
Disable Percentage Sign on Values After Making Project Tracker Template in Excel
  • You can add the percentage sign with numbers as follows:
Add Percentage Sign with Numbers After Making Project Tracker Template in Excel
  • Let’s give colors to the nodes. Click the pencil icon at the top of the nodes and go to “Node“. Select the color and click the “Apply” button to save all changes.
Give Colors to Nodes After Making Project Tracker Template in Excel
  • Click the “Save Changes” button to persist the changes.
Click Save Changes After Making Project Tracker Template in Excel
  • Your final chart will appear as below.
Final Project Tracker Template in Excel

Insights

  • Phase 1: All tasks completed.
  • Phase 2: Tasks are in “Pending Review” and “In Progress”.
  • Phase 3: Mixed statuses include “On Hold”, “Approved”, and “Delayed”, highlighting delays and challenges.

How to Turn Project Tracker Data into Actionable Charts in Microsoft Excel:

  1. Open your Excel Application.
  2. Install ChartExpo Add-in for Excel from Microsoft AppSource to create interactive visualizations.
  3. Select Sankey Chart from the list of charts.
  4. Select your data.
  5. Click on the “Create Chart from Selection” button.
  6. Customize your chart properties to add header, axis, legends, and other required information.

The following video will help you create a Sankey Chart in Microsoft Excel.

What are the Advantages and Disadvantages of Excel for Multiple Project Tracker Templates?

Juggling multiple projects? It can feel like a circus act. But with Excel, you’ve got a secret weapon to stay organized and on top of everything. Here’s why Excel is a game-changer for tracking multiple projects:

  • Flexibility: Excel lets you design trackers your way. Custom columns, colors, and formulas? No problem. It’s like a blank canvas for your project management needs.
  • User-friendly interface: There are no steep learning curves here. This makes data visualization, analysis, and data-driven decision-making easy and fast.
  • Cost-effective: Why spend big bucks on fancy tools when Excel has it all? Plus, you already have it installed.
  • Data analysis tools: Turn raw data into clear insights. Use pivot tables, charts, and filters to track progress, spot trends, and make smarter decisions.
  • Collaboration capabilities: Share your tracker with teammates in real time. Updates are seamless, and everyone stays on the same page.
  • Integration: Excel is well-suited for collaboration with other tools. You can import data from other tools or sync it with apps like SharePoint and Teams.

Disadvantages

Excel is a go-to tool for tracking projects. However, when it comes to tasks like managing chart elements in Excel can be tricky when customizing visuals. Here’s what to watch out for:

  • Scalability issues: Excel struggles when your projects grow. Too many rows? Too many tabs? Things can get messy—fast.
  • Error-prone: One wrong formula, and suddenly, your data’s out of whack. Manual entries leave a lot of room for human error.
  • Lack of automation: You’ll need to do a lot of heavy lifting yourself. Unlike dedicated tools, Excel doesn’t automate recurring tasks or reminders.
  • Limited collaboration features: Sure, you can share a file, but real-time collaboration isn’t Excel’s strong suit. Simultaneous edits can lead to version chaos.
  • No task dependencies: Do you need to link tasks to see how delays affect timelines? Excel doesn’t handle dependencies like dedicated project management tools do.
  • Complexity for large teams: The more people involved, the harder it gets. Tracking changes, maintaining accuracy, and ensuring everyone’s aligned can be a nightmare.

FAQs

How to create multiple project trackers in Excel?

To create multiple project trackers in Excel:

  • Use separate tabs or sheets for each project.
  • Customize columns for tasks, deadlines, and statuses.
  • Apply filters and conditional formatting.
  • Use formulas to track progress.
  • Save and share for collaboration.

Does Excel have a project management template?

Yes, Excel offers built-in project management templates. You can find them under “New” when opening Excel. These templates include Gantt charts, task trackers, and timelines. They’re customizable, easy to use, and great for basic project management needs.

Wrap Up

A project tracker template in Excel is a valuable tool for managing tasks and timelines. It’s pretty much like the analysis ToolPak in Excel enhances data analysis. It simplifies project organization and ensures nothing is overlooked. Using it, you can track progress efficiently and confidently meet deadlines.

This template helps break complex projects into manageable parts. It allows you to assign tasks, set deadlines, and monitor milestones. It can be likened to how a CRM template for Excel organizes customer relationships and streamlines workflows. It creates a clear roadmap for achieving goals.

Excel’s flexibility makes it easy to customize templates. You can tailor them to fit the needs of your project. This adaptability ensures the tool remains relevant across industries and team sizes. For instance, a price comparison template in Excel can simplify cost analysis in procurement or budgeting.

An Excel multiple project tracker template fosters accountability by keeping everyone informed about their roles and progress. It minimizes delays and miscommunication. With visualization tools like charts and graphs, it enhances clarity, making it easier to spot bottlenecks and adjust plans.

A project tracker template in Excel is more than just a tool—it’s your blueprint for success. It saves time, organizes tasks, and enhances productivity. From small assignments to large-scale projects, it ensures efficiency and focus.

For better visualization and insights, install ChartExpo. This add-on transforms your project data into clear, actionable visuals, helping you keep projects on track and deliver.

How much did you enjoy this article?

ExcelAd1
Start Free Trial!
146847

Related articles

next previous
Microsoft Excel8 min read

Excel Task Tracker Template for Smarter Task Insights

Task tracker template in Excel organizes tasks, tracks deadlines, and boosts efficiency. Learn its benefits, and explore expert tips to simplify task management.

Microsoft Excel10 min read

Invoice Tracker Template in Excel for Better Insights

An invoice tracker Excel template helps track invoices, due dates, and payments. Learn how to use this template for better financial management.

Microsoft Excel12 min read

Key Performance Indicators in Healthcare for Better Insights

Key Performance Indicators in healthcare track patient care and efficiency. Learn about these KPIs, top examples, and how to use them to improve outcomes.

Microsoft Excel10 min read

BMI Calculation Formula in Excel for Better Fitness Insights

The BMI calculation formula in Excel helps track and analyze body mass index. Explore step-by-step instructions and tips to simplify BMI tracking in Excel.

Microsoft Excel29 min read

How to Create a Tornado Chart in Excel? A Complete Guide

Click to learn how to plot a Tornado Chart in Excel using easy-to-follow steps. Also, we’ll address the following question: what is a Tornado Diagram?

ChartExpo logo

Turn Data into Visual
Stories

CHARTEXPO

  • Home
  • Gallery
  • Videos
  • Services
  • Pricing
  • Contact us
  • FAQs
  • Privacy policy
  • Terms of Service
  • Sitemap

TOOLS

  • ChartExpo for Google Sheets
  • ChartExpo for Microsoft Excel
  • Power BI Custom Visuals by ChartExpo
  • Word Cloud

CATEGORIES

  • Bar Charts
  • Circle Graphs
  • Column Charts
  • Combo Charts
  • Comparison Charts
  • Line Graphs
  • PPC Charts
  • Sentiment Analysis Charts
  • Survey Charts

TOP CHARTS

  • Sankey Diagram
  • Likert Scale Chart
  • Comparison Bar Chart
  • Pareto Chart
  • Funnel Chart
  • Gauge Chart
  • Radar Chart
  • Radial Bar Chart
  • Sunburst Chart
  • see more
  • Scatter Plot Chart
  • CSAT Survey Bar Chart
  • CSAT Survey Chart
  • Dot Plot Chart
  • Double Bar Graph
  • Matrix Chart
  • Multi Axis Line Chart
  • Overlapping Bar Chart
  • Control Chart
  • Slope Chart
  • Clustered Bar Chart
  • Clustered Column Chart
  • Box and Whisker Plot
  • Tornado Chart
  • Waterfall Chart
  • Word Cloud
  • see less

RESOURCES

  • Blog
  • Resources
  • YouTube
SIGN UP FOR UPDATES

We wouldn't dream of spamming you or selling your info.

© 2025 ChartExpo, all rights reserved.