• Home
  • Tools dropdown img
    • Spreadsheet Charts

      • ChartExpo for Google Sheets
      • ChartExpo for Microsoft Excel
    • Power BI Charts

      • Power BI Custom Visuals by ChartExpo
    • Word Cloud

  • Charts dropdown img
    • Chart Category

      • Bar Charts
      • Circle Graphs
      • Column Charts
      • Combo Charts
      • Comparison Charts
      • Line Graphs
      • PPC Charts
      • Sentiment Analysis Charts
      • Survey Charts
    • Chart Type

      • Box and Whisker Plot
      • Clustered Bar Chart
      • Clustered Column Chart
      • Comparison Bar Chart
      • Control Chart
      • CSAT Survey Bar Chart
      • CSAT Survey Chart
      • Dot Plot Chart
      • Double Bar Graph
      • Funnel Chart
      • Gauge Chart
      • Likert Scale Chart
      • Matrix Chart
      • Multi Axis Line Chart
      • Overlapping Bar Chart
      • Pareto Chart
      • Radar Chart
      • Radial Bar Chart
      • Sankey Diagram
      • Scatter Plot Chart
      • Slope Chart
      • Sunburst Chart
      • Tornado Chart
      • Waterfall Chart
      • Word Cloud
    • Google Sheets
      Microsoft Excel
  • Services
  • Pricing
  • Contact us
  • Blog
  • Support dropdown img
      • Gallery
      • Videos
      • Contact us
      • FAQs
      • Resources
    • Please feel free to contact us

      atsupport@chartexpo.com

Categories
All Data Visualizations Data Analytics Surveys
Add-ons/
  • Google Sheets
  • Microsoft Excel
  • Power BI
All Data Visualizations Data Analytics Surveys
Add-ons
  • Google Sheets
  • Microsoft Excel
  • Power BI

We use cookies

This website uses cookies to provide better user experience and user's session management.
By continuing visiting this website you consent the use of these cookies.

Ok

ChartExpo Survey


Home > Blog > Microsoft Excel

How to Select Data for a Chart in Excel?

Are you ready to become skilled at making powerful charts in Excel?

Picture this: You have an upcoming presentation and must present intricate data in an attractive visual format. This is the key to success: knowing how to select data for a chart in Excel.

How to Select Data for a Chart in Excel

A well-crafted chart is unmatched in its ability to make a convincing argument or reveal a pattern. Finance professionals depend on Excel charts and graphs to illustrate trends and analyses in their datasets. But the challenge lies in choosing the correct chart for the job. Most importantly, it is important to select the data that will bring it to life.

So, how do you select data for a chart in Excel to create compelling visual representations? Let’s dive in and explore this essential skill.

Assume you’re preparing a portfolio analysis or a cash flow comparison. Selecting and translating the right data into a chart can significantly enhance the impact of your analysis. With Excel offering 18 types of default charts, the possibilities are endless.

You want to create a bar chart to illustrate your data. Select the desired data range, head to the ‘Insert’ tab, and choose the bar chart option. You’re well on your way to crafting a persuasive visual aid.

It’s as simple as that!

So, are you ready to elevate your data presentations with compelling, insightful charts? Let’s demystify chart selection in Excel and unlock its potential.

Table of Contents:

  1. Understanding the Process of Selecting Data for a Chart in Excel
  2. Why is Data Selection Important for a Chart in Excel?
  3. How to Select Data for a Chart in Excel?
  4. How Do You Create a Chart from the Selected Range of Cells?
  5. What are the Best Practices for Selecting Data in Excel?
  6. Wrap Up

First…

Understanding the Process of Selecting Data for a Chart in Excel

Definition: Data selection in Excel is like picking the perfect ingredients for a recipe. Choosing the right numbers and labels ensures your chart is clear and impactful.

This step is crucial because it directly affects your chart’s clarity and usefulness. Plus, understanding how to add axis labels in Excel further refines your data presentation, ensuring every detail is easy to understand and visually engaging.

Here’s a simple guide to doing it:

  1. Highlight your data: Click and drag over the cells that contain the data you want to use.
  2. Choose chart type: Go to the ‘Insert’ tab and pick the style that best fits your data (like a bar, line, slop chart, or pie chart).
  3. Adjust if needed: You can change the data range or edit the chart elements like titles and labels for better clarity.

This step is vital because well-selected data makes your chart easy to read. It helps others quickly grasp the information you’re trying to present. A good chart can turn complex data into simple visuals, aiding data-driven decision-making and communication.

Why is Data Selection Important for a Chart in Excel?

Creating a chart in Excel can turn a heap of numbers into a clear visual story. However, selecting the right data is crucial to make your chart truly effective. It’s like choosing the right words for a compelling narrative, every detail matters. The power of visual storytelling lies in how well you pick and present your data, transforming complex information into an engaging and understandable format that captivates your audience. Here’s why:

  • Accuracy and relevance: Picking the right data ensures your chart reflects the actual story you want to tell. If you select the wrong data, your chart might be misleading or irrelevant.
  • Clarity and communication: Good data selection, including the use of a Sunburst chart, makes your presentation easy to read and understand. This clarity helps others quickly grasp your key points, making your communication more effective.
  • Tailored analysis: Choosing specific data lets you focus on what matters most. You can tailor your analysis to highlight trends, comparisons, or insights important to your audience. This targeted approach enhances the effectiveness of your presentation and makes your findings more compelling. By focusing on key elements, you can provide a clear and concise picture of the data, making trend analysis more impactful.
  • Visualization efficiency: Efficient data selection means your chart, including circular graphs like a Chord diagram, will be clean and not overloaded with unnecessary information. This makes your visuals more impactful and easier to interpret.
  • Data integrity and updates: Using the correct data ensures your chart stays accurate. When the data source updates, your chart can automatically reflect these changes if set up properly, maintaining data integrity.

How to Select Data for a Chart in Excel?

Here’s a step-by-step guide to selecting data for a chart in Excel:

  1. Organize your data: Before starting, make sure your data is clean and well-organized. Use clear headers and ensure the information is structured logically.
  2. Highlight data range: Click and drag to select the cells that contain the data you want to include in your chart. Be sure to include both the data and the headers for clarity.
  3. Insert the chart: Go to the ”˜Insert’ tab on the Excel ribbon. Here, you’ll find a variety of chart options to choose from.
  4. Choose chart type: Select the chart that best fits your data. Excel offers many options, such as bar charts, line charts, pie charts, and more. Pick one that will best represent your data.
  5. Customize chart (optional): Once your chart is created, you can customize it to suit your needs better. Add titles, adjust colors, and modify labels to make your chart more informative and visually appealing. Choosing the best colors for graphs can significantly enhance readability and help highlight key data points, making your visual representation more effective and engaging.
  6. Update data (if necessary): If your data changes or you need to add more, update your chart by adjusting the data range. Excel charts can dynamically adjust if set up correctly.
  7. Finalize and save: After ensuring everything looks perfect, finalize your chart and save your workbook. This preserves your work and makes it easy to share with others.

How Do You Create a Chart from the Selected Range of Cells?

Data visualization is the art of telling stories with data, and what better storyteller than a chart?

But alas, Excel, the trusty companion of countless data analysts, falls short of ready-made custom charts.

Fear not, for there’s an unassuming hero on the horizon – ChartExpo! This affordable add-in seamlessly integrates with Excel, offering a treasure trove of insightful charts, graphs, maps, and even Waterfall charts.

Say goodbye to the limitations of standard Excel charts. Embrace Excel’s visually appealing custom Excel charts that breathe life into raw data with a click or two.

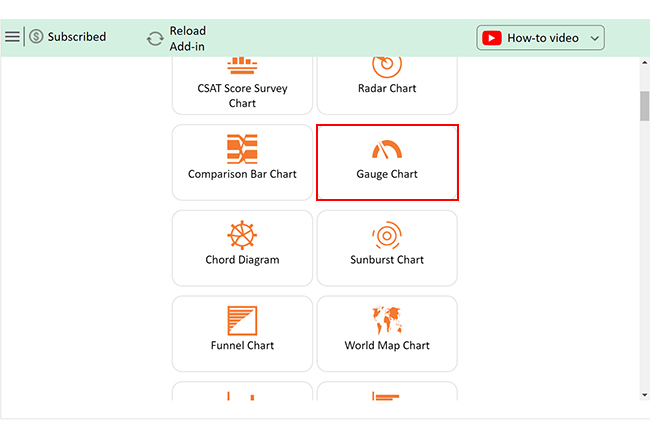
Let’s learn how to install ChartExpo in Excel.

  1. Open your Excel application.
  2. Open the worksheet and click the “Insert” menu.
  3. You’ll see the “My Apps” option.
  4. In the Office Add-ins window, click “Store” and search for ChartExpo on my Apps Store.
  5. Click the “Add” button to install ChartExpo in your Excel.

ChartExpo charts are available both in Google Sheets and Microsoft Excel. Please use the following CTAs to install the tool of your choice and create beautiful visualizations with a few clicks in your favorite tool.

Data Selection in Excel Example

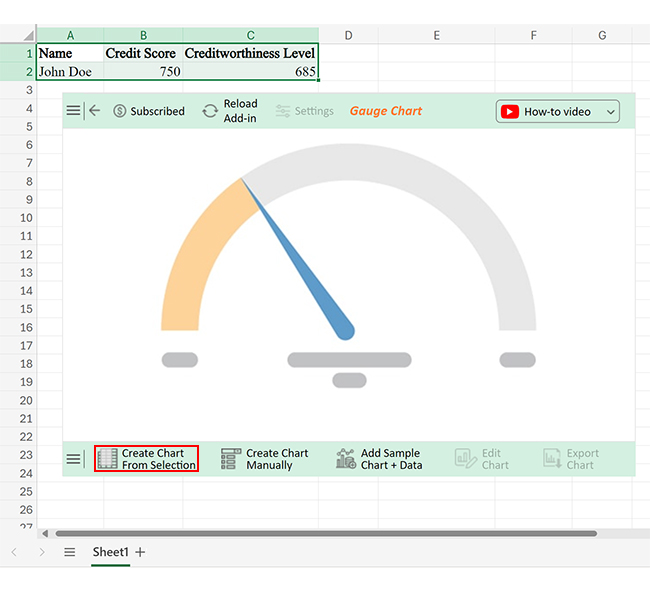
Let’s create a chart from the data below in Excel using ChartExpo.

Name Credit Score Creditworthiness Level
John Doe 750 685
  • To get started with ChartExpo, install ChartExpo in Excel.
  • Now Click on My Apps from the INSERT menu.
insert chartexpo in excel
  • Choose ChartExpo from My Apps, then click Insert.
open chartexpo in excel
  • Once it loads, scroll through the charts list to locate and choose the “Gauge Chart”.
search gauge chart in excel
  • Click the “Create Chart From Selection” button after selecting the data from the sheet, as shown.
Click Create Chart From Selection After Learning How to Select Data for a Chart in Excel
  • ChartExpo will generate the visualization below for you.
Click Edit Chart After Learning How to Select Data for a Chart in Excel
  • If you want to add anything to the chart, click the Edit Chart button:
  • Click the pencil icon next to the Chart Header to change the title.
  • It will open the properties dialog. Under the Text section, you can add a heading in Line 1 and enable Show.
  • Give the appropriate title of your chart and click the Apply button.
Add Chart Header After Learning How to Select Data for a Chart in Excel
  • Click the “Save Changes” button to persist the changes made to the chart.
Click Save Changes After Learning How to Select Data for a Chart in Excel
  • Your final Gauge Chart will look like the one below.
Final How to Select Data for a Chart in Excel

Insights

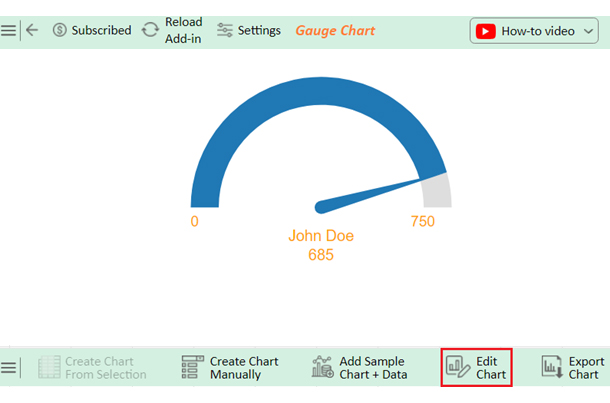
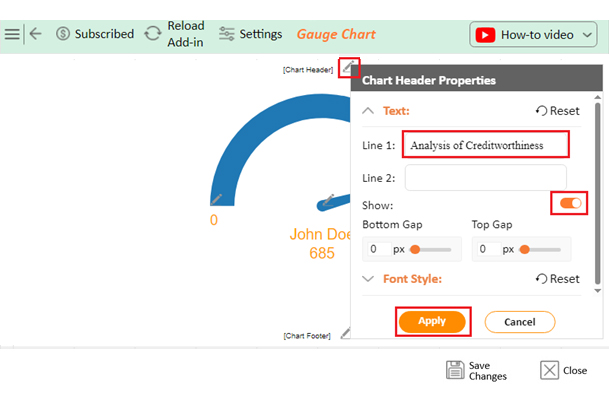
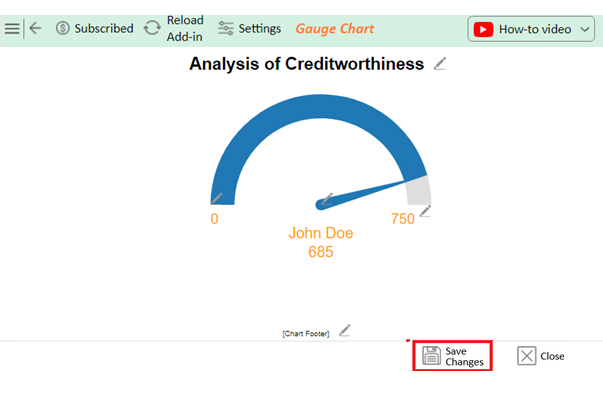
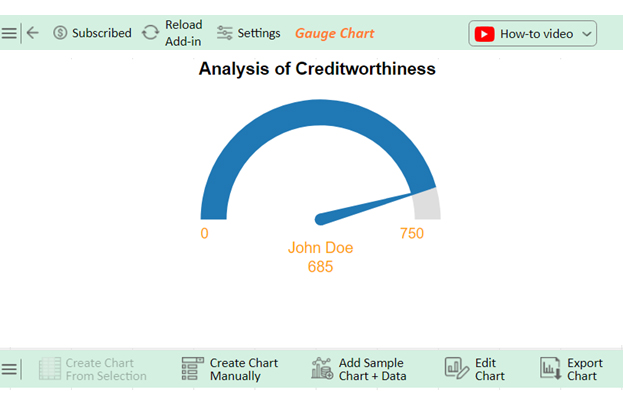
John Doe has a solid credit score of 685, demonstrating exceptional creditworthiness.

What are the Best Practices for Selecting Data in Excel?

Creating effective charts in Excel starts with selecting the right data. Here are some best practices to keep in mind:

  1. Organize data properly: Before you even think about making a chart, make sure your data is neat and well-structured. Use clear headers and arrange your information in a logical order to avoid misleading graphs. This will ensure that your visualizations are both accurate and informative.
  2. Select the entire data range: Always include all relevant data, including headers, to ensure your chart is complete and accurate.
  3. Avoid selecting blank rows or columns: Blank spaces can confuse Excel and mess up your chart. Make sure your data range is solid and continuous.
  4. Consider data integrity: Ensure your data is accurate and up-to-date. Double-check for errors or inconsistencies before you create your chart.
  5. Be mindful of data types: Different data types (numbers, dates, text) should be appropriately handled. Mixing them up can lead to confusing charts.
  6. Use named ranges: Assign names to your data ranges for easier reference and better organization, especially if you’re working with large datasets.
  7. Dynamic data ranges: Use dynamic ranges so your charts update automatically when you add new data. This keeps your visuals current without extra effort.
  8. Selecting data for specific chart types: Choose data that suits the chart you want to create. For example, use time-based data for line charts and categorical data for bar charts.
  9. Data validation and cleansing: Before charting, validate and clean your data to remove duplicates, correct errors, and ensure consistency. This step ensures your chart is based on reliable data.
  10. Document data selections: Keep a record of the data ranges and sources you used for your charts, including Tornado charts. This documentation is useful for future updates and for others who may need to understand your work.

FAQs

How to select specific data for a chart in Excel?

To select specific data for a chart in Excel:

  1. Highlight the desired data cells.
  2. Include headers if needed.
  3. Go to ‘Insert’ and choose a chart type.
  4. Customize as required.
  5. Update data range if necessary.

How can I adjust the data I have selected for my chart in Excel?

To adjust selected data for your chart in Excel:

  1. Click on the chart.
  2. Go to the ‘Chart Design’ tab.
  3. Select ‘Select Data’.
  4. Modify the data range.
  5. Press ‘OK’ to apply changes.

How do you select data series in an Excel chart?

To select data series in an Excel chart:

  1. Click on the chart.
  2. Right-click a data series.
  3. Choose ‘Select Data’.
  4. Click ‘Add,’ ‘Edit,’ or ‘Remove’ in the dialog box to adjust the series.

Wrap Up

Selecting data for a chart in Excel is crucial for effective data visualization. It ensures the information presented is accurate, relevant, and easy to understand. Well-organized data forms the foundation of any good chart, making the selection process essential.

Highlight the correct data range, including all necessary information, such as headers and values. This step prevents any misinterpretation and keeps the chart clear. Avoid blank rows or columns to ensure the chart remains intact and interpretable.

Consider data integrity. Accurate data leads to reliable charts. Also, be mindful of data types – mixing different types can confuse. Clean, validated data forms the backbone of trustworthy charts.

Use named and dynamic ranges to enhance efficiency. These techniques allow for easy updates and modifications. Named ranges make the data selection process more manageable, while dynamic ranges ensure charts update automatically with new data.

Choose the right data for specific chart types. Each chart type is suited for different kinds of data. Ensuring the selected data matches the chart type enhances the visual’s effectiveness and clarity.

Lastly, document your data selections. This ensures that others can understand your work. It also makes future updates easier, maintaining the chart’s accuracy over time.

Follow these practices to create clear, accurate, and meaningful charts in Excel.

How much did you enjoy this article?

ExcelAd2
Start Free Trial!
137068

Related articles

next previous
Microsoft Excel11 min read

How to Plot a Speedometer Chart in Excel?

Create a Speedometer Chart in Excel to track KPIs, goals, and performance metrics visually. Explore templates, examples, and step-by-step instructions for better dashboards.

Microsoft Excel13 min read

Excel for Teachers for Insightful Preparation

Excel for teachers simplifies grading, tracks attendance, and organizes data. Find its key features, expert tips, and how ChartExpo enhances data visualization.

Microsoft Excel14 min read

How to Make a Cash Flow Diagram in Excel?

Learn how to make a Cash Flow Diagram in Excel. It will help you learn to visualize and analyze inflows and outflows of your business cash flow.

Microsoft Excel11 min read

Succession Planning Template for Long-Term Success

Succession Planning Templates help businesses prepare for leadership changes. Learn to create, analyze, and use them for seamless transitions and growth.

Microsoft Excel10 min read

Grant Tracking Spreadsheet: Insights Made Easy

A Grant Tracker Spreadsheet helps track funding, deadlines, and expenses in Excel. Learn to use grant tracking templates, analyze data, and stay organized.

ChartExpo logo

Turn Data into Visual
Stories

CHARTEXPO

  • Home
  • Gallery
  • Videos
  • Services
  • Pricing
  • Contact us
  • FAQs
  • Privacy policy
  • Terms of Service
  • Sitemap

TOOLS

  • ChartExpo for Google Sheets
  • ChartExpo for Microsoft Excel
  • Power BI Custom Visuals by ChartExpo
  • Word Cloud

CATEGORIES

  • Bar Charts
  • Circle Graphs
  • Column Charts
  • Combo Charts
  • Comparison Charts
  • Line Graphs
  • PPC Charts
  • Sentiment Analysis Charts
  • Survey Charts

TOP CHARTS

  • Sankey Diagram
  • Likert Scale Chart
  • Comparison Bar Chart
  • Pareto Chart
  • Funnel Chart
  • Gauge Chart
  • Radar Chart
  • Radial Bar Chart
  • Sunburst Chart
  • see more
  • Scatter Plot Chart
  • CSAT Survey Bar Chart
  • CSAT Survey Chart
  • Dot Plot Chart
  • Double Bar Graph
  • Matrix Chart
  • Multi Axis Line Chart
  • Overlapping Bar Chart
  • Control Chart
  • Slope Chart
  • Clustered Bar Chart
  • Clustered Column Chart
  • Box and Whisker Plot
  • Tornado Chart
  • Waterfall Chart
  • Word Cloud
  • see less

RESOURCES

  • Blog
  • Resources
  • YouTube
SIGN UP FOR UPDATES

We wouldn't dream of spamming you or selling your info.

© 2025 ChartExpo, all rights reserved.