• Home
  • Tools dropdown img
    • Spreadsheet Charts

      • ChartExpo for Google Sheets
      • ChartExpo for Microsoft Excel
    • Power BI Charts

      • Power BI Custom Visuals by ChartExpo
    • Word Cloud

  • Charts dropdown img
    • Chart Category

      • Bar Charts
      • Circle Graphs
      • Column Charts
      • Combo Charts
      • Comparison Charts
      • Line Graphs
      • PPC Charts
      • Sentiment Analysis Charts
      • Survey Charts
    • Chart Type

      • Box and Whisker Plot
      • Clustered Bar Chart
      • Clustered Column Chart
      • Comparison Bar Chart
      • Control Chart
      • CSAT Survey Bar Chart
      • CSAT Survey Chart
      • Dot Plot Chart
      • Double Bar Graph
      • Funnel Chart
      • Gauge Chart
      • Likert Scale Chart
      • Matrix Chart
      • Multi Axis Line Chart
      • Overlapping Bar Chart
      • Pareto Chart
      • Radar Chart
      • Radial Bar Chart
      • Sankey Diagram
      • Scatter Plot Chart
      • Slope Chart
      • Sunburst Chart
      • Tornado Chart
      • Waterfall Chart
      • Word Cloud
    • Google Sheets
      Microsoft Excel
  • Services
  • Pricing
  • Contact us
  • Blog
  • Support dropdown img
      • Gallery
      • Videos
      • Contact us
      • FAQs
      • Resources
    • Please feel free to contact us

      atsupport@chartexpo.com

Categories
All Data Visualizations Data Analytics Surveys
Add-ons/
  • Google Sheets
  • Microsoft Excel
  • Power BI
All Data Visualizations Data Analytics Surveys
Add-ons
  • Google Sheets
  • Microsoft Excel
  • Power BI

We use cookies

This website uses cookies to provide better user experience and user's session management.
By continuing visiting this website you consent the use of these cookies.

Ok

ChartExpo Survey


Home > Blog > Microsoft Excel

How to Create a Progress Bar in Excel? Easy to Follow Steps

Introduction: Progress Bar in Excel

Tracking progress in Excel is essential for managing projects, monitoring goals, and ensuring tasks are completed on time.

A Progress Bar in Excel helps you visualize how much work has been completed versus what remains. This makes it easier to track milestones, identify delays, and communicate progress clearly to stakeholders.

progress-bar-in-excel

But here’s the challenge:

Excel’s default progress bar options are limited and often lack the visual impact needed for professional reporting. Creating advanced progress charts like Gauge Charts, Overlapping Bar Charts, or Radial Progress Charts can be time-consuming without the right tools.

Whether you’re managing projects, tracking KPIs, or building dashboards, this guide will help you create clear and effective progress visualizations in Excel.

Before we dive in, let’s start with the basics.

What is the Progress Bar in Excel?

Definition: A Progress Bar in Excel is a visual chart that shows how much of a task, project, or goal has been completed compared to the total.

It typically uses a filled bar to represent completed progress and an unfilled portion to show what remains. This makes it easy to track performance, monitor milestones, and communicate progress at a glance.

Progress bars are commonly used in:

  • Project tracking
  • KPI dashboards
  • Sales and target monitoring
  • Task completion reports

How to Create a Progress Bar in Excel?

This guide will walk you through the process of creating progress bars in Excel:

progress bar in excel 1

Step 1: Input the Data

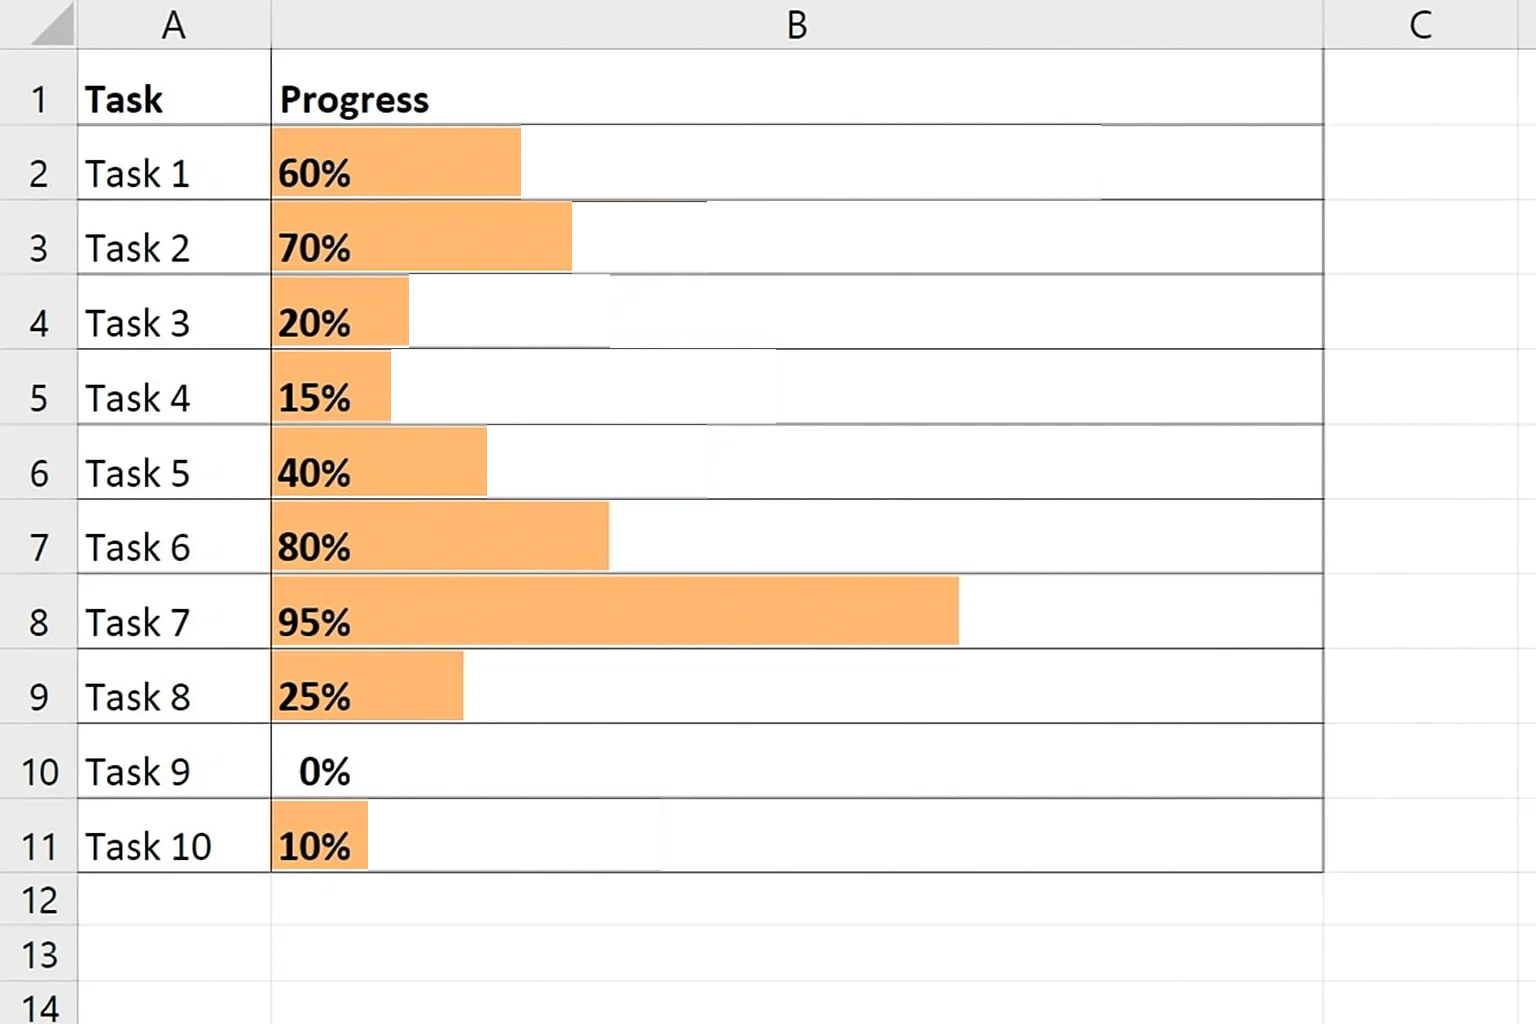
Start by entering data that represents the progress percentages for 10 different tasks.

progress bar in excel 2

Step 2: Insert the Progress Bars

Highlight the range B2:B11 where your progress percentages are stored. Then, go to the Home tab and click on the Conditional Formatting button. From the dropdown, select Data Bars, and then click on More Rules.

progress bar in excel 3

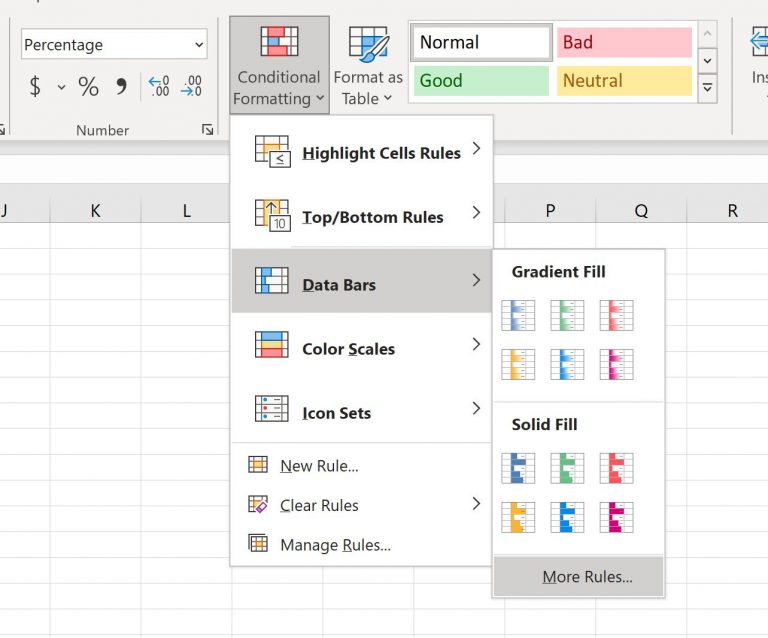
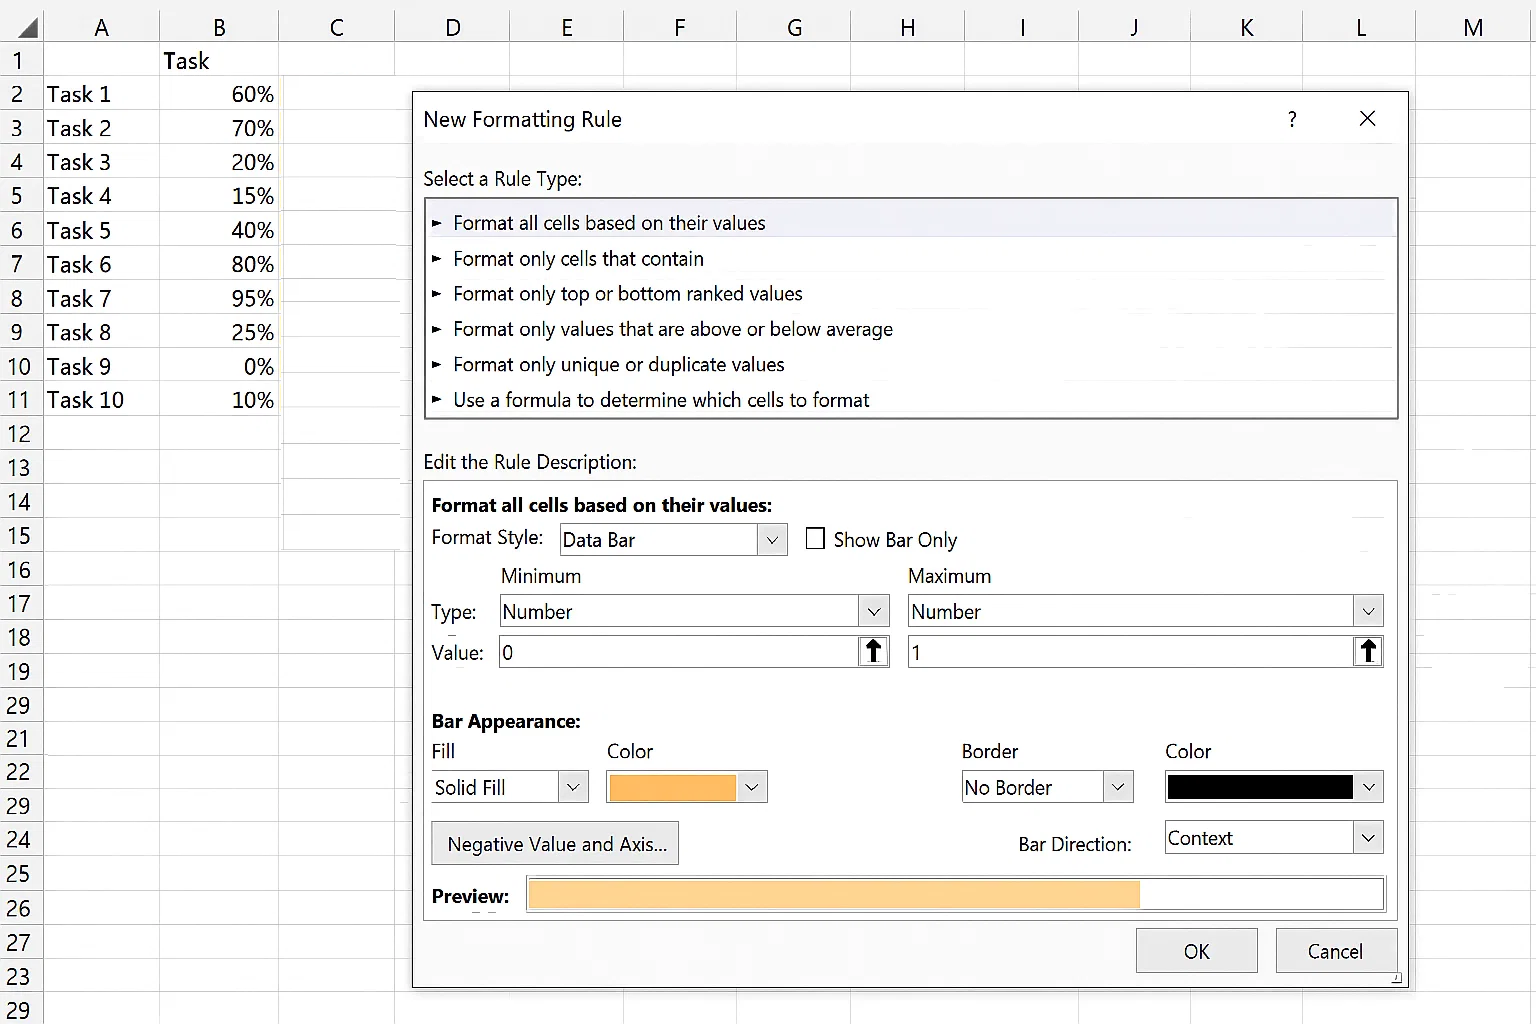
A window will pop up for further customization.

  • Set the Minimum value type to “Number” and the value to 0.
  • Set the Maximum value type to “Number” and the value to 1.

Choose a color for the bars (e.g., light green) and click OK.

progress bar in excel 4

This will apply progress bars to each cell in column B.

progress bar in excel 5

Step 3: Adjust the Progress Bars

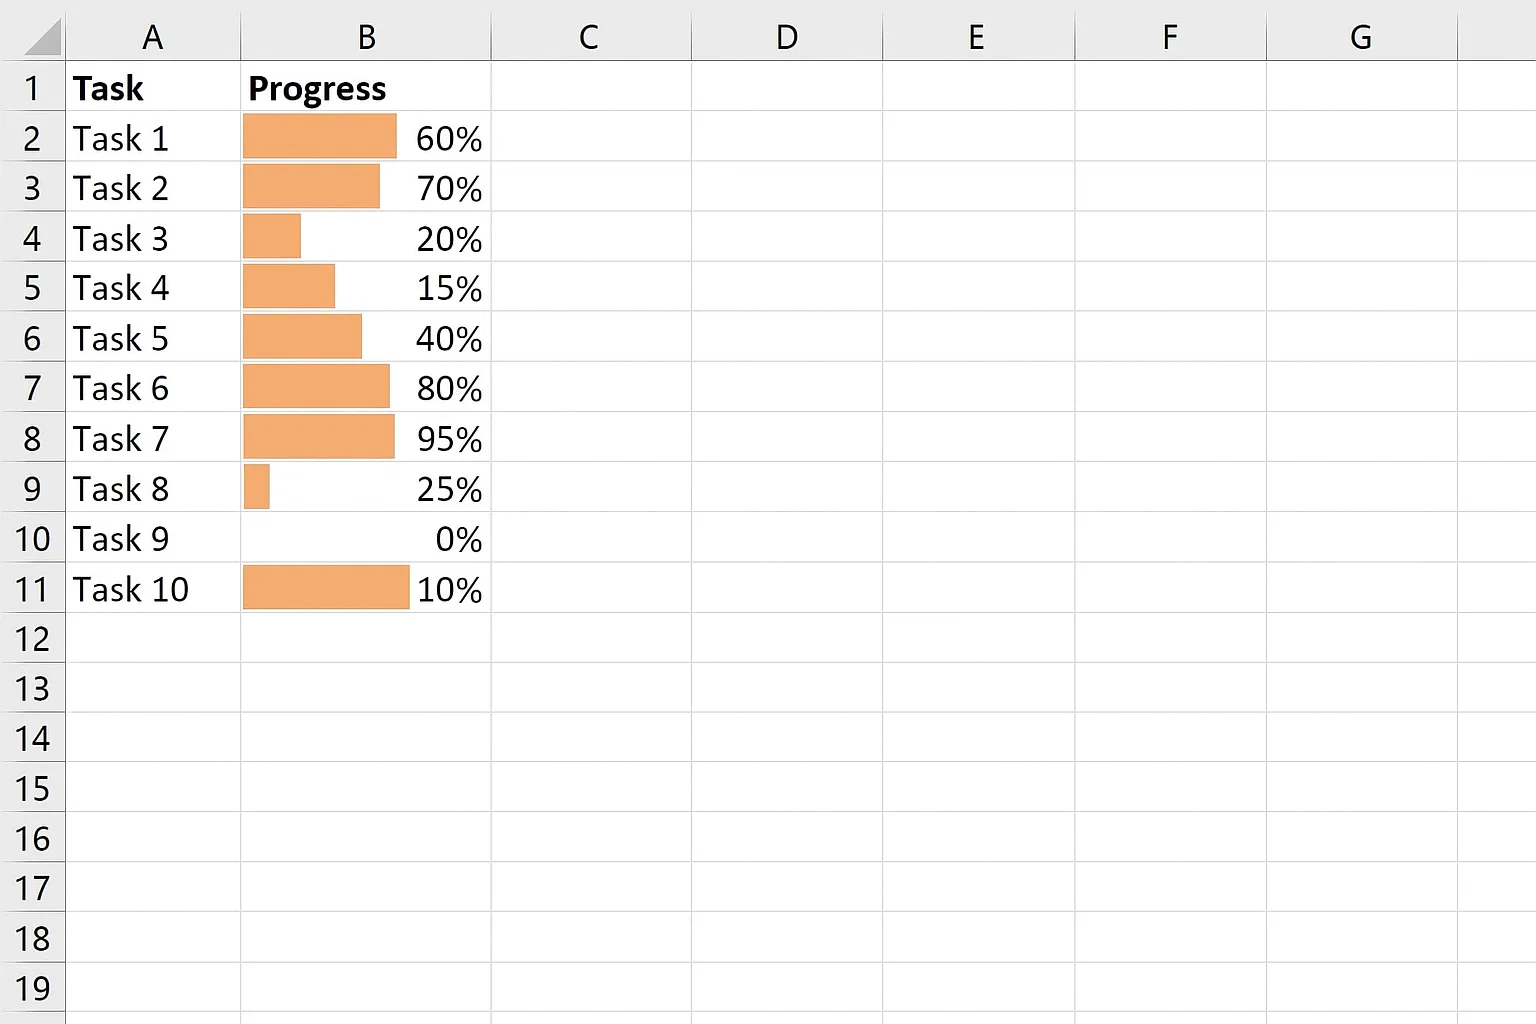
You can now adjust the column and row widths to make the progress bars more visible.

Additionally, you can add borders around the cells and align the percentage text to the left side for better clarity.

progress bar in excel 6

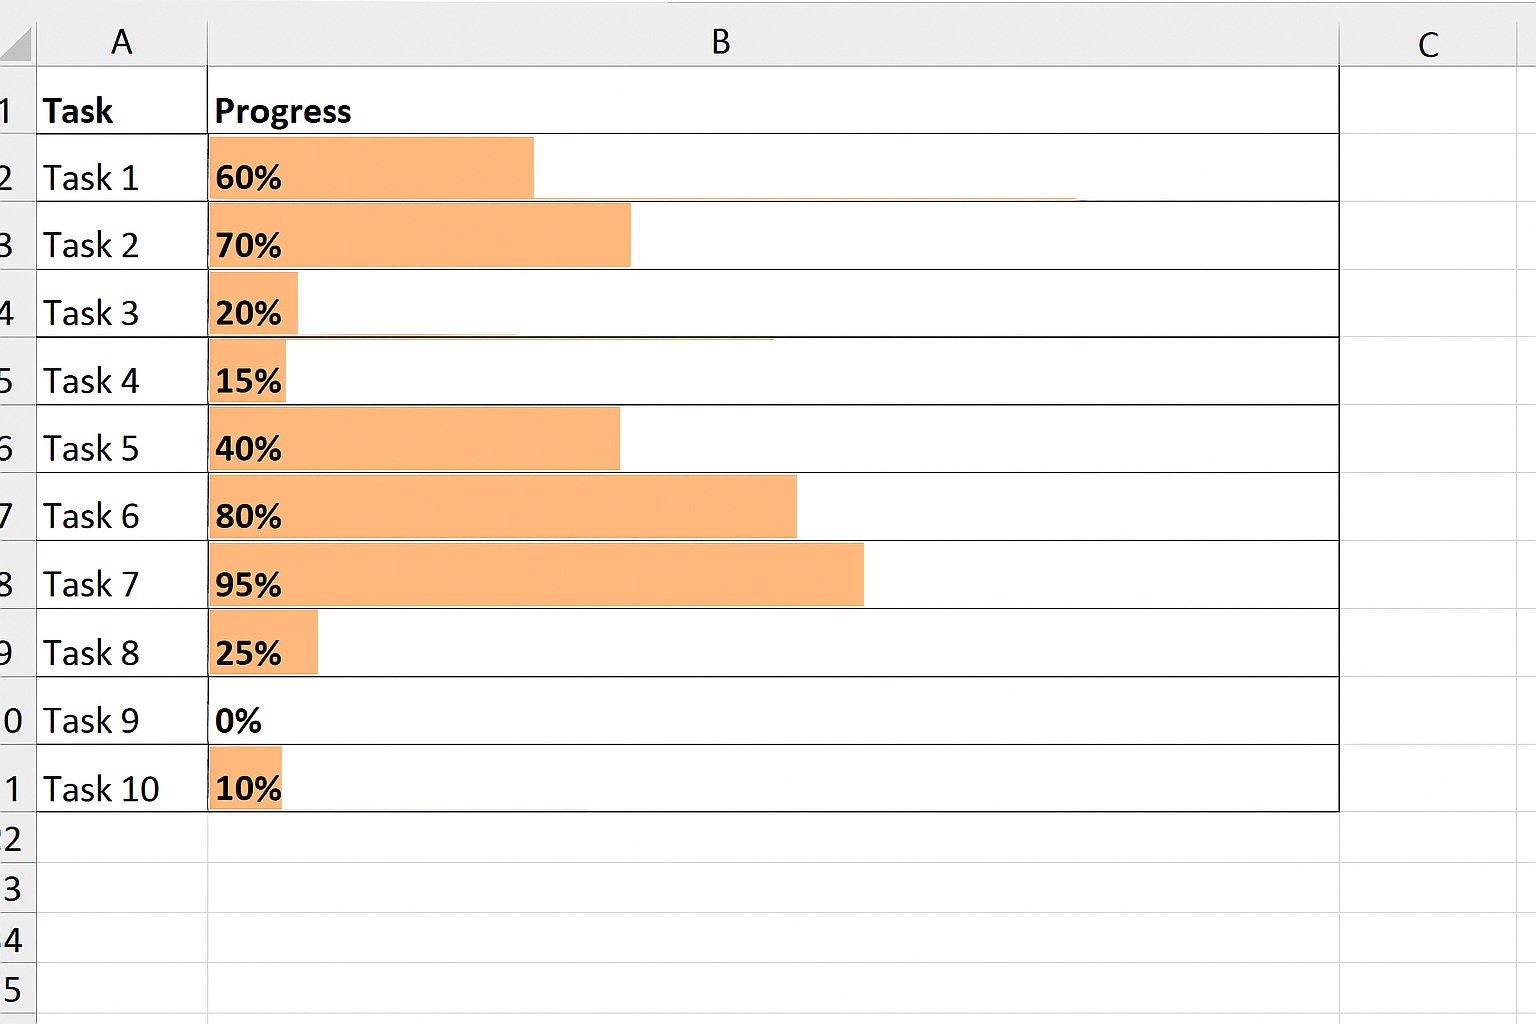
Whenever the percentage is updated, the length of the progress bar will automatically adjust accordingly.

Suppose we change the last progress to 30%

progress bar in excel 7
Observe how the progress bar instantly adjusts its length to match the updated percentage.
Here are the top 3 methods for creating a progress bar in Excel:

Conditional Formatting (Easiest & Most Common Method)

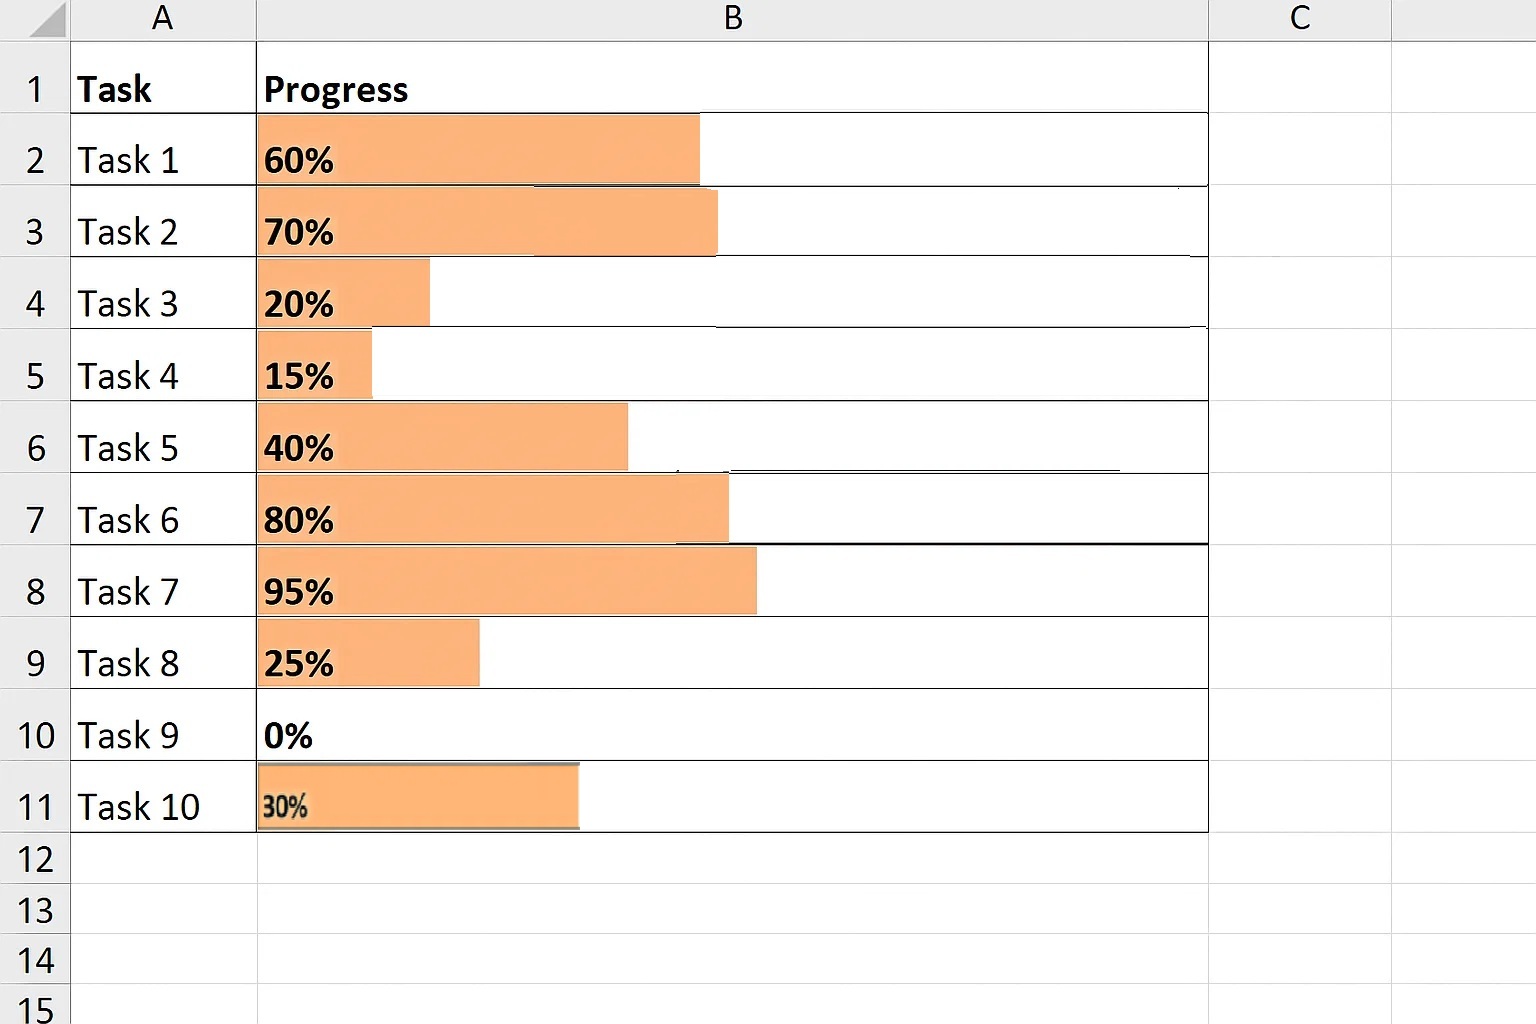
This method uses Excel’s built-in data bars to quickly visualize progress.

Step 1: Enter Your Data

  • Create a table with tasks and their completion percentages (e.g., 0% to 100%).

Step 2: Select the Percentage Values

  • Highlight the cells that contain the progress percentages.

Step 3: Apply Data Bars

  • Go to the Home tab
  • Click Conditional Formatting
  • Select Data Bars and choose a style

Step 4: Adjust Minimum and Maximum Values

  • Click Conditional Formatting → Manage Rules → Edit Rule
  • Set Minimum = Number (0)
  • Set Maximum = Number (1)
    This ensures accurate scaling of your progress bars.

Step 5: Show Bar Only (Optional)

  • Enable “Show Bar Only” to hide the percentage values and display only the visual bar.

REPT Formula (Highly Customizable Method)

This method uses Excel formulas to create text-based progress bars.

Step 1: Prepare Your Data

  • Ensure you have percentage values in decimal format (e.g., 0.7 for 70%).

Step 2: Apply the REPT Formula

  • Use the formula below to create a visual bar:
=REPT(“|”, B2*100)

Step 3: Format the Font

  • Change the font to Stencil or another solid font
  • Adjust font size and alignment for a better appearance

Step 4: Customize the Bar Length

  • Modify the multiplier (e.g., 50 instead of 100) to control the bar size.

Chart Method (Professional Visualization)

This method uses a stacked bar chart to create a clean and professional progress bar.

Step 1: Prepare Your Data

Create two columns:

  • Completed (%)
  • Remaining (%) (use formula: =1 – Completed)

Step 2: Insert a Stacked Bar Chart

  • Select your data
  • Go to Insert → Bar Chart → 100% Stacked Bar Chart

Step 3: Format the Chart

  • Set the horizontal axis Minimum = 0 and Maximum = 1
  • Remove gridlines, axis labels, and chart title

Step 4: Apply Colors

  • Set Completed = solid color (e.g., green)
  • Set Remaining = light or neutral color

Step 5: Adjust Bar Appearance

  • Reduce the gap width for a thicker bar
  • Align labels for a cleaner look

Types of Progress Bar in Excel

There are several ways to visualize progress in Excel. Each chart type helps you track completion and compare performance more effectively.

  • Overlapping Bar Chart

An Overlapping Bar Chart is used to compare two values, such as actual vs target progress.

Unlike a stacked bar chart, both bars start from the same baseline, making it easier to compare differences visually.

Best for:

  • Comparing planned vs actual progress
  • Tracking performance against targets
  • Highlighting gaps in completion

This chart uses color contrast to clearly show how far a task or goal is from completion.

Overlapping Bar Chart for tracking progress
  • Gauge Chart

A Gauge Chart (also called a speedometer chart) displays progress using a dial and a needle.

It shows how close a value is to a defined goal by placing it within a range, such as low, medium, or high performance.

Best for:

  • KPI tracking
  • Performance monitoring
  • Executive dashboards

The color segments in the chart make it easy to identify whether performance is on track or needs improvement quickly.

Gauge Chart for tracking progress
  • Radial Bar Chart

A Radial Bar Chart represents progress in a circular layout using bars arranged around a center point.

Each bar’s length indicates the level of progress, making it visually engaging and easy to interpret.

Best for:

  • Dashboard visualizations
  • Comparing multiple categories
  • Presenting progress in a modern format

This chart is especially useful when you want to display multiple progress indicators in a compact space.

Radial Bar Chart for tracking progress
  • Progress Chart

The Progress Chart is a specialized visualization designed to compare results side by side and highlight the difference.

It uses color indicators to improve readability:

  • Green shows positive progress
  • Red shows negative or below-target performance

Best for:

  • Comparing two data points instantly
  • Identifying increases or decreases
  • Creating visually clear reports

This type of chart is not available by default in Excel and typically requires an add-in like ChartExpo.

Progress Chart for tracking progress

How to Create a Progress Bar Chart in Excel Using Add-ins?

Step 1: Set Up Your Data

Projects Expectation Progress
Breeze 100 66
Point 100 88
Mecha 100 60
Synergy 100 88
Zen 100 52

Step 2: Insert a Progress Bar Chart

  • Highlight your data (excluding Task names)
  • Go to Insert → Overlapping Bar Chart

Step 3: Make the Bars Overlap

  • Right-click on one of the Actual bars
  • Select Format Data Series
  • Change Series Overlap to 100%

This will make the actual progress bar appear over the target bar.

Step 4: Adjust Gap Width

  • While still in Format Data Series, set Gap Width to around 50% or lower for a thicker, easier-to-read bar.

Step 5: Format Colors

  • Target bar → light or neutral color (background)
  • Actual bar → bold color (progress)

Optional: Use green for completed progress and red for below target.

Step 6: Add Data Labels

  • Right-click Actual bars → Add Data Labels
  • Display the percentage for each task to make it easy to interpret.

Step 7: Clean the Chart

  • Remove unnecessary elements like:
    • Gridlines
    • Chart title (optional)
    • Legend (if not needed)

Step 8: Final Progress Bar (Overlapping Bar) in Excel

  • Resize and align the chart in your dashboard
  • Adjust font, bar thickness, and colors for better readability

final progress bar in excel

Video Tutorial: How to Create a Progress Bar Chart in Excel

In the following video, you can learn how to create an Overlapping Bar Chart in Excel. You can use this chart to show the progress of different tasks and projects.

Advantages of the Excel Progress Bar

  • Easy to interpret

Quickly shows the status of tasks, projects, or goals, allowing managers and team members to grasp progress without analyzing raw numbers.

  • Visual comparison

Clearly highlights differences between actual and target progress, making it easier to track performance and identify gaps.

  • Simplifies complex data

Converts large or detailed datasets into simple, intuitive visuals that are easy to read at a glance.

  • Enhances dashboards

Improves project dashboards, KPI tracking, and reporting by presenting data in a visually appealing and organized manner.

  • Immediate insights

Enables quick decision-making by showing which tasks are on track and which need attention.

  • Customizable visuals

Colors, bar lengths, and layouts can be adjusted to emphasize priorities, deadlines, or performance thresholds.

  • Supports stakeholder communication

Makes it easier to present progress to clients, executives, or team members, improving clarity and engagement.

Tips for Creating Effective Progress Bars in Excel

Using a progress bar in Excel can visually enhance your data, helping track progress toward goals or project completion. Here are some best practices for creating effective progress bars:

  • Use Conditional Formatting

Leverage Excel’s conditional formatting to create dynamic progress bars that change color based on progress. This makes it easier to visually assess progress at a glance.

  • Select Appropriate Data Range

Choose a range of data that accurately represents the progress you want to track. Whether it’s task completion, sales progress, or project milestones, ensure the data is aligned with the intended purpose.

  • Incorporate Clear Labels

Label each progress bar clearly with relevant information, such as percentage completed or milestones achieved, to make interpretation straightforward.

  • Keep It Simple

Avoid cluttering your progress bars with too many design elements. A clean, simple bar is often more effective and easier to interpret.

  • Update Regularly

Ensure the progress bar is updated regularly as data changes. Manual updates can be time-consuming, so automate updates when possible using formulas or VBA scripts.

  • Test for Accuracy

Double-check your formulas and data ranges to ensure that the progress bar reflects accurate and up-to-date information.

Limitations of Creating an Excel Progress Bar

  • Limited Customization

Excel progress bars, usually made with conditional formatting or data bars, have restricted styling options. You can adjust colors and basic fill effects, but customizing shapes, gradients, or adding icons often requires complex workarounds or VBA.

  • No Built-in Progress Bar Control

Unlike dedicated project management tools, Excel does not offer a native, ready-to-use progress bar feature. Users typically have to build one manually using formulas and formatting, which can be time-consuming, especially for beginners.

  • Manual Updates

In many cases, the progress bar depends on user-entered values or formula-driven percentages. If data changes frequently, you must ensure your progress bar updates correctly; otherwise, it can display misleading information.

  • Not Dynamic for Complex Projects

For simple tasks, Excel progress bars work fine. But for more complex, multi-stage projects, they can’t automatically track multiple dependencies or update dynamically without advanced scripting. This makes them less reliable for detailed project tracking compared to specialized tools.

  • Performance Issues in Large Sheets

Adding too many conditional formatting rules or graphics-heavy progress bars in large workbooks can slow down Excel’s performance. This is especially noticeable when working with big datasets or shared files.

  • Limited Interactivity

Excel progress bars are static visuals. Unlike dashboards in Power BI or other reporting tools, they don’t offer interactive drill-downs or automated status updates beyond what’s built with formulas.

FAQs About Progress Bar in Excel

How is the Progress Bar in Excel best used?

A Progress Bar Chart is a visualization design you can leverage to display the progress made in a task or project. The visualization design is best suited to monitor and prioritize your objectives, providing critical data for strategic decision-making.

It uses filled bars to display milestones achieved in a project.

Why is a Progress Bar Chart more effective than other Graphs?

Progress Bar Charts are amazingly easy to read and interpret. You can use the chart to track the milestones achieved against a particular target or deadline.

The visualization design uses a series of red and green bars to depict decline and growth, respectively.

Can I automate a progress bar in Excel?

Yes. You can automate progress bars using formulas with Conditional Formatting, the REPT function, or Excel add-ins like ChartExpo. The bars update automatically as your data changes.

Wrap Up

Tracking progress is essential for completing tasks and projects on time and within budget. Progress Bar Charts in Excel make this easy by turning data into simple, visual insights that are quick to read and interpret.

While Excel offers basic chart options, creating ready-to-use, visually appealing progress bars can be time-consuming. Using an add-in allows you to access advanced Progress Bar Charts without programming skills.

With ChartExpo, you can:

  • Visualize progress clearly with minimal effort
  • Compare actual vs target performance
  • Create professional dashboards for project management or KPI tracking

Ready-made charts save time, reduce errors, and make your data stories more effective. Sign up for a 7-day free trial to explore Progress Bar Charts and other advanced Excel visualizations.

See More:

How to Create a Progress Bar in Google Sheets?

How much did you enjoy this article?

ExcelAd1
Start Free Trial!
117598

Related articles

next previous
Microsoft Excel11 min read

How to Create Control Chart in Excel?

Learn how to create a Control chart in Excel to track process stability, detect unusual variation early, and improve data-driven decision-making.

Microsoft Excel8 min read

Frequency Chart in Excel: Easy Methods Explained

Learn how to create and use frequency charts in Excel to simplify data analysis, visualize distributions, and make better business decisions with clear insights.

Microsoft Excel9 min read

How to Identify Box Plot Outliers? Easy Steps

Learn what box plot outliers in Excel are, how to detect them using the IQR method, and how to interpret them with real-world examples and Excel use cases.

Microsoft Excel11 min read

Data Validation in Excel: A Complete Guide

Data validation in Excel prevents errors before they spread. Explore types, setup steps, removal, and benefits for cleaner data. Read on!

Microsoft Excel9 min read

How to Use SUMPRODUCT in Excel: Formula & Insights

How to use SUMPRODUCT in Excel for weighted averages, conditionals, and multi-range calculations. Master the syntax and examples. Read on!

ChartExpo logo

Turn Data into Visual
Stories

CHARTEXPO

  • Home
  • Gallery
  • Videos
  • Services
  • Pricing
  • Contact us
  • FAQs
  • Privacy policy
  • Terms of Service
  • Sitemap

TOOLS

  • ChartExpo for Google Sheets
  • ChartExpo for Microsoft Excel
  • Power BI Custom Visuals by ChartExpo
  • Word Cloud

CATEGORIES

  • Bar Charts
  • Circle Graphs
  • Column Charts
  • Combo Charts
  • Comparison Charts
  • Line Graphs
  • PPC Charts
  • Sentiment Analysis Charts
  • Survey Charts

TOP CHARTS

  • Sankey Diagram
  • Likert Scale Chart
  • Comparison Bar Chart
  • Pareto Chart
  • Funnel Chart
  • Gauge Chart
  • Radar Chart
  • Radial Bar Chart
  • Sunburst Chart
  • see more
  • Scatter Plot Chart
  • CSAT Survey Bar Chart
  • CSAT Survey Chart
  • Dot Plot Chart
  • Double Bar Graph
  • Matrix Chart
  • Multi Axis Line Chart
  • Overlapping Bar Chart
  • Control Chart
  • Slope Chart
  • Clustered Bar Chart
  • Clustered Column Chart
  • Box and Whisker Plot
  • Tornado Chart
  • Waterfall Chart
  • Word Cloud
  • see less

RESOURCES

  • Blog
  • Resources
  • YouTube
SIGN UP FOR UPDATES

We wouldn't dream of spamming you or selling your info.

© 2026 ChartExpo, all rights reserved.