Categories
In the dynamic realm of data analysis and spreadsheet management, harnessing the full potential of Excel on Mac is synonymous with embracing the transformative capabilities of “Add-ins for Excel Mac.”


These powerful extensions serve as invaluable tools, unlocking a plethora of functionalities to streamline tasks and enhance efficiency.
You might be wondering, how do I use add-ins to create charts in Excel on my Mac?
Fear not, my friend, for I am here to guide you through this mystical realm of data manipulation.
Creating a chart using Add-Ins for Excel Mac is as easy as pie. Open your Excel, navigate the Add-Ins tab, and choose the add-in that tickles your fancy. You’ll transform your dull data into a visual masterpiece with a few clicks.
From fancy bar charts to stunning pie graphs, the choices are endless. Today, we’ll discuss one specific add-in to make your chart creation experience a breeze.
Definition: Add-ins for Excel Mac are external software extensions that enhance Excel’s functionality. They offer specialized tools and features for tasks like data analysis, data visualization, and automation. These add-ins can be installed and integrated into Excel, allowing access to advanced capabilities and simplifying complex tasks.
As a result, Excel on Mac becomes more versatile and powerful. It’s capable of creating a wide range of charts, including the versatile Stacked waterfall chart in Excel, double bar chart, slop charts, and many more.
Security and compatibility are important aspects to consider when using Add-Ins for Excel MAC. They are secured through an add-in runtime environment that ensures the add-ins cannot harm the user’s environment. Let’s look at the measures that ensure your experience remains smooth and secure without compromising functionality.
Ensuring Source Authenticity is pivotal in data-driven realms, and Add-ins for Excel Mac play a crucial role. Always download Excel add-ins from reputable sources. Using add-ins from unknown or unverified sources can expose your Mac to security risks. Stick to official sources like the Microsoft Office Store or well-known vendors to ensure the add-ins’ authenticity.
Be cautious when granting permissions to add-ins during installation. Only provide the permissions necessary for the add-in functionality. Also, avoid add-ins that request excessive or unnecessary access to your data or system.
Check user reviews and ratings for add-ins before installing them. These can provide insights into the add-in’s reliability, security, and overall performance. When considering productivity tools like Add-ins for Excel Mac, examining reviews and ratings becomes imperative.
Stay ahead with the latest features and improvements by keeping a close eye on updates for Add-ins for Excel Mac. Developers often release updates to address security vulnerabilities and improve compatibility. Keeping your software up to date helps ensure prompt application of security patches.
Understand how add-ins handle your data. Some add-ins may require access to your data to function properly. Safeguard your sensitive data with a focus on Data Privacy when utilizing Add-ins for Excel Mac. Moreover, avoid add-ins that may compromise sensitive information.
Seamlessly integrate Add-ins for Excel Mac by prioritizing Version Compatibility. Some add-ins may not work with older versions or may require the latest updates.
Harmonize productivity with your preferred Operating System when employing Add-ins for Excel Mac. Updates to the macOS may impact the functionality of add-ins. Therefore, it’s essential to verify compatibility with your operating system.
Some add-ins may rely on third-party software or libraries. Ensure you have the required software components installed on your Mac to support the add-in’s operation.
Confirm that your Mac meets the hardware requirements specified by the add-in. Some advanced add-ins may require more processing power or memory, and incompatible hardware could lead to performance issues.
Macros and VBA play a crucial role in Excel add-ins on Mac. However, not all add-ins fully support Macros or VBA functionalities on Mac. Therefore, confirming your chosen add-ins with Macros or VBA functions seamlessly with Excel for Mac is essential.
While Excel for Mac offers a robust set of features, add-ins supercharge your experience by unlocking a new realm of functionality and customization. Here’s why add-ins are crucial for maximizing the potential of Excel Mac:
Specialized Features: Excel’s got some hidden gems, and add-ins are the key to unlocking them! These handy tools go way beyond the basics, offering features tailored just for you. Need to crunch numbers like a pro? Power BI on Mac is your friend. Juggling multiple projects?
Automation Powerhouse: Say goodbye to repetitive tasks! By automating repetitive tasks like data formatting and report generation with add-ins, you can eliminate human error and focus on the higher-level thinking required for insightful analysis and strategic decisions.
Personalized Experience: Craft your ideal Excel environment with add-ins offering custom functions, templates, and dashboards. Adapt it to your workflow for optimal results.
Streamlined Workflows: These powerful tools effortlessly pull data from cloud storage, social media, and various sources, allowing you to focus on insights, not collection.
Enhanced Collaboration: Unlock the power of real-time collaboration with add-ins! Share insights and work together efficiently on spreadsheets, ensuring everyone is aligned and contributing effectively.
Unlock Productivity Gains: Streamline your work with add-ins that tackle complex tasks automatically. Free up valuable time for strategic thinking, insightful analysis, and crafting compelling data visualizations.
Industry-Specific Solutions: Discover specialized features for finance, marketing, healthcare, or your unique needs. These add-ins offer tailored tools and insights crucial for your success.
Customizable Solutions: Don’t settle for generic solutions. Custom add-ins can be tailored to your specific needs, offering a powerful answer to even the most unique challenges, both personal and professional.
Mac App Store: Discover and install reputable add-ins directly from the Mac App Store, ensuring compatibility and security. Find add-ins for various purposes, ranging from general productivity to industry-specific tools.
Developer Websites: Access a wider range of add-ins from developer websites. Find the perfect fit! Explore your options and tailor your choices to your unique needs and preferences.
Excel is a trusty workhorse for data wrangling. However, it has its limits when it comes to creating charts, like the elusive Waterfall chart. We’ve all danced around its quirks wrestling with stubborn data and battling chart formatting woes. Sometimes, we feel the urge to send it on a vacation somewhere far, far away.
But fear not, for salvation is at hand. Say hello to ChartExpo, the add-in that’ll make your charts dance joyfully. ChartExpo transcends those Excel limitations, crafting charts that make data look like a million bucks, including a stunning Funnel Chart on Mac.
ChartExpo charts are available both in Google Sheets and Microsoft Excel. Please use the following CTA’s to install the tool of your choice and create beautiful visualizations in a few clicks in your favorite tool.
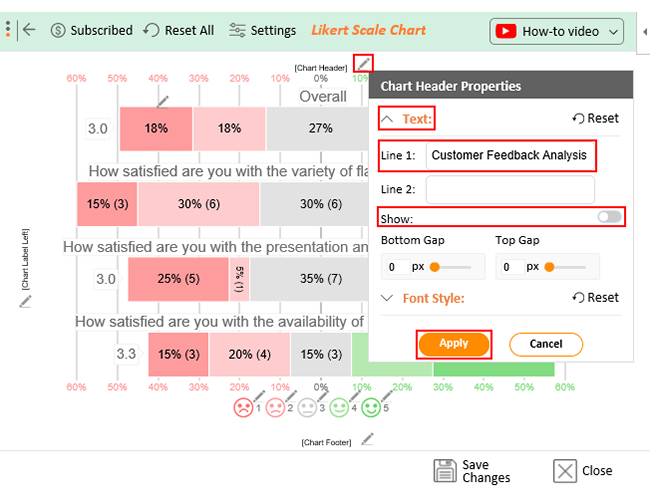
Let’s say you own an ice cream store. You have created a customer satisfaction survey with the following questions.
The responses below are embedded in each question:
Let’s say your survey yields the data table below.
| How satisfied are you with the variety of flavors available? | How satisfied are you with the presentation and appearance of ice cream products? | How satisfied are you with the availability of our ice cream in local stores or outlets? |
| Satisfied | Neutral | Neutral |
| Dissatisfied | Extremely Satisfied | Dissatisfied |
| Dissatisfied | Extremely Dissatisfied | Satisfied |
| Dissatisfied | Neutral | Satisfied |
| Neutral | Satisfied | Dissatisfied |
| Neutral | Extremely Dissatisfied | Neutral |
| Satisfied | Extremely Satisfied | Satisfied |
| Neutral | Neutral | Neutral |
| Dissatisfied | Neutral | Extremely Satisfied |
| Dissatisfied | Extremely Satisfied | Extremely Dissatisfied |
| Extremely Dissatisfied | Extremely Dissatisfied | Extremely Dissatisfied |
| Neutral | Extremely Dissatisfied | Dissatisfied |
| Dissatisfied | Neutral | Dissatisfied |
| Neutral | Satisfied | Extremely Dissatisfied |
| Satisfied | Dissatisfied | Satisfied |
| Extremely Dissatisfied | Neutral | Extremely Satisfied |
| Extremely Satisfied | Extremely Dissatisfied | Extremely Satisfied |
| Satisfied | Satisfied | Extremely Satisfied |
| Extremely Dissatisfied | Neutral | Extremely Satisfied |
| Neutral | Satisfied | Extremely Satisfied |
This table contains example data. Expect many responses and questions in real life.


Add-ins for Excel Mac provide a range of benefits and functionalities. These functionalities enhance productivity, improve data analysis, and enable Mac users to work efficiently within the Excel environment:
Yes, you can create custom Add-Ins for Excel on Mac. Microsoft provides tools like Office Add-ins for building custom functionality and integrating it into Excel’s interface. This enhances its capabilities to suit your specific needs.
To troubleshoot Excel add-in issues on Mac:
Excel add-ins can be secure, but it depends on the source. Trusted sources are safer. Compatibility with Mac OS varies; some add-ins may have limitations or require specific Excel versions. Therefore, it’s essential to verify compatibility before installation.
Excel’s native charting capabilities, while functional, have their limitations. Add-ins for Excel Mac swoop in as the heroes, offering solutions to Excel’s charting shortcomings. They bring flexibility, efficiency, and creativity to the table, enabling us to craft data-driven narratives like never before.
This guide has illuminated the path to harnessing their power, focusing on ChartExpo.
We’ve explored how ChartExpo’s diverse visualizations simplify data analysis. It provides a visual feast that caters to your data’s preferences. Its intuitive interface ensures that crafting insightful charts doesn’t require a coding boot camp.
However, while Excel add-ins for Mac bring immense benefits, ensuring their security and compatibility remains essential. Always source add-ins from reputable providers and confirm they align with your Mac’s specifications.
Conclusively, add-ins for Excel Mac make Excel on Mac a creative playground for data wizards and novices. Embrace this tool, troubleshoot any hiccups with diligence, and let your data shine like never before.
The world of data visualization is at your fingertips go forth and chart with flair!
How much did you enjoy this article?


Learn how to use sparklines in Excel to quickly visualize trends inside cells. Discover types, creation steps, customization, use cases, benefits, and best practices.

Learn what a confidence interval graph is, how to create it in Excel, and how to interpret results to make more reliable, data-driven decisions.

A correlation matrix in Excel helps identify relationships between variables. Learn how to create, read, and use it for effective data analysis.


