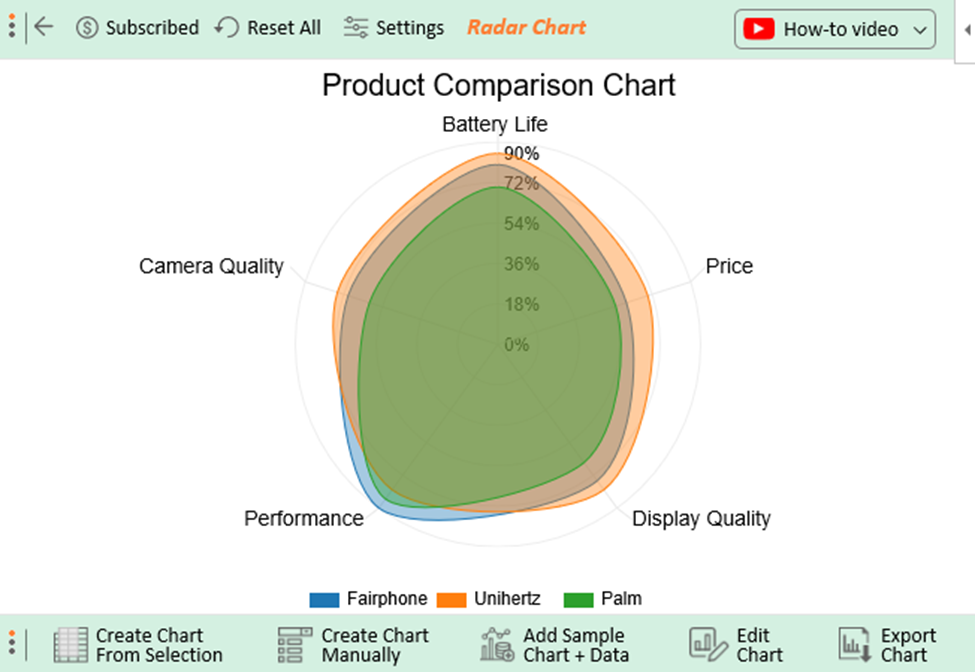
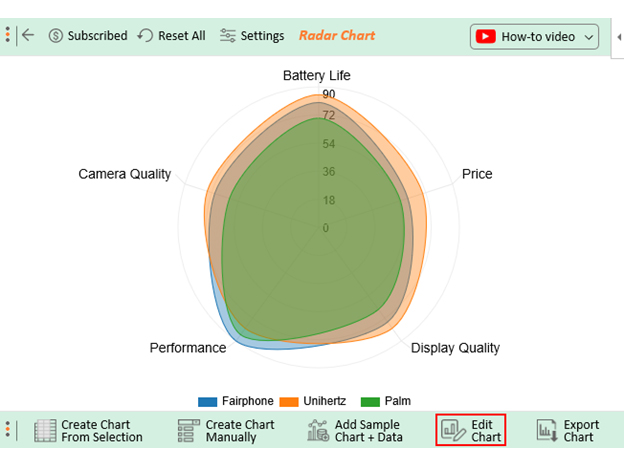
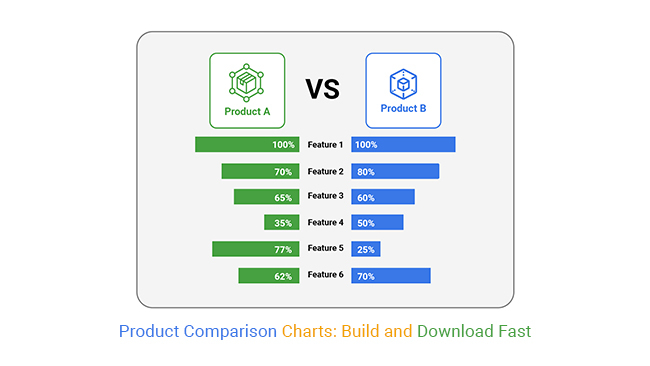
• Home
  • Tools dropdown img
    • Spreadsheet Charts

      • ChartExpo for Google Sheets
      • ChartExpo for Microsoft Excel
    • Power BI Charts

      • Power BI Custom Visuals by ChartExpo
    • Word Cloud

  • Charts dropdown img
    • Chart Category

      • Bar Charts
      • Circle Graphs
      • Column Charts
      • Combo Charts
      • Comparison Charts
      • Line Graphs
      • PPC Charts
      • Sentiment Analysis Charts
      • Survey Charts
    • Chart Type

      • Box and Whisker Plot
      • Clustered Bar Chart
      • Clustered Column Chart
      • Comparison Bar Chart
      • Control Chart
      • CSAT Survey Bar Chart
      • CSAT Survey Chart
      • Dot Plot Chart
      • Double Bar Graph
      • Funnel Chart
      • Gauge Chart
      • Likert Scale Chart
      • Matrix Chart
      • Multi Axis Line Chart
      • Overlapping Bar Chart
      • Pareto Chart
      • Radar Chart
      • Radial Bar Chart
      • Sankey Diagram
      • Scatter Plot Chart
      • Slope Chart
      • Sunburst Chart
      • Tornado Chart
      • Waterfall Chart
      • Word Cloud
    • Google Sheets
      Microsoft Excel
  • Services
  • Pricing
  • Contact us
  • Blog
  • Support dropdown img
      • Gallery
      • Videos
      • Contact us
      • FAQs
      • Resources
    • Please feel free to contact us

      atsupport@chartexpo.com

Categories
All Data Visualizations Data Analytics Surveys
Add-ons/
  • Google Sheets
  • Microsoft Excel
  • Power BI
All Data Visualizations Data Analytics Surveys
Add-ons
  • Google Sheets
  • Microsoft Excel
  • Power BI

We use cookies

This website uses cookies to provide better user experience and user's session management.
By continuing visiting this website you consent the use of these cookies.

Ok

ChartExpo Survey


Home > Blog > Microsoft Excel

The Power of Product Comparison Charts Unveiled

Imagine this: You’re standing at the crossroads of choice, torn between two products. One promises the moon, while the other whispers sweet savings.

How do you decide between them?

Enter the Product Comparison Charts.

Product Comparison Charts

Product comparison charts are like superheroes in the world of data analysis. They possess the power to transform numbers into visual masterpieces that even the most mathematically challenged can understand.

How do you unlock the secrets hidden within these colorful grids of information?

That’s where the real adventure begins.

Excel, our technological Merlin, has brewed a potent potion to decipher these charts.

What’s that? Is it a trend? A pattern? Ah, yes! You spot a sudden surge in sales for Product A while poor Product B languishes in the shadows.

The plot thickens. Your analytical prowess is tested as you dig deeper, searching for clues in the rows and columns.

With each click, you begin to see the bigger picture. The chart comes alive, whispering its secrets to you. You uncover the strengths and weaknesses of each product, ready to present your findings to the world.

Let’s scale the peaks of information overload and conquer the valleys of confusion.

Table of Contents:

  1. What are Product Comparison Charts?
  2. Why Do We Need Product Comparison Charts?
  3. Role For Business
  4. Visualize Data in Product Comparison Charts
  5. Wrap Up

What are Product Comparison Charts?

Product comparison charts are visual tools that simplify comparing various products or items. They use columns and rows to display essential information like features, prices, and specifications side by side.

Most importantly, these charts highlight product differences and similarities. As a result, they make it easier to choose the one that best suits specific needs and preferences. Here are some charts that can assist you.

  1. Comparison Bar Chart

A Comparison Bar Chart is an effective data visualization tool for comparing multiple variables in a single chart. It displays the relative size of various dataset categories or objects.

The chart consists of bars adjacent to one another that indicate distinct categories or item sizes, such as the cost of living comparison by city. The bars’ color and shape illuminate the differences between the items or categories.

Example

Comparison Bar Chart ce442
  1. Radar Chart

A Radar Chart, also called a Spider or Web Chart, is a graphical representation that displays multivariate data in a two-dimensional format. It uses radii extending from a central point to represent different variables, allowing for a visual comparison of data points and patterns across categories. It’s particularly useful for highlighting strengths and weaknesses.

Example

Radar Chart ce442
  1. Slope Chart

A Slope Chart visualizes the change in values between two points for multiple categories or items. It consists of lines connecting the data points, emphasizing the slope or trend. It’s effective for showcasing comparisons and trends, particularly in scenarios where the starting and ending points are crucial for understanding the data.

Example

Slop Chart ce442
  1. Multi-Axis Line Chart

The Multi-Axis Line Chart takes it up a notch for the data-hungry. It accommodates multiple Y-axes on the same X-axis, each with its own scale. This is useful when you’re dealing with data sets that have vastly different units of measurement. However, using this chart type judiciously is essential, as too many axes can lead to cluttered visuals.

Example

Multi-Axis Lines Chart ce442
  1. Matrix Chart

A Matrix Graph (one of the year-over-year comparison charts) can help you identify the presence and strengths of relationships between two or more lists of items. Besides, it provides a compact way of representing many-to-many relationships of varying strengths.

Example

Matrix Chart ce442
  1. Pareto Chart

A Pareto Chart is a graphical tool that combines both bar and line charts to display and prioritize factors contributing to a specific issue. It arranges categories from the most significant to the least, assisting in identifying the vital few factors that account for the majority of the observed effects.

Example

Pareto Chart ce442
  1. Treemap

A Treemap is a visual representation of hierarchical data using nested rectangles. Each branch of the hierarchy is represented by a colored rectangle, with the size proportional to the data it represents. This chart provides a clear and space-efficient way to display hierarchical structures and relative quantities within them.

Example

Treemap Chart ce442
  1. Double Bar Graph

Use a Double Bar Graph to compare two varying variables in data. The chart uses two axes to illustrate the relationships between two variables with different magnitudes and scales of measurement. You can use a double-bar graph maker to generate charts with plenty of information using limited space. This means you can uncover hidden insights, such as trends and patterns, easily.

Example

Double Bar Chart ce442
  1. Tornado Chart

Tornado Charts are a bar graph visualization that orders data from largest to smallest. This creates the signature look of the Tornado Chart.

Tornado Chart is also known as a Butterfly Chart. Analyzing a Tornado Chart can expand your understanding of the items with the highest and lowest magnitudes.

These insights enable you to prioritize resources and optimize your strategies to achieve the best possible results.

Example

Tornado Chart ce442
  1. Progress Bar Chart

A Progress Chart is a graph that displays the progress made toward a particular goal. The visualization design allows you to monitor and prioritize your objectives by providing critical data for strategic decision-making.

Example

Progress Chart ce442

Why Do We Need Product Comparison Charts?

In a world of endless choices, the need to create a Comparison Chart becomes as clear as day. It’s like having a shopping guru whispering in your ear, helping you make decisions and avoid buyer’s remorse.

How?

  1. Simplifying decision-making: When confronted with a multitude of product options, making a choice can be overwhelming. A price comparison template paired with Product Comparison Charts excels at distilling complex information into an easy-to-digest format, simplifying the process of identifying the most suitable product.
  2. Visual clarity: Humans are inherently visual beings. Charts present data in a graphical form, making it easier to grasp and remember while mitigating the risk of information overload. Visual elements like colors, icons, and bars help to spot differences and similarities between products quickly.
  3. Efficiency: Time is valuable, especially when shopping online or conducting research. A Product Comparison Graph allows you to review multiple products at once efficiently. Consequently, this saves the time and effort to sift through individual product descriptions.
  4. Objective assessment: Product Comparison Charts offer a factual foundation for evaluation, eliminating the need to rely solely on marketing claims or biased reviews. The data presented in these Product Comparison Charts empowers you to make informed decisions based on your priorities and preferences.
  5. Transparency: Transparency plays a crucial role in building trust. Product Comparison Charts are typically constructed based on verifiable data, enhancing the credibility of the information. This transparency fosters confidence in the decision-making process.

What is the Role of Product Comparison Charts for Business?

Product comparison charts play a crucial role in various aspects of business operations and strategies:

  1. Product presentations: When confronted with a myriad of product choices, deciding can be daunting. Product Comparison Charts excel at condensing intricate details into a digestible format, streamlining the process of pinpointing the most suitable product.
  2. Highlighting competitive advantages: Product Comparison Charts empower you to highlight the distinctive features and benefits of your products, distinguishing you from competitors.
  3. Informed decision-making: Product Comparison Charts streamline informed decision-making for both B2B and B2C customers. How? By presenting product specifications, prices, and other pertinent details in a clear, side-by-side chart format.
  4. Feedback analysis: You can analyze customer feedback and reviews to update your comparison charts, address common concerns, and improve products.
  5. Identifying market trends: Regularly updating comparison charts helps to identify emerging trends and customer preferences. As a result, this empowers you to adapt your product offerings accordingly.
  6. Benchmarking: Product Comparison Charts empower you to benchmark your products against industry standards, assisting you in establishing performance and quality targets.
  7. Answering customer queries: Customer service teams often use comparison charts to address customer queries and provide quick, accurate information.
  8. Online shopping: In e-commerce, Product Comparison Charts play a pivotal role in aiding online shoppers to compare products, contributing to heightened customer satisfaction and decreased churn rates.
  9. Inventory management: Businesses use product comparison data to manage inventory effectively. Consequently, this ensures that popular products are well-stocked while phasing out less competitive ones.
  10. Pricing strategies: Examining competitor pricing through Product Comparison Charts aids in fine-tuning pricing strategies to stay competitive while ensuring profitability.
  11. Identifying gaps: Product Comparison Charts can uncover gaps in a product lineup, prompting the development of new products or services to fill those voids.
  12. Brand image: Ensuring the accuracy and currency of Product Comparison Charts contributes to a positive brand image. It demonstrates that your business is transparent and committed to assisting customers in making informed choices.

How to Visualize Data in Product Comparison Charts?

Excel is the trusty workhorse of spreadsheets and data analysis. However, when it comes to visualizing data, it’s like asking a potato to tap dance.

Sure, it can crunch numbers with the best of them, but turning those digits into dazzling visuals? It’s not exactly its forte.

Fear not; ChartExpo is here to rescue you from the land of Excel’s limitations. ChartExpo transforms those mundane spreadsheets into interactive, eye-catching wonders.

Let’s learn how to Install ChartExpo in Excel.

  1. Open your Excel application.
  2. Open the worksheet and click the “Insert” menu.
  3. You’ll see the “My Apps” option.
  4. In the office Add-ins window, click “Store” and search for ChartExpo on my Apps Store.
  5. Click the “Add” button to install ChartExpo in your Excel.

ChartExpo charts are available both in Google Sheets and Microsoft Excel. Please use the following CTA’s to install the tool of your choice and create beautiful visualizations in a few clicks in your favorite tool.

Example

Imagine you’re in the hot seat, scrutinizing three tech titans: Fairphone, Unihertz, and Palm. Your mission? To pit them against each other, armed with a quintet of mobile features: Battery Life, Camera Quality, Performance, Display Quality, and Price.

Features Fairphone Unihertz Palm
Battery Life 80 85 70
Camera Quality 70 75 60
Performance 90 80 85
Display Quality 75 80 65
Price 60 70 55

Follow the steps below to learn how to create a Feature Comparison Chart in Excel with ChartExpo.

  • To get started with ChartExpo, install ChartExpo in Excel.
  • Now Click on My Apps from the INSERT menu.
insert chartexpo in excel
  • Choose ChartExpo from My Apps, then click Insert.
open chartexpo in excel
  • Once it loads, choose the “Radar Chart” from the charts list.
search radar chart in excel
  • Click the “Create Chart From Selection” button after selecting the data from the sheet, as shown.
Create Chart From Selection ce442
  • ChartExpo will generate the visualization below for you.
Product Comparison Charts
  • If you want to have the chart’s title, click Edit Chart, as shown in the above image.
  • Click the pencil icon next to the Chart Header to change the title.
  • It will open the properties dialog. Under the Text section, you can add a heading in Line 1 and enable Show.
  • Give the appropriate title of your chart and click the Apply button.
  • Click the “Save Changes” button to persist the changes.
apply title on chart ce442
  • Let’s add the Postfix (e.g., % sign) in the chart.
  • Click the highlighted pencil icon. Expand the “Label” properties to add the Postfix value (e.g., % sign) and click the “Apply” button.
  • Click the “Save Changes” button to persist the changes.
apply label on chart ce442
  • Your final chart will appear below.
Final Product Comparison Charts

Insights

  • Battery Life

Unihertz stands out with the highest rating of 85%. It offers the best battery performance among the three brands. Fairphone and Palm, on the other hand, have respectable battery life ratings, although slightly lower than Unihertz.

  • Camera Quality

Unihertz boasts the highest camera quality rating of 75%, indicating superior camera performance compared to the other two brands. Fairphone and Palm, on the other hand, have slightly lower ratings than Unihertz.

    • Performance
    • Fairphone is rated highest in terms of performance, with a score of 90%. This suggests it has the best overall performance compared to the other two brands.
    • Palm also boasts a relatively high-performance rating, while Unihertz falls behind.
  • Display Quality

Unihertz boasts the highest display quality rating at 80%, indicating a superior display experience compared to the other two brands. On the other hand, Fairphone and Palm have slightly lower ratings for display quality.

  • Price

Unihertz has a price rating of 70%, making it the most expensive brand among the three. Conversely, Fairphone and Palm have lower price ratings in comparison.

Best Practices for Product Comparison Chart

Master the art of crafting product comparison charts. Here are the best practices for different industries and needs.

  • Clarity and Simplicity

    • Keep the chart simple and easy to understand. Avoid clutter and present information in a clear, organized manner.
    • Use concise and straightforward language. Make sure users can quickly grasp the key differences between products.
  • Relevant Features and Criteria

    • Prioritize like a pro! Focus on features that directly impact your target audience’s needs and preferences. Leave the fluff behind.
  • Consistent Structure

    • Maintain a consistent structure throughout the chart. Arrange features and criteria in a logical order, making it easy for users to compare across products.
    • Use a uniform format for product names, specifications, and other details.
  • Visual Appeal

    • Use clear headings, color-coding, and icons to guide users. Highlight strengths and weaknesses with graphs or icons for quick comparisons.
  • Mobile-Friendly Design

    • Ensure that the comparison chart is optimized for both desktop and mobile devices. Many users access information on the go, so a responsive design is crucial.

FAQs

What is a Product Comparison Chart?

A Product Comparison Chart is a visual tool displaying key information about multiple products side by side. It helps to quickly compare features, specifications, and prices to make informed decisions when selecting a product.

How to make a Product Comparison Chart?

  1. Select a spreadsheet tool like Excel.
  2. List products in rows and attributes in columns.
  3. Fill in data for each product.
  4. Use visual aids like color coding or icons.
  5. Create graphs for better visualization.
  6. Update as needed for accuracy.

How to do a comparison of two products?

  1. List the two products side by side.
  2. Identify key attributes and criteria for comparison.
  3. Assign scores or ratings to each product for each criterion.
  4. Sum up scores to determine the winner.
  5. Consider subjective factors like brand reputation and personal preferences, if applicable.

Wrap Up

Product comparison charts emerge as indispensable guides in the labyrinth of choices that define our consumer-driven world. Despite its limitations, Excel serves as a trusty companion in this journey.

This exploration taught us that these charts are not mere data tables. Rather, they are tools that simplify the complex, provide visual clarity, and enhance efficiency. They promote informed decisions, contribute to transparency, and ultimately empower customers.

Yet, the story doesn’t end here. The birth of ChartExpo heralds a new chapter, one where data analysis transcends Excel’s constraints. Its plethora of visualizations, intuitive interface, and customization options redefines how we perceive and present data.

What have we learned?

The power of clarity, efficiency, and objectivity in decision-making cannot be overstated. Product comparison charts offer these in abundance.

Whether seeking a smartphone, strategizing in business, or life organization, Excel and ChartExpo are your trusted allies. Armed with these tools, you stand not as a data explorer. Rather, as a data conqueror, ready to face the myriad choices of the modern world.

Harness the potential of your data like never before. Explore ChartExpo’s features and watch your insights shine.

How much did you enjoy this article?

ExcelAd2
Start Free Trial!
129721

Related articles

next previous
Microsoft Excel10 min read

Invoice Tracker Template in Excel for Better Insights

An invoice tracker Excel template helps track invoices, due dates, and payments. Learn how to use this template for better financial management.

Microsoft Excel12 min read

Key Performance Indicators in Healthcare for Better Insights

Key Performance Indicators in healthcare track patient care and efficiency. Learn about these KPIs, top examples, and how to use them to improve outcomes.

Microsoft Excel10 min read

BMI Calculation Formula in Excel for Better Fitness Insights

The BMI calculation formula in Excel helps track and analyze body mass index. Explore step-by-step instructions and tips to simplify BMI tracking in Excel.

Microsoft Excel29 min read

How to Create a Tornado Chart in Excel? A Complete Guide

Click to learn how to plot a Tornado Chart in Excel using easy-to-follow steps. Also, we’ll address the following question: what is a Tornado Diagram?

Microsoft Excel14 min read

How to Create a Scatter Plot in Excel with 3 Variables?

Click to discover how to create a Scatter Plot in Excel with 3 variables. We’ll also address the following question: why do we use Scatter Plot Graph?

ChartExpo logo

Turn Data into Visual
Stories

CHARTEXPO

  • Home
  • Gallery
  • Videos
  • Services
  • Pricing
  • Contact us
  • FAQs
  • Privacy policy
  • Terms of Service
  • Sitemap

TOOLS

  • ChartExpo for Google Sheets
  • ChartExpo for Microsoft Excel
  • Power BI Custom Visuals by ChartExpo
  • Word Cloud

CATEGORIES

  • Bar Charts
  • Circle Graphs
  • Column Charts
  • Combo Charts
  • Comparison Charts
  • Line Graphs
  • PPC Charts
  • Sentiment Analysis Charts
  • Survey Charts

TOP CHARTS

  • Sankey Diagram
  • Likert Scale Chart
  • Comparison Bar Chart
  • Pareto Chart
  • Funnel Chart
  • Gauge Chart
  • Radar Chart
  • Radial Bar Chart
  • Sunburst Chart
  • see more
  • Scatter Plot Chart
  • CSAT Survey Bar Chart
  • CSAT Survey Chart
  • Dot Plot Chart
  • Double Bar Graph
  • Matrix Chart
  • Multi Axis Line Chart
  • Overlapping Bar Chart
  • Control Chart
  • Slope Chart
  • Clustered Bar Chart
  • Clustered Column Chart
  • Box and Whisker Plot
  • Tornado Chart
  • Waterfall Chart
  • Word Cloud
  • see less

RESOURCES

  • Blog
  • Resources
  • YouTube
SIGN UP FOR UPDATES

We wouldn't dream of spamming you or selling your info.

© 2025 ChartExpo, all rights reserved.