• Home
  • Tools dropdown img
    • Spreadsheet Charts

      • ChartExpo for Google Sheets
      • ChartExpo for Microsoft Excel
    • Power BI Charts

      • Power BI Custom Visuals by ChartExpo
    • Word Cloud

  • Charts dropdown img
    • Chart Category

      • Bar Charts
      • Circle Graphs
      • Column Charts
      • Combo Charts
      • Comparison Charts
      • Line Graphs
      • PPC Charts
      • Sentiment Analysis Charts
      • Survey Charts
    • Chart Type

      • Box and Whisker Plot
      • Clustered Bar Chart
      • Clustered Column Chart
      • Comparison Bar Chart
      • Control Chart
      • CSAT Survey Bar Chart
      • CSAT Survey Chart
      • Dot Plot Chart
      • Double Bar Graph
      • Funnel Chart
      • Gauge Chart
      • Likert Scale Chart
      • Matrix Chart
      • Multi Axis Line Chart
      • Overlapping Bar Chart
      • Pareto Chart
      • Radar Chart
      • Radial Bar Chart
      • Sankey Diagram
      • Scatter Plot Chart
      • Slope Chart
      • Sunburst Chart
      • Tornado Chart
      • Waterfall Chart
      • Word Cloud
    • Google Sheets
      Microsoft Excel
  • Services
  • Pricing
  • Contact us
  • Blog
  • Support dropdown img
      • Gallery
      • Videos
      • Contact us
      • FAQs
      • Resources
    • Please feel free to contact us

      atsupport@chartexpo.com

Categories
All Data Visualizations Data Analytics Surveys
Add-ons/
  • Google Sheets
  • Microsoft Excel
  • Power BI
All Data Visualizations Data Analytics Surveys
Add-ons
  • Google Sheets
  • Microsoft Excel
  • Power BI

We use cookies

This website uses cookies to provide better user experience and user's session management.
By continuing visiting this website you consent the use of these cookies.

Ok

ChartExpo Survey


Home > Blog > Power BI

Power BI vs. SSRS: Exploring Key Differences

So, you’re curious about the difference between Power BI vs. SSRS, huh?

You’ve come to the right place.

We’ll break it down for you in a way that’s as clear as crystal.

Power BI vs. SSRS

Power BI and SSRS are like two siblings from different mothers. They may look similar, but boy, they have their quirks. Power BI is the hipster of the family, all cool and flashy with its interactive dashboards and snazzy visualizations. It’s all about real-time data analysis and sharing insights on the go.

On the other hand, SSRS is more old-school. It has been around since your dad was sipping Tang in the ’90s. It focuses on pixel-perfect printed reports and delivers them to your email inbox like a diligent postal worker.

Still confused?

Think of Power BI as that trendy coffee shop where you can hang out with your MacBook Air. SSRS is your grandpa’s cozy reading nook by the fireplace. They both serve a purpose; it depends on whether you’re sipping lattes or savoring leather-bound books.

But this is just the tip of the iceberg. Let’s hop onto the Power BI vs. SSRS bandwagon and decode the intricacies of these two formidable tools.

Table of Contents:

  1. Power BI vs. SSRS: Definitions
    1. What is SSRS?
    2. What is Power BI?
  2. SSRS Vs Power BI: Detailed Explanation
  3. Power BI vs. SSRS: Key Differences
  4. Power BI vs. SSRS: Key Similarities
  5. Why is Power BI Better than SSRS?
  6. Steps to Build Visuals in Power BI
  7. SSRS vs. Power BI: Which Should You Choose 
  8. SSRS vs. Power BI: Pros And Cons
  9. Wrap Up

First”¦

Power BI vs. SSRS: Definitions

Here are the definitions for Power BI vs. SSRS.

What is SSRS?

Definition: SQL Server Reporting Services, commonly known as SSRS, is a robust reporting tool developed by Microsoft. Its primary function revolves around generating and delivering interactive and paginated reports.

The essence of SSRS lies in its seamless integration with the Microsoft SQL Server. This enables you to extract valuable insights from your relational databases.

SSRS focuses on traditional reporting. It excels in producing paginated reports – a staple in structured, printable documents. This tool empowers you to design, deploy, and manage reports efficiently, catering to diverse reporting needs.

What is Power BI?

Definition: Power BI, a dynamic business intelligence tool from Microsoft, revolutionizes data analysis and visualization. At its core, Power BI transforms raw data into compelling insights through interactive dashboards and reports. As a cloud-based service, it connects seamlessly with various data sources, empowering you to glean real-time analytics. Moreover, its user-friendly interface makes it accessible to technical and non-technical users.

Power BI’s strength lies in its ability to integrate with many data types and formats. This promotes a comprehensive approach to analytics. With features like natural language queries and AI-driven insights, using Power BI on Mac facilitates data exploration and interpretation. In essence, Power BI transcends conventional reporting. It provides a versatile and intuitive solution for businesses seeking to harness the full potential of their data.

SSRS Vs Power BI: Detailed Explanation

1. Purpose:

  • SSRS: Primarily a server-based reporting tool designed for generating and managing reports in various formats (PDF, Excel, etc.). It excels in creating detailed, paginated reports for printing and distribution.
  • Power BI: A business analytics tool for interactive data visualization and business intelligence. It focuses on creating dynamic dashboards and reports with real-time data exploration and visualization capabilities.

2. Data Handling:

  • SSRS: Connects to various data sources, including SQL databases, and supports complex queries and report parameters. It is suited for operational reporting with fixed layouts.
  • Power BI: Connects to a wide range of data sources, including cloud services and APIs, and is optimized for data exploration. It uses DAX (Data Analysis Expressions) for complex calculations and interactive data analysis.

3. User Experience:

  • SSRS: Offers a more traditional reporting experience with static, paginated reports. It’s best for detailed, structured reporting needs.
  • Power BI: Provides a modern, interactive user experience with drag-and-drop capabilities, real-time data updates, and advanced visualizations.

4. Report Design:

  • SSRS: Report design is done through SQL Server Data Tools (SSDT) with a focus on precise formatting and layout. It’s ideal for pixel-perfect report design.
  • Power BI: Uses a user-friendly interface for designing interactive reports and dashboards with a focus on visual appeal and usability.

5. Deployment and Sharing:

  • SSRS: Reports are deployed to a report server, accessible through web browsers, and can be scheduled for automatic delivery. It’s suited for enterprise environments with extensive reporting requirements.
  • Power BI: Reports and dashboards are published to the Power BI service, allowing for sharing and collaboration through workspaces. It supports mobile access and integration with other Microsoft services.

Power BI vs. SSRS: Key Differences

Understanding Power BI vs. SSRS is crucial when picking the most fitting solution for your reporting needs. Let’s dissect the battlefield and explore the nuances that set these contenders apart.

  • Purpose and Focus

SSRS, born from the SQL Server lineage, primarily serves as a stalwart for traditional reporting. It excels in generating paginated reports, providing a structured and printable format. Conversely, Power BI is a modern business intelligence tool emphasizing dynamic data analysis and visualization. It promotes interactive dashboards and real-time insights.

  • Report Types

SSRS leans towards conventional paginated reports, which are ideal for structured and parameterized data. Power BI, on the other hand, thrives on interactive and visual reports, fostering an exploratory and user-friendly approach.

  • Data Visualization

Power BI takes the lead in data visualization. It offers a rich array of charts, graphs, and interactive elements, enhancing the storytelling aspect of data. SSRS, while competent, aligns more with traditional, static representations.

  • Integration

SSRS tightly integrates with SQL Server, making it a go-to choice for organizations deeply rooted in Microsoft’s ecosystem. Power BI, however, embraces a broader spectrum, seamlessly connecting with diverse data sources, both on-premises and in the cloud.

  • Deployment

SSRS predominantly operates on-premises, while Power BI, with its cloud-centric approach, allows for flexible deployment options. This dichotomy caters to varied organizational preferences and IT infrastructures.

  • User Accessibility

Power BI stands out with its user-friendly interface, intuitive features, and accessibility to technical and non-technical users. SSRS, though robust, may demand a steeper learning curve, particularly for those unfamiliar with SQL Server reporting tools.

Power BI vs. SSRS: Key Similarities

Report Creation:

Both tools enable users to create detailed reports and visualizations. While Power BI focuses on interactive dashboards and leverages AI for data analytics, SSRS provides comprehensive, paginated reports.

Security:

Both Power BI and SSRS offer robust security features to control user access and data protection. They integrate with Active Directory for user authentication and can manage permissions at various levels.

Scheduling and Automation:

Both platforms support scheduling and automation. SSRS allows scheduling of report generation and delivery, while Power BI enables automated data refreshes and report updates.

Microsoft Ecosystem Integration:

Both tools integrate seamlessly with other Microsoft products. Power BI integrates with tools like Excel and SharePoint, while SSRS integrates with SQL Server and other Microsoft data tools.

Customizable Reporting:

Both Power BI and SSRS allow for the customization of reports and dashboards, though Power BI offers more advanced interactive and visual customization options.

Why is Power BI Better than SSRS?

In the realm of Power BI vs. SSRS, Power BI emerges as the trailblazer, showcasing strengths that surpass its counterpart, SSRS. Let’s delve into the features that establish it as the superior option.

  • Interactive Visualizations

Power BI steals the spotlight with its captivating array of interactive visualizations. From dynamic charts to drill-down features, it transforms data into a visual masterpiece. This provides a more engaging and insightful reporting experience compared to the static nature of SSRS.

  • User-Friendly Interface

In the discussion of Power BI vs. SSRS, Power BI’s user-friendly interface is a notable advantage. Its intuitive design and drag-and-drop functionality facilitate easy navigation for both technical and non-technical users. Conversely, SSRS, while robust, requires users to overcome a steeper learning curve.

  • Cloud Integration

We are living in a digital era dominated by cloud solutions. Power BI embraces this trend, offering flexibility, scalability, and accessibility from anywhere. SSRS, rooted in on-premises environments, may falter in the face of evolving deployment preferences.

  • Broader Data Source Connectivity

The power of data lies in its diversity. Power BI recognizes this by providing a broader spectrum of data source connectivity. It doesn’t matter whether it’s on-premises databases or cloud services. Power BI effortlessly integrates, offering a more expansive reach than SSRS’s SQL Server-centric nature.

  • Real-Time Data Exploration

For organizations craving real-time insights, Power BI stands as the undisputed champion. Its real-time exploration and analysis of data empowers decision-makers to stay ahead of the curve. SSRS, designed for more static reporting, may lag in the era of instant data gratification.

  • Community and Updates

When evaluating Power BI vs. SSRS, the strength of community support and updates plays a pivotal role, especially in pivot reporting. Power BI excels in this regard, boasting an active community and regular updates that introduce innovative features and improvements for pivot reporting. In contrast, while SSRS remains steadfast, it may not match the dynamic evolution seen in Power BI’s pivot reporting capabilities.

Steps to Build Visuals in Power BI

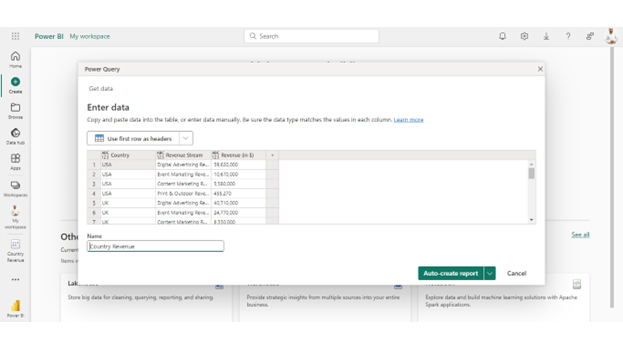
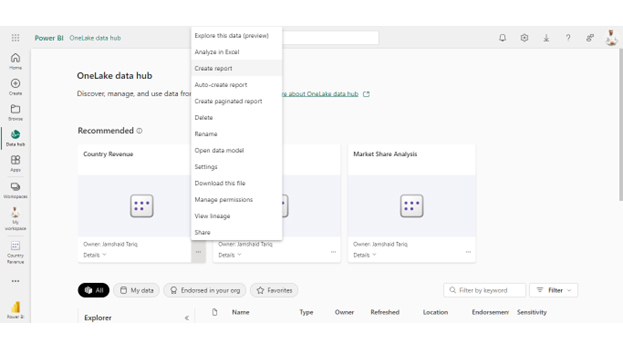
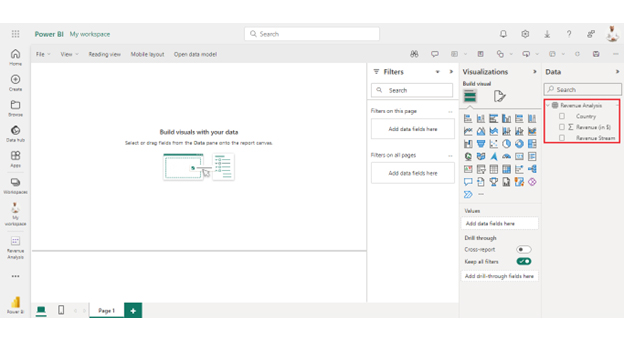
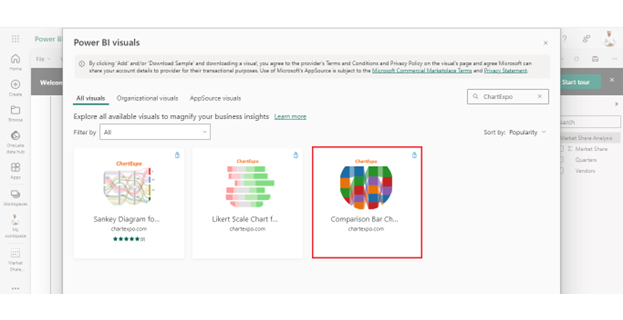
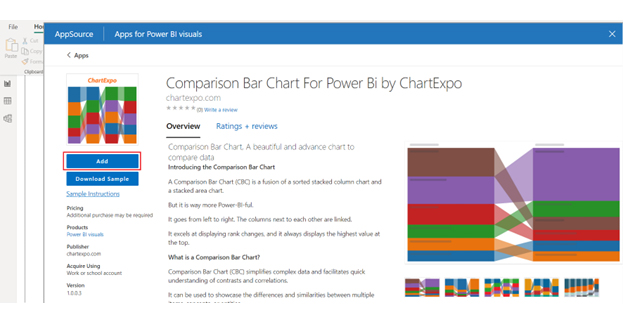
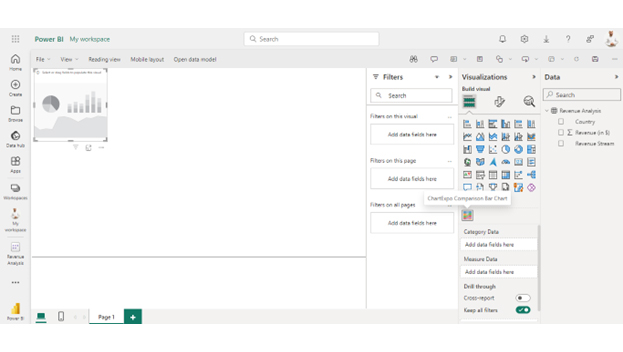
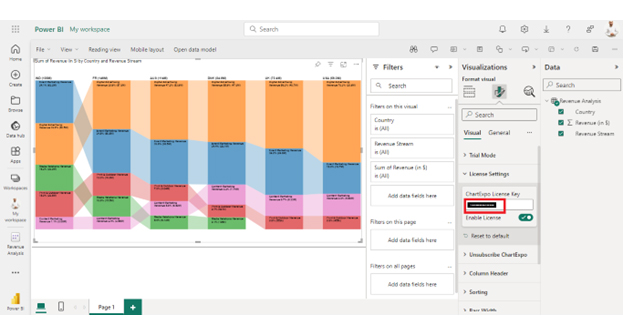
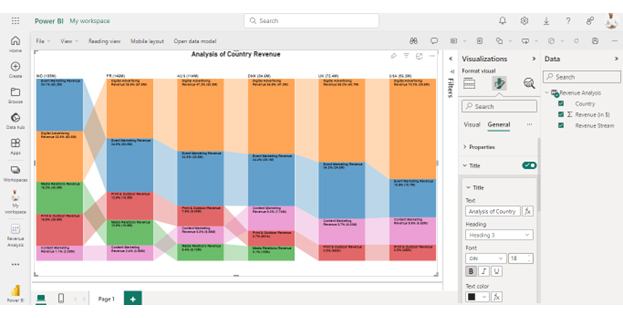
When it comes to choosing between Power BI vs. SSRS, Power BI emerges as the preferred tool. Follow these steps to leverage Power BI’s robust features, including the Sankey Diagram, for effective data visualization.

Stage 1: Logging in to Power BI

  1. Log in to Power BI.
  2. Enter your email address and click the “Submit” button.
Enter email to login to Power BI
  • You are redirected to your Microsoft account.
  • Enter your password and click “Sign in“.
Enter Password to login to Power BI
  • You can choose whether to stay signed in.
Click on stay signed in
  • Once done, the Power BI home screen will open.

Stage 2: Creating a Data Set and Selecting the Data Set to Use in Your Chart

  • Go to the left-side menu and click the “Create” button.
  • Select “Paste or manually enter data“.
select Paste or manually enter data in Power BI ce487
  • We’ll use the sample data below for this example.
Country Revenue Stream Revenue  (in $)
USA Digital Advertising Revenue           39,620,000
USA Event Marketing Revenue           10,670,000
USA Content Marketing Revenue             5,580,000
USA Print & Outdoor Revenue                 455,270
UK Digital Advertising Revenue           40,710,000
UK Event Marketing Revenue           24,770,000
UK Content Marketing Revenue             6,330,000
UK Print & Outdoor Revenue                 552,190
DNK Digital Advertising Revenue           47,040,000
DNK Event Marketing Revenue           29,070,000
DNK Content Marketing Revenue             7,740,000
DNK Print & Outdoor Revenue                 600,690
DNK Media Relations Revenue                 106,430
AUS Digital Advertising Revenue           53,790,000
AUS Event Marketing Revenue           38,530,000
AUS Content Marketing Revenue             6,590,000
AUS Print & Outdoor Revenue             9,040,000
AUS Media Relations Revenue             6,130,000
FR Digital Advertising Revenue           57,860,000
FR Event Marketing Revenue           50,450,000
FR Content Marketing Revenue             3,560,000
FR Print & Outdoor Revenue           18,790,000
FR Media Relations Revenue           15,460,000
IND Digital Advertising Revenue           60,470,000
IND Event Marketing Revenue           63,200,000
IND Content Marketing Revenue             2,080,000
IND Print & Outdoor Revenue           29,500,000
IND Media Relations Revenue           30,020,000
  • Paste the above data table in the Power Query Window.
  • Select the “Create a dataset only” option.
Create a dataset ce504
  • On the left-side menu, click “Data Hub“.
  • Power BI populates the data set list. (If you have not created a data set, refer to the Error! Reference source not found section).
  • Click on the “Create a report” dropdown.
Create a report ce504
  • Click the “Expand All” button.
  • You can see your chart metrics:
Click Expand All ce504
  • Click on “Get more visuals“.
  • Search for ChartExpo and select the Comparison Bar Chart:
Comparison Bar CHart for Power BI by ChartExpo ce487
  • Click the “Add” button.
Click Add Button ce523
  • You can now see the Comparison Bar Chart in the visualizations list.
Chart in the visualizations list ce504
  • In Visual, click License Settings, add the key, and enable the license.
  • After adding the key, you can see the comparison bar chart.
click License Settings ce504
  • The final Comparison Bar Chart in Power BI will appear as below.
Final Power BI vs. SSRS

SSRS vs. Power BI: Which Should You Choose

The choice between Power BI vs. SSRS is a critical crossroad in data reporting. Each tool has unique strengths, and the choice hinges on the specific needs and preferences. These considerations will guide you through this pivotal decision-making process.

  1. Purpose alignment: Begin by understanding your primary reporting goals. SSRS is a stalwart choice if traditional, paginated reports align with your needs. However, for a broader business intelligence approach with interactive dashboards, Power BI takes the lead.
  2. Reporting style: Consider the nature of your reports. If your emphasis is on pixel-perfect, structured documents for printing, SSRS excels. Conversely, if dynamic, visual reporting is the demand, Power BI’s array of charts and graphs steals the spotlight.
  3. Integration requirements: Assessing your current infrastructure is crucial in the comparison of Power BI vs. SSRS. If your organization’s backbone is built on Microsoft SQL Server, SSRS seamlessly integrates into this ecosystem. Conversely, if you prioritize cloud-based adaptability and the integration of various data sources, Power BI offers a clear edge.
  4. Deployment preferences: SSRS thrives in on-premises environments, which are ideal for organizations with established server architectures. Meanwhile, Power BI’s cloud-first approach offers scalability and accessibility from anywhere, aligning with modern deployment trends.
  5. User accessibility: When it comes to catering to the user base, Power BI vs. SSRS offers distinct advantages. Power BI appeals to a wider audience thanks to its intuitive interface and natural language query support. Conversely, SSRS, though robust, is more suitable for users already familiar with SQL Server environments.
  6. Cost considerations: Finally, weigh the cost factors. SSRS, often bundled with SQL Server licenses, might be cost-effective for on-premises deployments. Power BI offers scalability with its subscription-based model but requires a budget evaluation.

SSRS vs. Power BI: Pros And Cons

SSRS

Pros:

  1. Detailed Reports: Ideal for formatted, paginated reports.
  2. Complex Layouts: Supports advanced report formatting.
  3. Integration with SQL Server: Seamless with Microsoft SQL Server.

Cons:

  1. Static Reports: Limited interactivity and real-time capabilities.
  2. User Experience: Less intuitive design and interaction.
  3. Learning Curve: This can be complex to learn and set up.

Power BI

Pros:

  1. Interactive Dashboards: Dynamic and user-friendly visualizations.
  2. Real-Time Data: Supports live data updates.
  3. Integration: Works well with Microsoft tools and services.

Cons:

  1. Report Formatting: Less detailed formatting compared to SSRS.
  2. Performance: May struggle with very large datasets.
  3. Service Dependency: Some features require Power BI service licensing.

Insights

  • India leads in total revenue, with France, Australia, and Denmark following closely.
  • While “Digital Advertising” is a major revenue contributor in most countries, India stands out, with “Event Marketing” taking the lead.
  • “Media Relations” is not a revenue stream in the US or the UK.
  • France exhibits a lower contribution from content marketing compared to other revenue streams. Meanwhile, despite its overall high revenue, India has the lowest income from content marketing.

FAQs

Will Power BI replace SSRS?

Power BI’s dynamic capabilities and emphasis on modern analytics may reduce the prevalence of SSRS. However, with its established role in traditional reporting, SSRS might persist in certain scenarios. As a result, this creates a coexistence rather than a complete replacement.

Is Power BI the same as SSRS?

No, Power BI and SSRS serve distinct purposes. Power BI focuses on interactive visualizations and modern analytics. In contrast, SSRS excels in traditional, paginated reporting. While both are Microsoft offerings, they cater to different aspects of the reporting spectrum.

Can I use Power BI with SSRS?

While Power BI and SSRS are distinct tools, you can integrate them. Power BI Report Server allows hosting Power BI reports alongside SSRS reports. This integration provides a unified platform for traditional and modern reporting, catering to diverse analytical needs.

Wrap Up

The battle between Power BI and SSRS unfolds as a choice between tradition and innovation. Power BI’s allure lies in its dynamic visualizations, cloud integration, and real-time analytics. It ushers in a new era of interactive reporting.

On the other side stands SSRS, the stalwart guardian of paginated reports and SQL Server integration. It maintains its stronghold on conventional reporting structures.

The purpose-driven decision-making process hinges on organizational needs. For those seeking agility, accessibility, and diverse data connectivity, Power BI emerges as the avant-garde solution. Its user-friendly interface, vibrant community, and continuous updates showcase a commitment to staying at the forefront of the analytics landscape.

However, the saga doesn’t end with a victor and a vanquished. Instead, it forges a narrative of coexistence. Power BI and SSRS integration, facilitated by tools like Power BI Report Server, reflects a nuanced approach. You can harness their strengths to create a unified reporting ecosystem that spans traditional and modern analytics.

Conclusively, the choice between Power BI vs. SSRS isn’t a dichotomy. It’s a strategic alignment with the reporting philosophy that aligns best with the organization’s goals. Rest assured that whichever you choose will elevate your data reporting game.

How much did you enjoy this article?

PBIAd2
Start Free Trial!
133777

Related articles

next previous
Power BI12 min read

Power BI Group By Guide for Effective Data Insights

Learn how Power BI Group By helps you aggregate data, clarify trends, and create reports by grouping values to make large datasets manageable & insightful.

Power BI12 min read

How to Create Sankey Diagram in Microsoft Power BI?

Learn How to Create Sankey Diagram in Microsoft Power BI using Desktop & Web Service. What they are and how to use them effectively.

Power BI8 min read

Power BI Artificial Intelligence: Insights Using Visuals

Discover all there is to know about the Power BI artificial intelligence. You'll also discover how AI is used in Power BI, and how to use it for analysis and more.

Power BI9 min read

Budgeting in Healthcare: Use Visuals to Spot Budget Gaps

This guide helps you discover what budgeting in healthcare is. You'll also discover the factors that affect hospital budgets and types of budgeting in healthcare.

Power BI9 min read

Predictive Analytics in Power BI for Making Insightful Visuals

This guide shows you everything you need to know about Predictive Analytics in Power BI. It also shows you how it works, and how to interpret the results.

ChartExpo logo

Turn Data into Visual
Stories

CHARTEXPO

  • Home
  • Gallery
  • Videos
  • Services
  • Pricing
  • Contact us
  • FAQs
  • Privacy policy
  • Terms of Service
  • Sitemap

TOOLS

  • ChartExpo for Google Sheets
  • ChartExpo for Microsoft Excel
  • Power BI Custom Visuals by ChartExpo
  • Word Cloud

CATEGORIES

  • Bar Charts
  • Circle Graphs
  • Column Charts
  • Combo Charts
  • Comparison Charts
  • Line Graphs
  • PPC Charts
  • Sentiment Analysis Charts
  • Survey Charts

TOP CHARTS

  • Sankey Diagram
  • Likert Scale Chart
  • Comparison Bar Chart
  • Pareto Chart
  • Funnel Chart
  • Gauge Chart
  • Radar Chart
  • Radial Bar Chart
  • Sunburst Chart
  • see more
  • Scatter Plot Chart
  • CSAT Survey Bar Chart
  • CSAT Survey Chart
  • Dot Plot Chart
  • Double Bar Graph
  • Matrix Chart
  • Multi Axis Line Chart
  • Overlapping Bar Chart
  • Control Chart
  • Slope Chart
  • Clustered Bar Chart
  • Clustered Column Chart
  • Box and Whisker Plot
  • Tornado Chart
  • Waterfall Chart
  • Word Cloud
  • see less

RESOURCES

  • Blog
  • Resources
  • YouTube
SIGN UP FOR UPDATES

We wouldn't dream of spamming you or selling your info.

© 2025 ChartExpo, all rights reserved.