• Home
  • Tools dropdown img
    • Spreadsheet Charts

      • ChartExpo for Google Sheets
      • ChartExpo for Microsoft Excel
    • Power BI Charts

      • Power BI Custom Visuals by ChartExpo
    • Word Cloud

  • Charts dropdown img
    • Chart Category

      • Bar Charts
      • Circle Graphs
      • Column Charts
      • Combo Charts
      • Comparison Charts
      • Line Graphs
      • PPC Charts
      • Sentiment Analysis Charts
      • Survey Charts
    • Chart Type

      • Box and Whisker Plot
      • Clustered Bar Chart
      • Clustered Column Chart
      • Comparison Bar Chart
      • Control Chart
      • CSAT Survey Bar Chart
      • CSAT Survey Chart
      • Dot Plot Chart
      • Double Bar Graph
      • Funnel Chart
      • Gauge Chart
      • Likert Scale Chart
      • Matrix Chart
      • Multi Axis Line Chart
      • Overlapping Bar Chart
      • Pareto Chart
      • Radar Chart
      • Radial Bar Chart
      • Sankey Diagram
      • Scatter Plot Chart
      • Slope Chart
      • Sunburst Chart
      • Tornado Chart
      • Waterfall Chart
      • Word Cloud
    • Google Sheets
      Microsoft Excel
  • Services
  • Pricing
  • Contact us
  • Blog
  • Support dropdown img
      • Gallery
      • Videos
      • Contact us
      • FAQs
      • Resources
    • Please feel free to contact us

      atsupport@chartexpo.com

Categories
All Data Visualizations Data Analytics Surveys
Add-ons/
  • Google Sheets
  • Microsoft Excel
  • Power BI
All Data Visualizations Data Analytics Surveys
Add-ons
  • Google Sheets
  • Microsoft Excel
  • Power BI

We use cookies

This website uses cookies to provide better user experience and user's session management.
By continuing visiting this website you consent the use of these cookies.

Ok

ChartExpo Survey


Home > Blog > Power BI

Power BI Deployment Pipelines: Create and Manage

Power BI deployment pipelines sounds like a term from a sci-fi movie, right?

That’s not the case – it’s not some complex intergalactic technology. It’s much simpler than that.

Imagine this: you’ve spent hours analyzing data, creating beautiful visualizations, and crafting insightful reports using Power BI. Now, it’s time to share your masterpiece with the world. But how do you ensure a smooth and efficient deployment process?

Power BI Deployment Pipelines
 https://chartexpo.com/utmAction/MTYrYmxvZytwYitjZXhwbytQQkk1MDQrQ29tcGFyaXNvbis=

That’s where the Power BI deployment pipeline comes in.

Think of it as a well-oiled machine, churning out reports and dashboards with the flick of a switch. It takes your data and transforms it into beautiful visualizations. Then, it delivers it to the right people at the right time.

But it’s not just about speed and efficiency. The deployment pipeline ensures your data is secure and up-to-date. It integrates with your existing systems, making sure everything runs smoothly.

Say goodbye to the days of manual deployments and endless troubleshooting. The Power BI deployment pipeline is your ticket to data-driven success.

Table of Content:

  1. What are Power BI Deployment Pipelines?
  2. Why are Deployment Pipelines Important?
  3. Purpose of Deployment Pipeline in Power BI
  4. How Does the Deployment Pipeline Work?
  5. Stages of Power BI Deployment Pipeline
    1. Development
    2. Testing
    3. User Acceptance Testing (UAT)
    4. Staging
    5. Production
  6. How to Create a Deployment Pipeline Power BI: Step-by-Step
    1. Step 1: Creating Deployment Pipelines
    2. Step 2: Name the Pipeline
    3. Step 3: Create Stages
    4. Step 4: Assign Workspace
    5. Step 5: Compare content
    6. Step 6: Work with Deployment Pipelines
  7. How to Visualize a Deployment Pipeline in Power BI?
  8. How to Use Power BI Deployment Pipeline?
  9. Power BI Deployment Pipeline Best Practices
  10. Power BI Deployment Pipeline Limitations And Considerations
  11. FAQs For Deployment Pipeline Power BI
  12. Wrap Up

Let’s unleash your data superpowers and conquer the world, one visual at a time.

What are Power BI Deployment Pipelines?

Definition: A deployment pipeline in BI is a structured approach to managing the lifecycle of Power BI artifacts. It is a conduit for deploying reports, dashboards, and datasets across different environments. Thus, it ensures a smooth and controlled process from development to production, maintaining consistency and reducing manual errors.

This pipeline includes stages like development, testing, and production, each with specific controls and validations. You can promote Power BI artifacts through these stages, ensuring that only tested and approved content moves forward.

Moreover, the deployment pipeline enhances collaboration among development and IT teams. It promotes best practices in version control, change, and release management. Therefore, it is pivotal in maintaining the integrity of Power BI solutions throughout their lifecycle.

Why are Deployment Pipelines Important?

Deployment pipelines are important because they automate and simplify the software release process. They ensure each release is consistent and reliable by reducing manual errors and speeding up development. With tools like the Power BI connector, software updates can be delivered to users more quickly and with better quality.

Purpose of Deployment Pipeline in Power BI

  • Efficient Delivery: Streamline the process of delivering business intelligence insights promptly to stakeholders.
  • Automated Development: Automate the development, testing, and deployment of Power BI reports and dashboards for swift access to critical insights.
  • Structured Workflow: Establish a structured pipeline to ensure consistency and efficiency in deploying BI solutions.

How Does the Deployment Pipeline Work?

A deployment pipeline works by automating the steps from code creation to deployment. It starts with code commits, followed by automated builds and tests. If tests pass, the build is deployed to a staging environment for further checks.

Different Stages of Power BI Deployment Pipeline

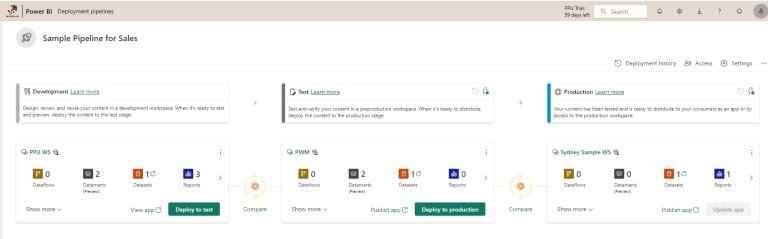
The Power BI deployment pipelines consist of several key stages. Each stage serves a distinct purpose to ensure a controlled and systematic progression of Power BI content.

  • Development

In the Power BI deployment pipeline development stage, creators design and build reports, dashboards, and datasets. It serves as the creative incubator where the initial development work takes place. Here, teams collaborate to bring data to life and create the foundational elements of the Power BI solution.

  • Testing

The testing stage is where thorough quality assurance occurs. Teams rigorously test the developed Power BI artifacts, ensuring they meet the following;

  • Performance standards.
  • Respond correctly to user interactions.
  • Are free of errors.

This stage identifies and rectifies issues early in the process, promoting a robust and reliable Power BI solution.

  • User Acceptance Testing (UAT)

User Acceptance Testing (UAT) is a critical phase. Here, end-users evaluate the Power BI solution to ensure it meets their expectations and requirements. Stakeholders provide feedback, and any necessary adjustments are made before proceeding to the next stage. UAT ensures that the solution meets technical specifications and satisfies user needs.

  • Staging

Staging is the intermediate step before deploying to the production environment. It acts as a buffer to validate the deployment process without impacting the live environment. This stage allows for final checks, ensuring everything is in order and ready for deployment to production. It acts as a safeguard against potential issues that may arise during deployment.

  • Production

This is the final destination where the Power BI solution goes live for users. The solution is deployed to the production environment after successful testing and validation in the previous stages. Here, ongoing monitoring, maintenance, and updates ensure Power BI continues delivering value in a live environment.

How to Create a Deployment Pipeline Power BI: Step-by-Step

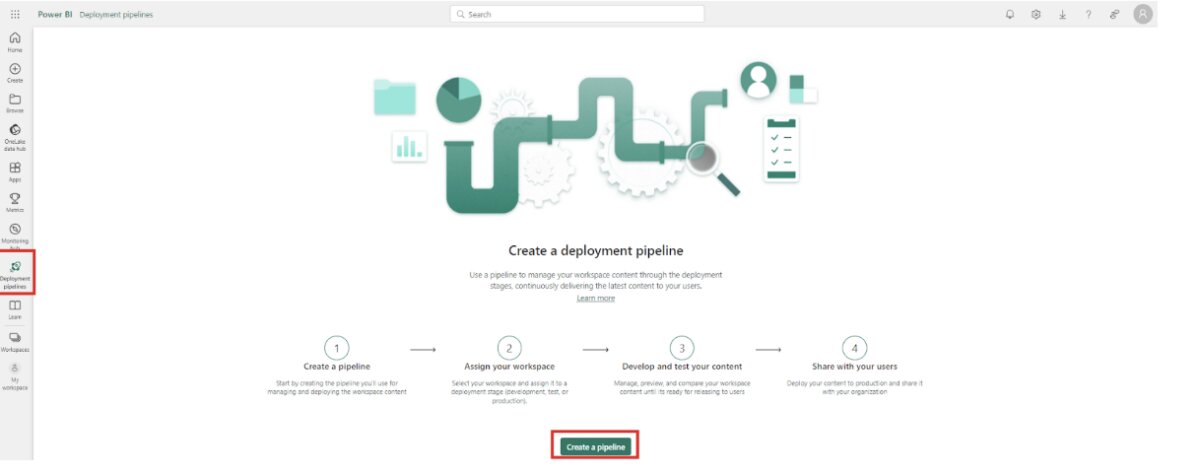
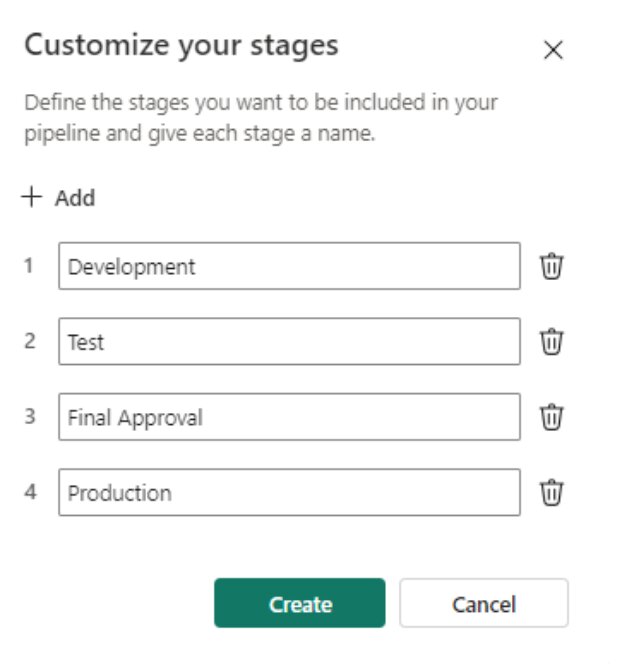
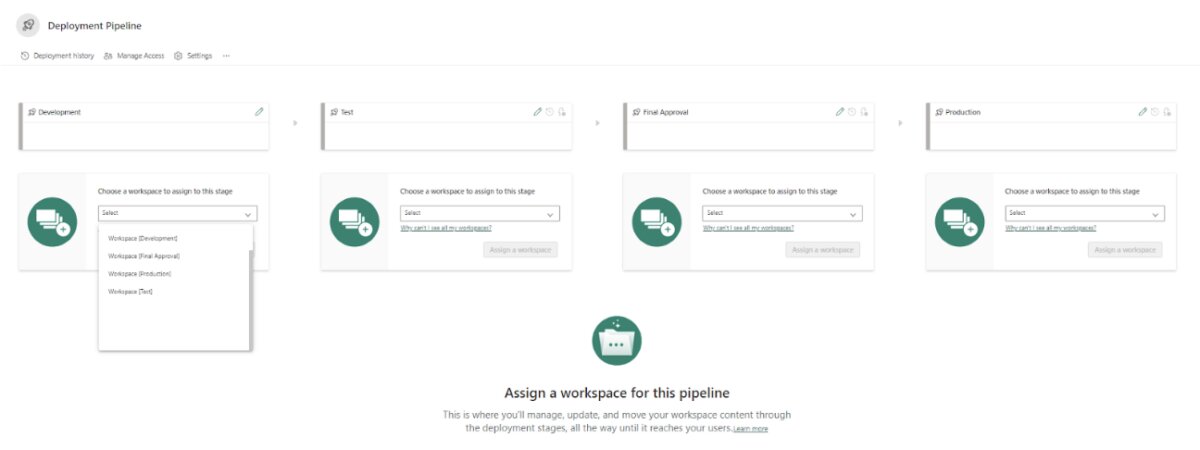
Creating Power BI deployment pipelines involves the following steps:

Step 1: Creating Deployment Pipelines

  • Click the Deployment Pipelines icon on the Power BI Service home screen, then click the green “Create pipeline” button.
Deployment Pipelines in Power BI 1

Step 2: Name the Pipeline

  • Enter a name and optional description for your pipeline, then click “Next.”

Step 3: Create Stages

  • In the next window, create your pipeline stages, with a minimum of 2 and a maximum of 10 stages.
Deployment Pipelines in Power BI 2

Step 4: Assign Workspace

  • Power BI’s deployment pipeline offers three environment choices. Simply assign workspaces by selecting from the dropdown menu.
Deployment Pipelines in Power BI 3

Step 5: Compare content

  • After assigning workspaces, the deployment pipeline provides a summary of content in each environment.
Deployment Pipelines in Power BI 4

Step 6: Work with Deployment Pipelines

  • Deployment pipelines automate software deployment, ensuring consistent, reliable, and speedy delivery of updates from development to production.

How to Visualize a Deployment Pipeline in Power BI?

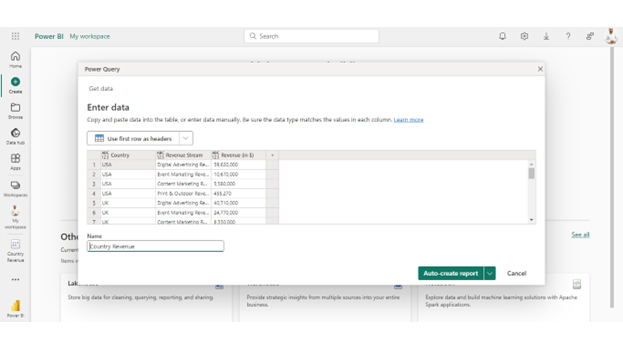
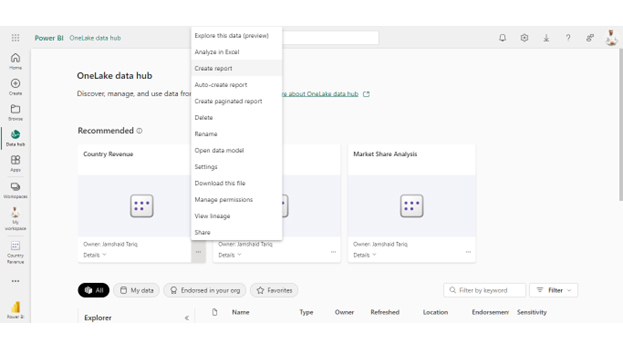
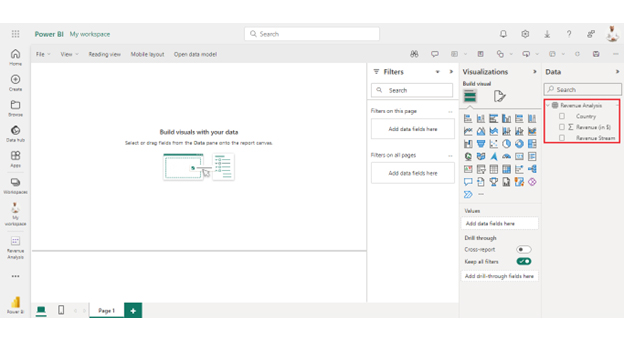
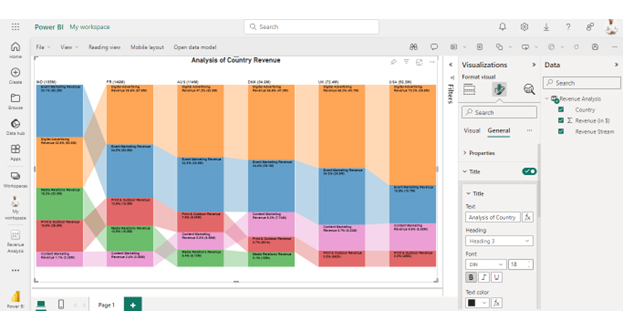
Examining data in Power BI is in several stages, as outlined below.

Stage 1: Logging in to Power BI

  1. Log in to Power BI.
  2. Enter your email address and click the “Submit” button.
Enter email to login to Power BI
  • You are redirected to your Microsoft account.
  • Enter your password and click “Sign in“.
Enter Password to login to Power BI
  • You can choose whether to stay signed in.
Click on stay signed in
  • Once done, the Power BI home screen will open.

Stage 2: Creating a Data Set and Selecting the Data Set to Use in Your Chart

  • Go to the left-side menu and click the “Create” button.
  • Select “Paste or manually enter data“.
select Paste or manually enter data in Power BI ce487
  • We’ll use the sample data below for this example.
Country Revenue Stream Revenue  (in $)
USA Digital Advertising Revenue           39,620,000
USA Event Marketing Revenue           10,670,000
USA Content Marketing Revenue             5,580,000
USA Print & Outdoor Revenue                 455,270
UK Digital Advertising Revenue           40,710,000
UK Event Marketing Revenue           24,770,000
UK Content Marketing Revenue             6,330,000
UK Print & Outdoor Revenue              552,190
DNK Digital Advertising Revenue           47,040,000
DNK Event Marketing Revenue           29,070,000
DNK Content Marketing Revenue             7,740,000
DNK Print & Outdoor Revenue                 600,690
DNK Media Relations Revenue                 106,430
AUS Digital Advertising Revenue           53,790,000
AUS Event Marketing Revenue           38,530,000
AUS Content Marketing Revenue             6,590,000
AUS Print & Outdoor Revenue             9,040,000
AUS Media Relations Revenue             6,130,000
FR Digital Advertising Revenue           57,860,000
FR Event Marketing Revenue           50,450,000
FR Content Marketing Revenue             3,560,000
FR Print & Outdoor Revenue           18,790,000
FR Media Relations Revenue           15,460,000
IND Digital Advertising Revenue           60,470,000
IND Event Marketing Revenue           63,200,000
IND Content Marketing Revenue             2,080,000
IND Print & Outdoor Revenue           29,500,000
IND Media Relations Revenue           30,020,000
  • Paste the above data table in the Power Query Window.
  • Select the “Create a dataset only” option.
Create a dataset ce504
  • On the left-side menu, click “Data Hub“.
  • Power BI populates the data set list. (If you have not created a data set, refer to the Error! Reference source not found section).
  • Click on the “Create a report” dropdown.
Create a report ce504
  • Click the “Expand All” button.
  • You can see your chart metrics:
Click Expand All ce504
  • Click on “Get more visuals“.
  • Search for ChartExpo and select the Comparison Bar Chart:
Comparison Bar CHart for Power BI by ChartExpo ce487
  • Click the “Add” button.
Click to Add The Chart ce487
  • You can now see the Comparison Bar Chart in the visualizations list.
Chart in the visualizations list ce504
  • In Visual, click License Settings, add the key, and enable the license.
  • After adding the key, you can see the comparison bar chart.
click License Settings ce504
  • The final Comparison Bar Chart in Power BI will appear as below.
Final Power BI Deployment Pipelines
 https://chartexpo.com/utmAction/MTYrYmxvZytwYitjZXhwbytQQkk1MDQrQ29tcGFyaXNvbis=

Insights

  • India leads in total revenue, with France, Australia, and Denmark following closely.
  • “Event Marketing” takes the lead in revenue contribution in India, deviating from the typical dominance of “Digital Advertising” in most countries.
  • The revenue stream from “Media Relations” is absent in the US and the UK.
  • France exhibits a lower reliance on content marketing compared to other revenue streams.
  • Despite its overall high revenue, India has the lowest income from content marketing.

Optimize Graphs Through Streamlined Power BI Deployment Pipeline:

  1. Open your Power BI Desktop or Web.
  2. From the Power BI Visualizations pane, expand three dots at the bottom and select “Get more visuals”.
  3. Search for “Comparison Bar Chart by ChartExpo” on the AppSource.
  4. Add the custom visual.
  5. Select your data and configure the chart settings to create the chart.
  6. Customize your chart properties to add header, axis, legends, and other required information.
  7. Share the chart with your audience.

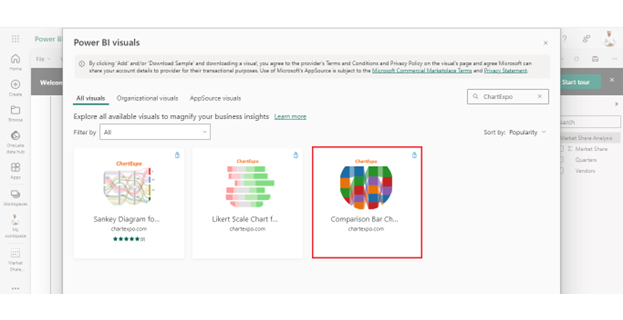
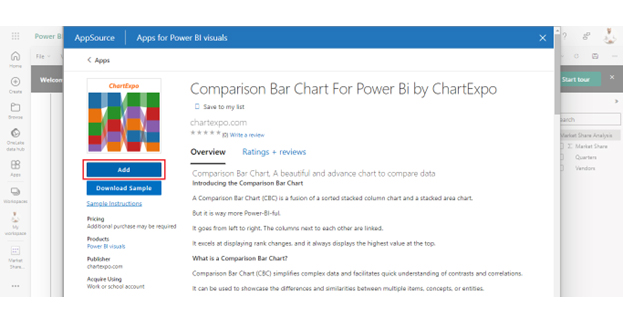
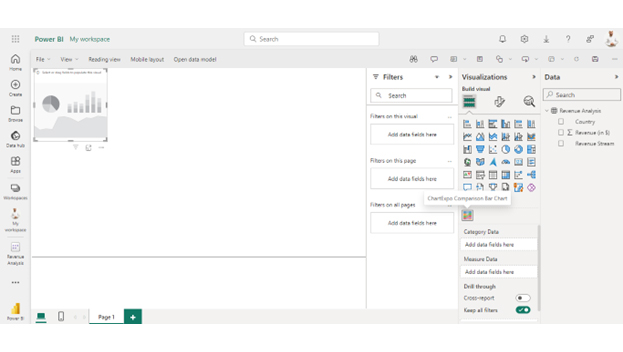
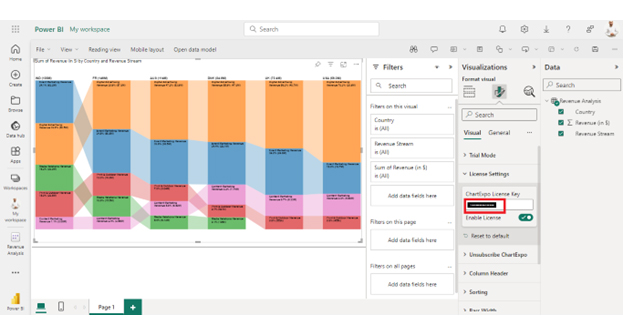
The following video will help you create a Comparison Bar Chart in Microsoft Power BI.

 https://chartexpo.com/utmAction/MTYrYmxvZytwYitjZXhwbytQQkk1MDQrQ29tcGFyaXNvbis=

How to Use Power BI Deployment Pipeline?

  1. Create Deployment Pipeline: In Power BI Service, navigate to the “Deployment Pipelines” tab and create a new pipeline. Assign a workspace for the development stage.
  2. Assign Workspaces: Assign different workspaces to the development, test, and production stages. This guarantees that every environment has its own designated space.
  3. Deploy to Next Stage: Once your reports and datasets are ready, click “Deploy” to move them from one stage to the next (e.g., development to test, or test to production).
  4. Monitor and Validate: After deployment, monitor the reports and datasets to ensure everything works as expected in the new environment. This step helps identify any issues before moving to production.
  5. Manage Versions: The deployment pipeline allows you to compare the different stages and manage version control, ensuring consistent updates and rollbacks if necessary.

Power BI Deployment Pipeline Best Practices

  • Use Separate Workspaces for Each Stage

Make sure to create separate environments for development, testing, and production. This separation helps prevent accidental changes in live environments.

  • Plan and Automate Deployments

Establish consistent deployment schedules and, where feasible, automate the process to minimize manual mistakes and boost efficiency.

  • Version Control

Keep track of changes in each deployment stage by using version control. This will help in tracking updates and rolling back if necessary.

  • Test Thoroughly Before Production

Always validate reports and datasets in the test environment before deploying to production. Testing helps catch issues early.

  • Monitor and Optimize

After deployment, continuously monitor performance and user feedback. Use the Power BI audit logs to ensure the system is running smoothly and identify any areas for optimization.

Power BI Deployment Pipeline Limitations And Considerations

Considerations

  • Data Governance: Ensure compliance and define access roles.
  • Data Source Compatibility: Evaluate connectivity for smooth data access.
  • Performance Optimization: Refine models and queries for speed.
  • Version Control: Implement for collaboration and tracking changes.
  • Automated Testing: Validate accuracy and functionality.

Limitations

  • Limited Data Governance Features: Fine-grained access control may require external solutions.
  • Compatibility Challenges with Some Data Sources: Workarounds needed for certain sources.
  • Performance Issues with Large Datasets: Requires iterative refinement.
  • Limited Version Control in Power BI: Integration with external tools like Git is necessary.
  • Lack of Native Support for Automated Testing: Custom scripts or third-party tools are needed.

Power BI Deployment Pipeline – FAQs

How do you automate a deployment process in Power BI?

To automate a deployment in Power BI, create deployment pipelines. Create deployment templates, configure settings, and utilize source control integration. This automates the movement of artifacts through different stages, streamlining the deployment process for efficiency and consistency.

How do you create a data pipeline in Power BI?

To create a data pipeline in Power BI:

  1. Use Power Query to connect and transform data.
  2. Design the data model using Power BI Desktop and utilize Power Automate to automate data refresh.
  3. Publish the report to the Power BI service, establishing a seamless and automated data pipeline.

What are Power BI deployment pipeline rules?

Power BI deployment pipeline rules outline the automated processes for deploying Power BI reports and dashboards from development to production environments. These rules ensure consistency, reliability, and efficiency in delivering updates, facilitating seamless collaboration and frequent releases.

Wrap Up

Power BI deployment pipeline streamlines report deployment, ensuring smooth transitions between development stages. It enhances collaboration, facilitates version control, and mitigates risks during the deployment process. From automating deployment processes, it reduces manual errors, saving time and resources.

The pipeline’s structured approach ensures consistency and reliability, from creating artifacts to continuous improvement. It supports various environments, allowing seamless movement from development to testing and, ultimately, production. Moreover, the integration with source control enhances collaboration and tracks changes, providing transparency and accountability.

The pipeline is not just a tool; it’s a guardian of data integrity and a facilitator of best practices. It aligns with the rhythm of organizational success, marking the finale of a performance where data shines. It’s your helper in the data world, ensuring your reports reach their destination without a hitch. It empowers teams to deliver high-quality, up-to-date reports and insights to drive informed decision-making.

Therefore, embracing the Power BI deployment pipeline is not just a choice; it’s a strategic imperative. It aligns with the dynamic needs of modern data-driven enterprises.

Do not hesitate.

Elevate your data journey today with the Power BI deployment pipeline ”” where efficiency meets innovation.

How much did you enjoy this article?

PBIAd2
Start Free Trial!
132785

Related articles

next previous
Power BI12 min read

Power BI Group By Guide for Effective Data Insights

Learn how Power BI Group By helps you aggregate data, clarify trends, and create reports by grouping values to make large datasets manageable & insightful.

Power BI12 min read

How to Create Sankey Diagram in Microsoft Power BI?

Learn How to Create Sankey Diagram in Microsoft Power BI using Desktop & Web Service. What they are and how to use them effectively.

Power BI8 min read

Power BI Artificial Intelligence: Insights Using Visuals

Discover all there is to know about the Power BI artificial intelligence. You'll also discover how AI is used in Power BI, and how to use it for analysis and more.

Power BI9 min read

Budgeting in Healthcare: Use Visuals to Spot Budget Gaps

This guide helps you discover what budgeting in healthcare is. You'll also discover the factors that affect hospital budgets and types of budgeting in healthcare.

Power BI9 min read

Predictive Analytics in Power BI for Making Insightful Visuals

This guide shows you everything you need to know about Predictive Analytics in Power BI. It also shows you how it works, and how to interpret the results.

ChartExpo logo

Turn Data into Visual
Stories

CHARTEXPO

  • Home
  • Gallery
  • Videos
  • Services
  • Pricing
  • Contact us
  • FAQs
  • Privacy policy
  • Terms of Service
  • Sitemap

TOOLS

  • ChartExpo for Google Sheets
  • ChartExpo for Microsoft Excel
  • Power BI Custom Visuals by ChartExpo
  • Word Cloud

CATEGORIES

  • Bar Charts
  • Circle Graphs
  • Column Charts
  • Combo Charts
  • Comparison Charts
  • Line Graphs
  • PPC Charts
  • Sentiment Analysis Charts
  • Survey Charts

TOP CHARTS

  • Sankey Diagram
  • Likert Scale Chart
  • Comparison Bar Chart
  • Pareto Chart
  • Funnel Chart
  • Gauge Chart
  • Radar Chart
  • Radial Bar Chart
  • Sunburst Chart
  • see more
  • Scatter Plot Chart
  • CSAT Survey Bar Chart
  • CSAT Survey Chart
  • Dot Plot Chart
  • Double Bar Graph
  • Matrix Chart
  • Multi Axis Line Chart
  • Overlapping Bar Chart
  • Control Chart
  • Slope Chart
  • Clustered Bar Chart
  • Clustered Column Chart
  • Box and Whisker Plot
  • Tornado Chart
  • Waterfall Chart
  • Word Cloud
  • see less

RESOURCES

  • Blog
  • Resources
  • YouTube
SIGN UP FOR UPDATES

We wouldn't dream of spamming you or selling your info.

© 2025 ChartExpo, all rights reserved.