• Home
  • Tools dropdown img
    • Spreadsheet Charts

      • ChartExpo for Google Sheets
      • ChartExpo for Microsoft Excel
    • Power BI Charts

      • Power BI Custom Visuals by ChartExpo
    • Word Cloud

  • Charts dropdown img
    • Chart Category

      • Bar Charts
      • Circle Graphs
      • Column Charts
      • Combo Charts
      • Comparison Charts
      • Line Graphs
      • PPC Charts
      • Sentiment Analysis Charts
      • Survey Charts
    • Chart Type

      • Box and Whisker Plot
      • Clustered Bar Chart
      • Clustered Column Chart
      • Comparison Bar Chart
      • Control Chart
      • CSAT Survey Bar Chart
      • CSAT Survey Chart
      • Dot Plot Chart
      • Double Bar Graph
      • Funnel Chart
      • Gauge Chart
      • Likert Scale Chart
      • Matrix Chart
      • Multi Axis Line Chart
      • Overlapping Bar Chart
      • Pareto Chart
      • Radar Chart
      • Radial Bar Chart
      • Sankey Diagram
      • Scatter Plot Chart
      • Slope Chart
      • Sunburst Chart
      • Tornado Chart
      • Waterfall Chart
      • Word Cloud
    • Google Sheets
      Microsoft Excel
  • Services
  • Pricing
  • Contact us
  • Blog
  • Support dropdown img
      • Gallery
      • Videos
      • Contact us
      • FAQs
      • Resources
    • Please feel free to contact us

      atsupport@chartexpo.com

Categories
All Data Visualizations Data Analytics Surveys
Add-ons/
  • Google Sheets
  • Microsoft Excel
  • Power BI
All Data Visualizations Data Analytics Surveys
Add-ons
  • Google Sheets
  • Microsoft Excel
  • Power BI

We use cookies

This website uses cookies to provide better user experience and user's session management.
By continuing visiting this website you consent the use of these cookies.

Ok

ChartExpo Survey


Home > Blog > Surveys

21 Post Training Survey Questions to Get Actionable Insights

As a manager, you probably know the importance of conducting post-training survey questions for employees.

post-training survey questions

Maybe it’s to assess the effectiveness of your training programs and work on enhancements or gather feedback for analysis. But do you know how to examine the data from these surveys?

If not, don’t worry. This article will show you how to examine your post-training survey data. We’ll walk you through the process step-by-step so that you can better understand how your training programs affect your employees.

Table of Contents:

  1. What are Post-Training Survey Questions?
  2. Why use Post-Training Survey Questions?
  3. Top Post Training Survey Questions
  4. Executing Post Training Survey Using Questionnaire
  5. Extracting Insights from Post-Training Survey Questions Results
  6. Wrap Up

Let’s get started!

What are Post-Training Survey Questions?

If you’re unfamiliar with the term “post-training survey,” here is the answer.

Definition: A post-training survey is given to attendees after completing a training program. The point of the survey is to get feedback on the quality of the training and what attendees thought of it.

So, one method to improve your training and ensure it achieves its objectives and is cost-effective is to conduct post-training surveys. However, the quality of post-training surveys depends on the questions.

The survey usually contains questions about the following:

  • The trainer: Was the trainer knowledgeable? Did s/he answer questions well?
  • The training material: Was the material easy to understand? Was it relevant to your job?
  • The overall experience: Was the training too long/short? Too easy/difficult? Would you recommend it to others?

Why Use Post-Training Survey Questions?

When you train someone, you want them to remember what they learned. This is why you ask them to complete a post-training survey. But what happens when you don’t ask them to complete a survey after training?

You may be wondering why you should use post-training survey questions. After all, you spent all this time and money on a training program, so it should be successful.

The truth is that even the best training programs can have flaws. By conducting a matrix survey with carefully crafted questions after the training is over, you can get honest feedback about what worked and what didn’t.

Not only that but asking this type of survey in post-training surveys can help you determine whether or not your employees are retaining the information they learned in training. It enables you to track who is doing well and who needs more training or coaching. This is important because it can help you change how the training is delivered in the future.

They also allow you to measure the effectiveness of your training program. However, the trainers must include these questionnaires at the end of their training sessions. Remember, by using a post-training survey questions template, you can ensure that you are asking the right questions to get the necessary information.

So, asking your employees to fill out a post-training survey template is a meaningful way to gauge how practical your training was. By getting feedback from your employees, you can determine what parts of the training were most helpful and what areas need improvement.

A well-designed post-training survey will ask about both the content of the training and the delivery of that information. Additionally, it is essential to ask how employees felt about the overall training experience.

Gathering this feedback is essential for ensuring your training program is as effective as possible. Using post-training survey questions, you can make necessary adjustments to ensure that your employees get the most out of your training sessions.

So, there are many good reasons to use post-training survey questions. But how do you go about creating them?

Top 21 Post-Training Survey Questions

When you’ve put time and effort into training your employees, the last thing you want is for that training to go to waste. A post-training survey can help you gauge how well your employees took in the information and whether they feel confident in their new skills.

There are a few different ways to ask questions on a post-training survey. Different types of Likert scale questions are great for measuring satisfaction levels while rating questions can provide more detailed feedback. The 5-Point Likert scale has this arrangement:

  • 1 = Very Dissatisfied
  • 2 = Dissatisfied
  • 3 = Neutral
  • 4 = Satisfied
  • 5 = Very Satisfied

Closed-ended questions are a great way to gauge understanding of key concepts, while open-ended questions can provide insights into how employees apply what they’ve learned.

Here are some examples of closed-ended post-training survey questions:

  1. What was the most important thing you learned in this training?
  2. What did you find most helpful about the training?
  3. How well do you feel you understand the material covered in training?
  4. On a scale of 1-5, how interested were you in the training material?
  5. Was there anything about the activity that you didn’t understand?
  6. Is there anything you would like to see more of in future training?
  7. How likely are you to use what you learned in this training in your work?

Here are some examples of open-ended post-training survey questions:

  1. What did you think of the trainer’s delivery style?
  2. How do you plan to use what you learned in this training in your work?
  3. What other topics would you like to see covered in future training?
  4. Was there anything about the training that we could improve upon?

Likert Scale Questions:

  1. How helpful was the training?
  2. How engaging was the material?
  3. How well did the trainer explain the concepts?
  4. How easy was it to follow along?
  5. Did you feel like you learned anything useful?

Rating Questions:

  1. Overall, how satisfied are you with the training?
  2. Would you recommend this training to others?
  3. How likely are you to use what you learned in your job?
  4. Was the length of the activity appropriate?
  5. Were the materials easy to understand?

Executing Post Training Survey Using Questionnaire

Google Forms is one of the best online survey questionnaire creators that provides a quick and innovative way to get post-event survey feedback. More so, Google Forms is a quicker alternative to asking questions via email. It’s loaded with all the standard survey fields, such as dropdowns and multiple-choice questions, to gather data.

We have created a post-training survey in Google Forms as shown in the image below.

Click on the share button to copy your Google Form link to send it to people.

Post Training Survey Questions

Once you’ve collected all the responses to your training survey questionnaire, it’s time to analyze the data. The first step is exporting the survey template data from Google Forms to Excel. When you have all the responses, click on the Google Sheets Icon. This will export the results of Google Forms to Google Sheets.

post-training survey responses

The file will open in Google Sheets. (For showing you results if hypothetical data is added)

download-post-training survey responses sheet

Once the file has been downloaded, open it in Excel, and you’ll see your survey responses in a table.

post-training survey responses sheet

Extracting Insights from Post-Training Survey Questions Results

Now that you’ve collected all this data, it’s time to analyze it and see what people thought about your training! You can do this in a few different ways, but my favorite is using ChartExpo.

ChartExpo is a spreadsheet plugin. It only requires a simple installation and you are set to visualize your data. You can use it even if you’re a newbie or don’t know how to code. Now, you ought to pick a top tool for data visualization in ChartExpo.

Although creating visualization in any tool can be challenging because the majority of them require coding skills, ChartExpo provides a chart add-on that streamlines the visualization creation process.

Besides, it works with many visualizations, is simple to set up, and has many learning tools. Therefore, you can choose any visualization based on your comfort level. With it adding value to your visualization is simple, and it meets consumers’ needs without more complex functionality.

How to install ChartExpo in Excel?

  1. Open your Excel application.
  2. Open the worksheet and click on the “Insert” menu.
  3. You’ll see the “My Apps”.
  4. In the office Add-ins window, click on “Store” and search for ChartExpo on my Apps Store.
  5. Click on the “Add” button to install ChartExpo in your Excel.

There is another direct way to install ChartExpo by clicking on the below link for your desired tool.

Example

Once your data is sorted and organized the way you want, you can look for trends and patterns. This will help you understand what parts of the training people liked and didn’t like and what areas you need to improve.

  • To get started with the ChartExpo chart add-in for Excel, install using this link.
  • So go ahead and fire up Excel with ChartExpo, and let’s get started! Here’s how it works. After installing ChartExpo, select My Apps from the INSERT menu.
insert chartexpo
  • Choose ChartExpo and Insert.
open chartexpo
  • Once this add-in has loaded, a list of available charts will appear. Click “Likert Scale Chart” from this list.
search chart for Post Training Survey Questions
  • Click “Create Chart From Selection” after selecting the data from the sheet.
create likert scale chart on Post Training Survey Questions
  • When you click on Create Chart From Selection you have manually mapped responses with numbers. The Likert scale has this arrangement:
    • 1 = Strongly Disagree
    • 2 = Disagree
    • 3 = Neutral
    • 4 = Agree
    • 5 = Strongly Agree
create likert scale chart on Post Training Survey Questions
  • After some modification of the visualization’s parameters, you can get the final look as shown below.
Post Training Survey Questions examples

Insights

  • 57% indicated that the training objectives were clearly defined and the other 18% of respondents thought that training objectives were not clearly defined.
  • 58% of respondents indicated that training experience can be useful in their work and 17% indicated that training experience is not useful in their work.
  • Overall view, 56% of respondents are satisfied with the training, and 18% are dissatisfied with the training. The Grey area represents neutral which means they are neither satisfied nor dissatisfied with training.

FAQ:

How Do You Gather Feedback after Training?

One way is to survey your employees after the training is complete. You can do this using online survey creators such as Google Forms, or you can hand out paper surveys. You’ll want to ensure you’re asking the right questions to get helpful feedback.

Some questions you might want to include are:

  • Did you find the training helpful? Did the training meet your expectations?
  • What did you like about the training?
  • What didn’t you want about the training?
  • Would you recommend the training to others?
  • Is there anything we could improve about the training?

Another way to gather feedback is simply asking your employees how they thought the training went. This can be done in person, or you can send out an email. This method is less formal than a survey, but it can still give you valuable insights into how your employees feel about the training.

Wrap Up

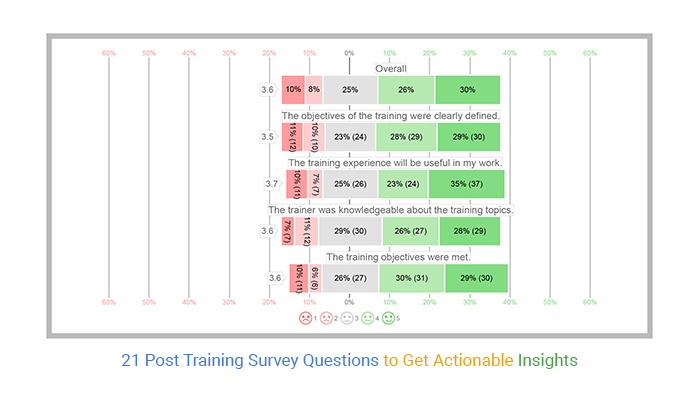
By now, you should have a good understanding of how to analyze post-training survey data. Using the ChartExpo function, you can easily see which questions were answered most frequently and which had the highest average scores.

You can also use the filter function to focus on specific topics or areas of improvement. By analyzing your post-training survey data, you can get valuable insights that will help you improve your training programs and ensure that your employees get the most out of them.

We hope that you found this information helpful and that it will help you make better decisions regarding your own training programs. And if you found this post helpful, please share it with your network.

How much did you enjoy this article?

GSAd1
Start Free Trial!
123673

Related articles

next previous
Surveys16 min read

Survey Data Collection: Definition, Methods and Analysis

Find the best methods of Survey data collection. Elevate your research game with practical tips for gathering, analyzing, and leveraging valuable information.

Surveys11 min read

5-Point Performance Rating Scale With Examples: Quick Guide

Discover how the 5-Point Performance Rating Scale helps organizations evaluate employee performance with clarity, consistency, and fairness across teams.

Surveys11 min read

How to Interpret 4-Point Likert Scale Results?

Click to learn How to Create, Gather and Analyze Data Using the 4-Point Likert Scale? A complete guide with definition, examples, uses, and applications.

Surveys32 min read

Net Promoter Survey: Lies, Legends, and Lazy Thinking

Net Promoter Survey risks hiding customer truths behind one-size-fits-all scores. Want feedback that drives decisions? Get started with smarter questions.

Surveys11 min read

How to Make a Questionnaire? Examples & Templates

What is a questionnaire in survey? Learn how to make a questionnaire for a survey using Google Forms and analyze the questionnaire data in Excel.

ChartExpo logo

Turn Data into Visual
Stories

CHARTEXPO

  • Home
  • Gallery
  • Videos
  • Services
  • Pricing
  • Contact us
  • FAQs
  • Privacy policy
  • Terms of Service
  • Sitemap

TOOLS

  • ChartExpo for Google Sheets
  • ChartExpo for Microsoft Excel
  • Power BI Custom Visuals by ChartExpo
  • Word Cloud

CATEGORIES

  • Bar Charts
  • Circle Graphs
  • Column Charts
  • Combo Charts
  • Comparison Charts
  • Line Graphs
  • PPC Charts
  • Sentiment Analysis Charts
  • Survey Charts

TOP CHARTS

  • Sankey Diagram
  • Likert Scale Chart
  • Comparison Bar Chart
  • Pareto Chart
  • Funnel Chart
  • Gauge Chart
  • Radar Chart
  • Radial Bar Chart
  • Sunburst Chart
  • see more
  • Scatter Plot Chart
  • CSAT Survey Bar Chart
  • CSAT Survey Chart
  • Dot Plot Chart
  • Double Bar Graph
  • Matrix Chart
  • Multi Axis Line Chart
  • Overlapping Bar Chart
  • Control Chart
  • Slope Chart
  • Clustered Bar Chart
  • Clustered Column Chart
  • Box and Whisker Plot
  • Tornado Chart
  • Waterfall Chart
  • Word Cloud
  • see less

RESOURCES

  • Blog
  • Resources
  • YouTube
SIGN UP FOR UPDATES

We wouldn't dream of spamming you or selling your info.

© 2025 ChartExpo, all rights reserved.