• Home
  • Tools dropdown img
    • Spreadsheet Charts

      • ChartExpo for Google Sheets
      • ChartExpo for Microsoft Excel
    • Power BI Charts

      • Power BI Custom Visuals by ChartExpo
    • Word Cloud

  • Charts dropdown img
    • Chart Category

      • Bar Charts
      • Circle Graphs
      • Column Charts
      • Combo Charts
      • Comparison Charts
      • Line Graphs
      • PPC Charts
      • Sentiment Analysis Charts
      • Survey Charts
    • Chart Type

      • Box and Whisker Plot
      • Clustered Bar Chart
      • Clustered Column Chart
      • Comparison Bar Chart
      • Control Chart
      • CSAT Survey Bar Chart
      • CSAT Survey Chart
      • Dot Plot Chart
      • Double Bar Graph
      • Funnel Chart
      • Gauge Chart
      • Likert Scale Chart
      • Matrix Chart
      • Multi Axis Line Chart
      • Overlapping Bar Chart
      • Pareto Chart
      • Radar Chart
      • Radial Bar Chart
      • Sankey Diagram
      • Scatter Plot Chart
      • Slope Chart
      • Sunburst Chart
      • Tornado Chart
      • Waterfall Chart
      • Word Cloud
    • Google Sheets
      Microsoft Excel
  • Services
  • Pricing
  • Contact us
  • Blog
  • Support dropdown img
      • Gallery
      • Videos
      • Contact us
      • FAQs
      • Resources
    • Please feel free to contact us

      atsupport@chartexpo.com

Categories
All Data Visualizations Data Analytics Surveys
Add-ons/
  • Google Sheets
  • Microsoft Excel
  • Power BI
All Data Visualizations Data Analytics Surveys
Add-ons
  • Google Sheets
  • Microsoft Excel
  • Power BI

We use cookies

This website uses cookies to provide better user experience and user's session management.
By continuing visiting this website you consent the use of these cookies.

Ok

ChartExpo Survey


Home > Blog > Power BI

Merge Queries in Power BI for More Insightful Visuals

Power BI plays a vital role in empowering users to analyze and visualize data from diverse sources. This way, users will be able to make data-driven decisions through intuitive reports and dashboards. All these help in fostering efficiency, and informed strategies.

Merge Queries in Power BI

In this guide, you’ll discover what Power BI merging queries are, why you should merge queries in Power BI, what are the types of queries in Power BI, and the benefits of Power BI merging queries.

Table of Contents:

  1. What are Queries in Power BI?
  2. Why Merge Queries in Power BI?
  3. What are the Types of Queries in Power BI?
  4. How to Merge Queries in Power BI?
  5. Visualizing Data Effectively After Merging Queries in Power BI
  6. What are the Benefits of Power BI Merging Queries?
  7. What are the Common Challenges in Power BI Append Query?
  8. Wrap Up

First…

What are Queries in Power BI?

Definition: Queries in Power BI are commands (or instructions) used to extract, transform, and load (ETL) data from multiple sources into the Power BI environment. These queries are usually created with the Power Query Editor.

Why Merge Queries in Power BI?

Merging queries in Power BI helps in consolidating data from multiple sources (or tables) into a single dataset. This will facilitate comprehensive data analysis and enriched insights.

Users who merge queries based on common fields can combine related information from disparate sources like databases, web services, or spreadsheets into cohesive datasets for analysis.

The consolidation eliminates the need to manually combine data sets in external tools. This will, in turn, streamline the data preparation process and ensure data integrity.

What are the Types of Queries in Power BI?

Here are the two types of queries:

  • Data Queries: These queries are used to extract, transform, and load (ETL) data from external sources into a Power BI environment. Data queries connect multiple data sources like files, databases, APIs, and web services, and also retrieve the required data.
  • DAX Queries: DAX queries are used to manipulate and retrieve data already loaded into the Power BI data model. With DAX, users can create calculated columns, measures, and calculated tables. DAX queries are used to perform complex calculations, filtering, aggregations, and other operations on the data model. It also helps the user generate insights and metrics for visualization in Power BI dashboards and reports.

How to Merge Queries in Power BI?

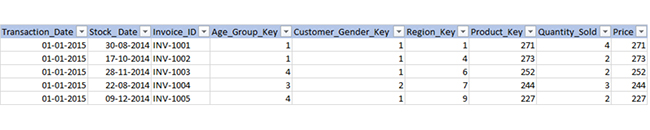
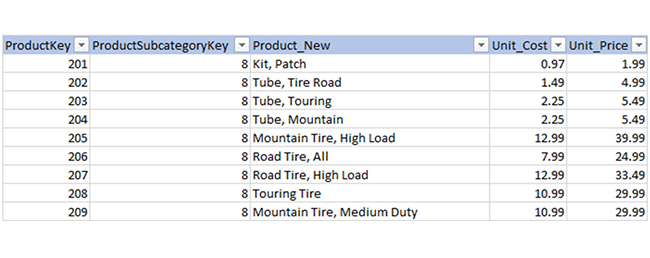
Consider the two tables below: Sales Data and Product Data.

Sales Data:

Get Sales Data for Doing Merge Queries in Power BI

Product Data:

Product Data for Doing Merge Queries in Power BI

Here are the steps for merging the queries:

  • Navigate to the left pane of Power Query Editor, and select the query (table) where you want the other query (table) to merge. For this illustration, it’s Sales Data.
  • Click on the Sales Data Table. After that, click on the Home Tab in the Ribbon Menu.
  • Click on Merge in the Combine section.
  • Click on Merge Queries as New.
Click on Merge Quries as New for Doing Merge Queries in Power BI

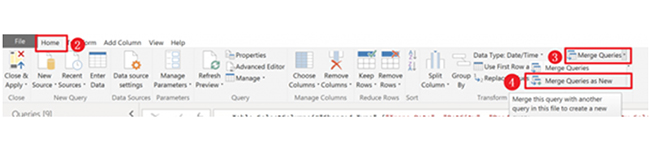
A pop-up menu appears on your screen.

  • From the drop-down menu, select Sales Data and click on Product_Key (common column between Sales and Product table)
  • From the second drop-down menu, select Product Data and click on Product_Key.
  • Click OK.

On ‘Merge Queries,’ you’ll get two options: ‘Merge Queries’ and ‘Merge Queries as New.’

Merge Queries:

This option does not create a new table. It’s used to merge two tables.

Merge Queries as New:

This option comes in when you want to merge two (or more) tables and create a new one. You have to click on ‘Merge Queries as New’ to create a new one.

  • On the merge screen, you have to select the two tables from the drop-down list and also select the column (or columns) that will be joined together.
  • From the example below, you’ll be using Product_Key from the Sales Data table and Product_Key from the Product Data table.
  • From the image below, the Join Kind defaults to a left outer join. That is, all rows from the 1st table (Sales Data) will be joined with the matching rows from the 2nd (Product Data) table.
  • You’ll notice that the join finds a match between 1,63,072 of the rows in each table.
Join Finds a Match Do Not Match for Doing Merge Queries in Power BI

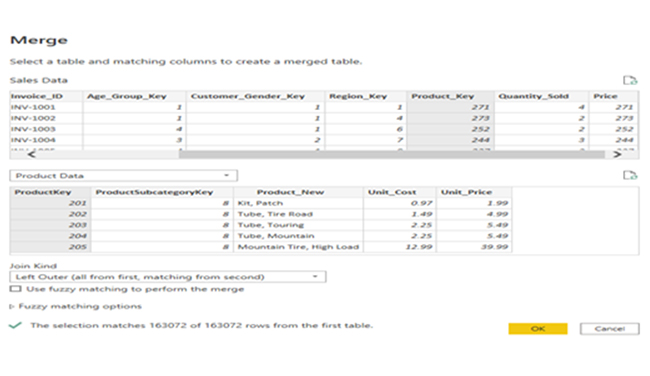
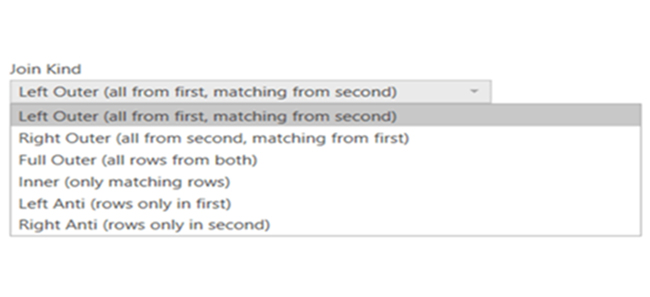
There are six types of joins, including right and left outer joins, inner joins, fuller outer join, and left and right anti joins. Anti-joins find rows that do not match between the two query datasets.

Do Not Match Between Two Query Datasets for Doing Merge Queries in Power BI

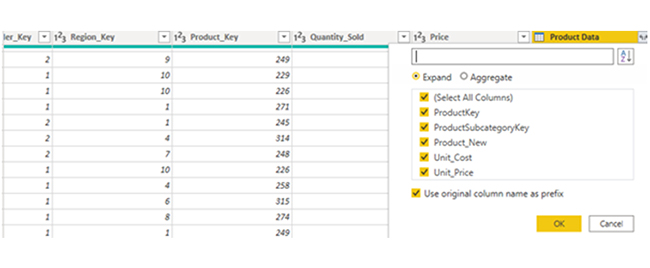
The image below shows the Merge result. A new column is added to the Sales Data dataset with a column name matching the 2nd table name, and Product Data. The data is listed as “Table,” and that’s confusing.

Data is Listed as Table for Doing Merge Queries in Power BI
  • If you want to see the related columns on the right-side column of the join, expand this column using the double arrow button in the right corner of the column header.
  • Click on the button to open the window that allows for selecting specific columns from the second table that should be included in the merged dataset.
  • Check the use of the original column name as a prefix. This can be checked to be on or off, and that prefixes the table name to each column.
Original Columns Name as Prefix for Doing Merge Queries in Power BI
  • Expanding the column adds the selected field from the right-side table to the merged dataset.

Visualizing Data Effectively After Merging Queries in Power BI

Stage 1: Log into Power BI, enter your email, and click “Submit.”

  • Log in to Power BI.
  • Enter your email address and click the “Submit” button.
Enter email to login to Power BI
  • You are redirected to your Microsoft account.
  • Enter your password and click “Sign in“.
Enter Password to login to Power BI
  • You can choose whether to stay signed in.
Click on stay signed in
  • Once done, the Power BI home screen will open.

Stage 2: Create a Data Set and Select the Data Set to Use in the Sankey Chart

  • Go to the left-side menu and click the “Create” button.
  • Select “Paste or manually enter data“.
select Paste or manually enter data in Power BI ce487
  • We’ll use the sample data below for this example.
Country Revenue Stream Revenue (in $)
USA Digital Advertising Revenue 39,620,000
USA Event Marketing Revenue 10,670,000
USA Content Marketing Revenue 5,580,000
USA Print & Outdoor Revenue 455,270
UK Digital Advertising Revenue 40,710,000
UK Event Marketing Revenue 24,770,000
UK Content Marketing Revenue 6,330,000
UK Print & Outdoor Revenue 552,190
DNK Digital Advertising Revenue 47,040,000
DNK Event Marketing Revenue 29,070,000
DNK Content Marketing Revenue 7,740,000
DNK Print & Outdoor Revenue 600,690
DNK Media Relations Revenue 106,430
AUS Digital Advertising Revenue 53,790,000
AUS Event Marketing Revenue 38,530,000
AUS Content Marketing Revenue 6,590,000
AUS Print & Outdoor Revenue 9,040,000
AUS Media Relations Revenue 6,130,000
FR Digital Advertising Revenue 57,860,000
FR Event Marketing Revenue 50,450,000
FR Content Marketing Revenue 3,560,000
FR Print & Outdoor Revenue 18,790,000
FR Media Relations Revenue 15,460,000
IND Digital Advertising Revenue 60,470,000
IND Event Marketing Revenue 63,200,000
IND Content Marketing Revenue 2,080,000
IND Print & Outdoor Revenue 29,500,000
IND Media Relations Revenue 30,020,000
  • Paste the data table above into the “Power Query” window. Next, select the “Create a dataset only” option.
Select Create a Dataset Only After Doing Merge Queries in Power BI
  • Navigate to the left-side menu, and click on the “Data Hub.” Power BI will populate the data set list. If no data set has been created, you’ll get an error message. Next, click on “Create report.”
Click Create Report After Doing Merge Queries in Power BI
  • After clicking on “Expand All,” you’ll see the chart metrics. Check the dimensions and metrics.
Check Dimensions and Metrics After Doing Merge Queries in Power BI
  • Click on “Get more visuals.” At this point, you’ll have to search ChartExpo and select the Comparison Bar Chart.
Click on Get More Visuals After Doing Merge Queries in Power BI
  • Click on “Add.”
Click on Add After Doing Merge Queries in Power BI
  • After that, you’ll see the Comparison Bar Chart in the visuals list.
See Comparison Bar Chart in Visual List After Doing Merge Queries in Power BI
  • In Visual, click on License Settings and add the key. After adding the key, you’ll see the comparison bar chart.
Add License Settings After Doing Merge Queries in Power BI
  • Here’s the final look at the Comparison Bar Chart in Power BI.
Final Merge Queries in Power BI

Insights

  • India has the highest total revenue, and they’re closely followed by France, Australia, and Denmark.
  • “Digital Advertising” tends to be a significant revenue contributor in most countries. However, “Event Marketing” is leading in India.
  • The “Media Relations” revenue stream is absent in countries like the UK and the US.

Optimizing Charts with Merge Queries in Power BI:

  1. Open your Power BI Desktop or Web.
  2. From the Power BI Visualizations pane, expand three dots at the bottom and select “Get more visuals”.
  3. Search for “Comparison Bar Chart by ChartExpo” on the AppSource.
  4. Add the custom visual.
  5. Select your data and configure the chart settings to create the chart.
  6. Customize your chart properties to add header, axis, legends, and other required information.
  7. Share the chart with your audience.

The following video will help you create a Comparison Bar Chart in Microsoft Power BI.

What are the Benefits of Power BI Merging Queries?

Merging queries in Power BI offers several benefits that enhance data analysis, improve efficiency, and streamline reporting. Here are the key advantages:

  • Data Integration: Merging queries helps to integrate data from multiple sources (or tables) into a single dataset. The consolidation simplifies data management and analysis by offering a unified view of related information.
  • Data Enrichment: Merging queries helps users to enrich their datasets. And that’s done by combining information from disparate sources. For instance, merging customer data with sales data provides additional insights into customer preferences and customer behavior.
  • Comprehensive Analysis: By combining data from multiple sources based on common fields, users will be able to perform comprehensive analysis and gain deeper insights. Merged queries help users to analyze and correlate related data points in a single view. And that facilitates more data-driven decision-making.
  • Improved Efficiency: Merged queries help streamline the data preparation process. To do that, it has to eliminate the need to manually combine datasets using external scripts or tools. This will, in turn, save time and effort. It also gives users the room to focus on analyzing the data and deriving insights.

What are the Common Challenges in Power BI Append Query?

Appending queries in Power BI can be a powerful way to combine datasets, but it also comes with certain challenges. Here are some common issues you might encounter:

  • Data Compatibility: Different data sources come with varying formats, naming conventions, or structures. This leads to compatibility issues when appending queries. Inconsistent data types, conflicting data formats, or missing columns require additional data transformation steps to ascertain successful append operations.
  • Performance Impact: Appending multiple queries and large datasets can impact Power BI’s performance, and that can lead to slower refresh times or increased resource consumption. To mitigate these performance issues, you’ll have to optimize query performance through efficient data loading strategies, query optimization techniques, and resource management practices.
  • Data Quality: Appending queries could expose inconsistencies (or errors) in the underlying data. These could be duplicates, missing values, or discrepancies. Ascertaining data quality and integrity across appended datasets requires data cleansing and validation procedures to identify and rectify discrepancies.
  • Resource and Memory Constraints: Power BI’s resource and memory constraints could limit the complexity (or size) of datasets that can be appended. Complex queries (or large datasets) could exceed Power BI’s capacity limits, and that could result in performance degradation or out-of-memory errors. Optimizing query design, and effective resource usage and memory management can help in overcoming these limitations.

FAQs

What is the difference between merge and append queries in Power BI?

Merge creates a single dataset by combining data from multiple queries based on common columns. Append, on the other hand, vertically stacks data from queries with identical structures, and helps to maintain separate datasets.

How do I combine multiple queries into one?

The “Append Queries” function in Power BI is used to vertically stack multiple queries with identical structures, thereby consolidating them into a single query.

How do you merge queries with multiple columns in Power Query?

The “Merge Queries” function in Power BI is used to combine multiple columns by selecting the common columns as join keys. It also specifies the join type for the merge operation.

Wrap Up

Queries in Power BI are instructions for extracting, loading, and transforming data. They’re vital for data preparation and enable analysis by consolidating and shaping data from diverse sources for insightful visualization.

But why should you consider Power BI merging queries? Well, merging queries provides a consolidated dataset with all relevant information. This enables the user to create more meaningful visualizations. This way, the user builds more accurate and insightful dashboards and reports that drive better decision-making.

It eliminates the need to manually combine datasets using external tools or scripts. This will help save time and efforts, and also allows users to focus on analyzing the data and deriving insights.

Following the steps outlined in this guide will help you create engaging, and interactive visualizations in Power BI.

Now you understand what merge queries in Power BI is, how will you incorporate it into your visualization process?

How much did you enjoy this article?

PBIAd2
Start Free Trial!
147003

Related articles

next previous
Power BI12 min read

Power BI Group By Guide for Effective Data Insights

Learn how Power BI Group By helps you aggregate data, clarify trends, and create reports by grouping values to make large datasets manageable & insightful.

Power BI12 min read

How to Create Sankey Diagram in Microsoft Power BI?

Learn How to Create Sankey Diagram in Microsoft Power BI using Desktop & Web Service. What they are and how to use them effectively.

Power BI8 min read

Power BI Artificial Intelligence: Insights Using Visuals

Discover all there is to know about the Power BI artificial intelligence. You'll also discover how AI is used in Power BI, and how to use it for analysis and more.

Power BI9 min read

Budgeting in Healthcare: Use Visuals to Spot Budget Gaps

This guide helps you discover what budgeting in healthcare is. You'll also discover the factors that affect hospital budgets and types of budgeting in healthcare.

Power BI9 min read

Predictive Analytics in Power BI for Making Insightful Visuals

This guide shows you everything you need to know about Predictive Analytics in Power BI. It also shows you how it works, and how to interpret the results.

ChartExpo logo

Turn Data into Visual
Stories

CHARTEXPO

  • Home
  • Gallery
  • Videos
  • Services
  • Pricing
  • Contact us
  • FAQs
  • Privacy policy
  • Terms of Service
  • Sitemap

TOOLS

  • ChartExpo for Google Sheets
  • ChartExpo for Microsoft Excel
  • Power BI Custom Visuals by ChartExpo
  • Word Cloud

CATEGORIES

  • Bar Charts
  • Circle Graphs
  • Column Charts
  • Combo Charts
  • Comparison Charts
  • Line Graphs
  • PPC Charts
  • Sentiment Analysis Charts
  • Survey Charts

TOP CHARTS

  • Sankey Diagram
  • Likert Scale Chart
  • Comparison Bar Chart
  • Pareto Chart
  • Funnel Chart
  • Gauge Chart
  • Radar Chart
  • Radial Bar Chart
  • Sunburst Chart
  • see more
  • Scatter Plot Chart
  • CSAT Survey Bar Chart
  • CSAT Survey Chart
  • Dot Plot Chart
  • Double Bar Graph
  • Matrix Chart
  • Multi Axis Line Chart
  • Overlapping Bar Chart
  • Control Chart
  • Slope Chart
  • Clustered Bar Chart
  • Clustered Column Chart
  • Box and Whisker Plot
  • Tornado Chart
  • Waterfall Chart
  • Word Cloud
  • see less

RESOURCES

  • Blog
  • Resources
  • YouTube
SIGN UP FOR UPDATES

We wouldn't dream of spamming you or selling your info.

© 2025 ChartExpo, all rights reserved.