Categories
What are lead generation KPIs, and why should they matter to your team? Every lead costs money, and every conversion impacts revenue. Without clear lead generation KPIs, teams waste time chasing numbers that don’t move the business forward.


Think about it. If you’re tracking clicks but not conversions, are you measuring growth? If your funnel is whole but sales are flat, what’s the real issue? Lead generation KPIs bring focus. They show where prospects drop off, where quality weakens, and where opportunity lies. They separate interest from intent.
Smart companies understand this. Companies that excel at lead nurturing generate 50% more sales-ready leads at 33% less cost. But how do they get there? They use actionable Metrics and KPIs, not hunches.
Still, not all of these metrics are worth your time. The trick is to know which performance metrics tell the real story. Traffic is great, but leads are better. Impressions are nice, but engagement is what pays the bills. So, data without context is noise. Smart tracking connects marketing to revenue, helps sales and marketing align, and turns guesswork into strategy.
Are you leading a marketing team or managing campaigns solo? Understanding the right lead generation KPIs could differentiate growth and stagnation.
Let me help you understand these metrics.
First…
Definition: Lead generation KPIs are quantifiable metrics that demonstrate how a company connects with potential customers. Teams use these metrics to monitor progression down the sales funnel, making it easy to follow trends and changes in strategies quickly. These numbers help businesses optimize campaigns in real-time.
Having clear goals and SMART KPIs helps keep objectives in check. It doesn’t matter whether you’re interested in cost per lead, conversion rate, or another conversion or revenue-impacting metric. KPI graphs lead to smarter marketing decisions and generally better business metrics.
If you’re not measuring, you’re guessing. And in lead generation, guessing burns time and budget fast. Tracking the right metrics and KPIs turns activity into insight. It shows what to keep, what to change, and what to cut.
Here’s why these numbers matter.
How are your lead generation efforts working? Don’t guess—measure. Tracking the correct numbers makes all the difference. While vanity metrics can distract, these top 10 lead generation KPIs offer clear direction. They show what’s working, what’s wasting budget, and where the real value lies:
Choosing the right metrics isn’t about tracking everything—it’s about tracking what matters. You don’t need more data. You need smarter data—the kind that ties directly to revenue, action, and impact. Picking the wrong numbers will waste time and blur strategy.
Follow these steps to pick the right metrics:
Is your lead-gen strategy solid? Prove it with data. Lead generation key performance indicators (KPIs) are your cheat sheet for what’s working and what’s not. But staring at rows of numbers in Excel isn’t exactly inspiring. Sure, Excel gets the job done for basics. But when it comes to data visualization, it hits a wall fast. Complex charts? Interactive dashboards? Not happening.
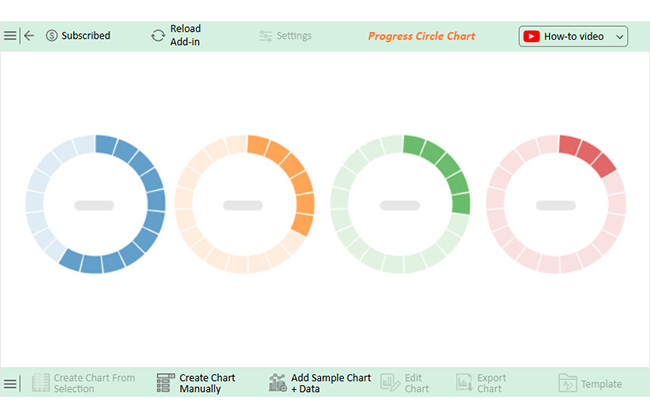
That’s where ChartExpo steps in. It quickly turns dry data into stunning, insightful visuals. With better visuals, your key performance indicators for operations tell a clearer, more convincing story.
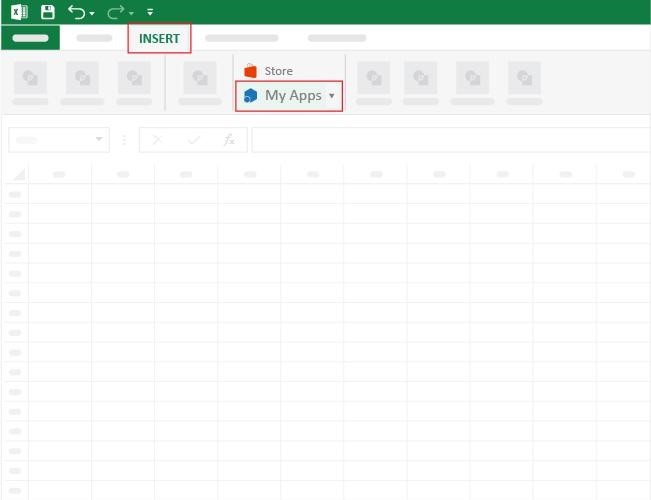
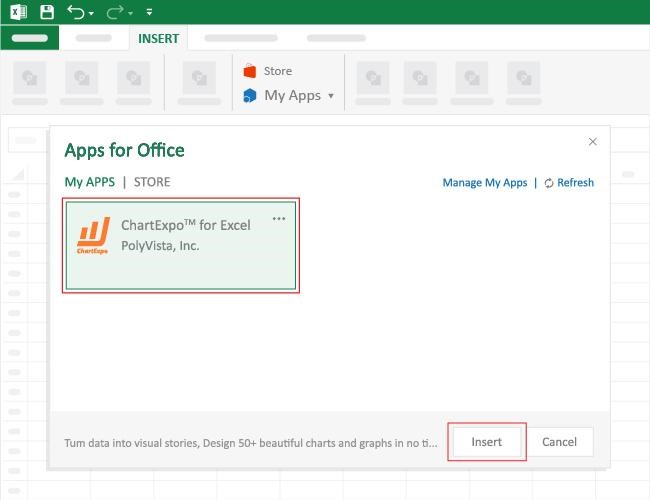
How to Install ChartExpo in Excel?
ChartExpo charts are available both in Google Sheets and Microsoft Excel. Please use the following CTAs to install the tool of your choice and create beautiful visualizations with a few clicks in your favorite tool.
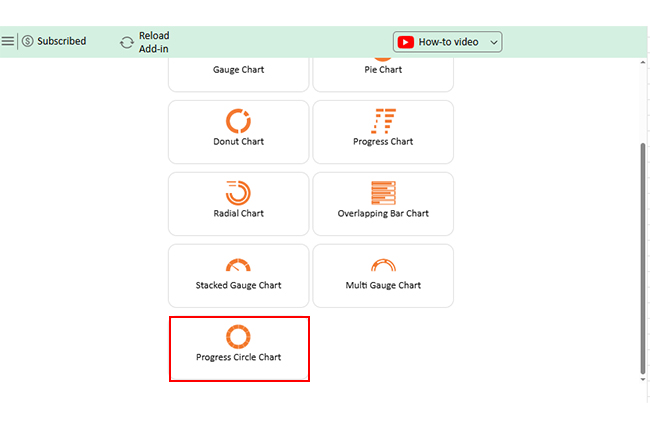
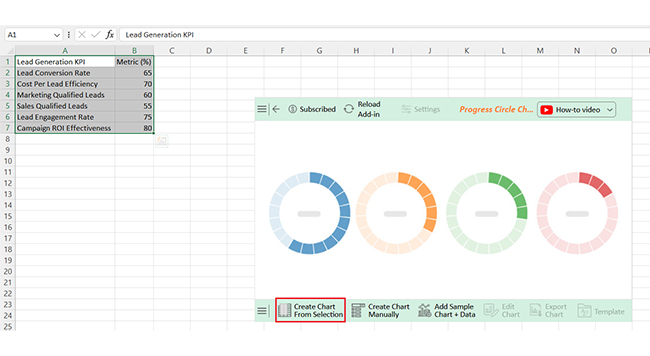
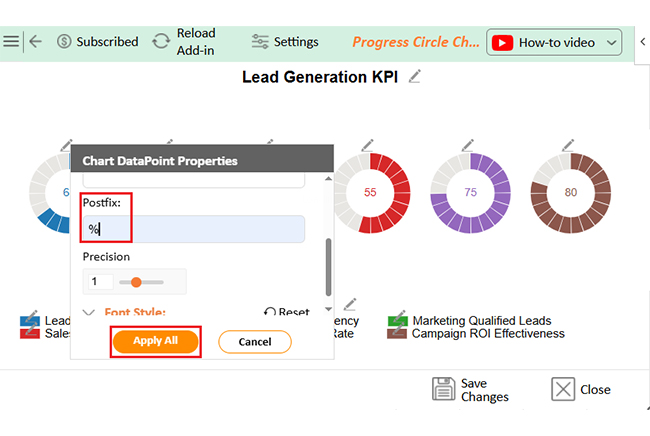
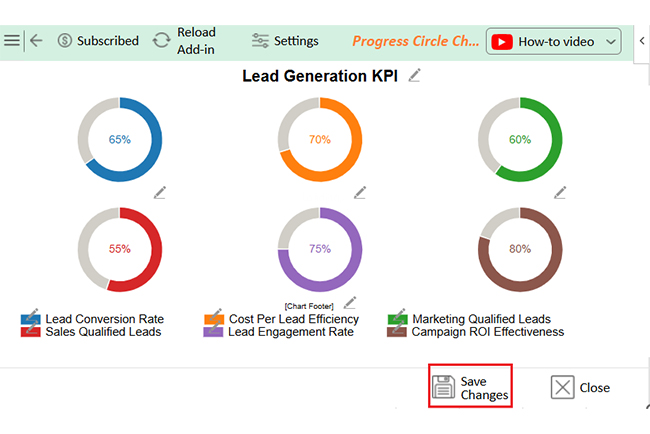
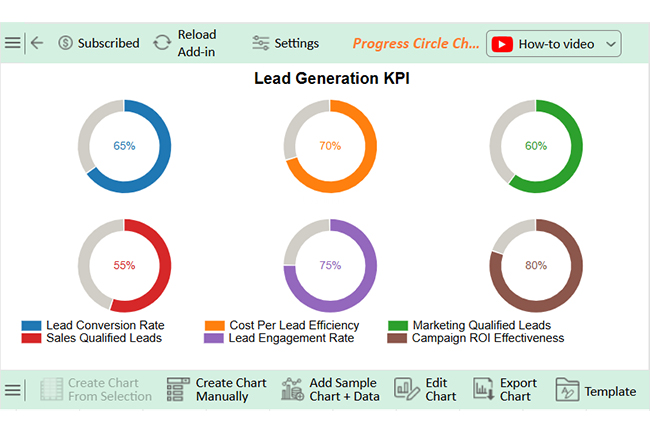
Let’s visualize and analyze this sample data in Excel using ChartExpo.
| Lead Generation KPI | Metric (%) |
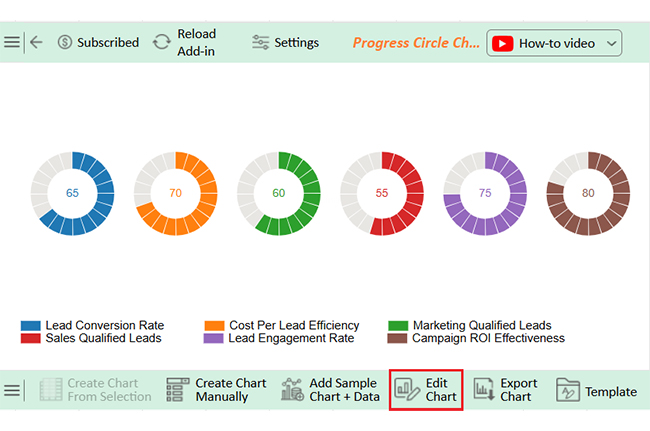
| Lead Conversion Rate | 65 |
| Cost Per Lead Efficiency | 70 |
| Marketing Qualified Leads | 60 |
| Sales Qualified Leads | 55 |
| Lead Engagement Rate | 75 |
| Campaign ROI Effectiveness | 80 |


Lead generation metrics are robust, but they’re not perfect. Numbers can tell you a lot, but they don’t tell the whole story. When misused, they create a false sense of success. Here are some key limitations every team should consider:
Check lead source, engagement level, and buyer intent. Review demographics and behavior, and use scoring models to rank leads. Monitor interactions like email opens, clicks, and demo requests, and prioritize those matching your ideal customer profile.
Lead generation key performance indicators help you track success. They show what’s working and what’s wasting time. Without them, it’s all guesswork.
Every lead counts. But not every lead is equal. These KPIs help you focus on quality, not just numbers. In the retail industry, speed and engagement matter. Retail industry KPIs can reveal which promotions and channels attract high-value customers. These insights drive better sales and service.
Support teams also rely on metrics. KPIs for call center teams track how well leads are handled once they reach your reps. Faster response times often mean better conversion rates. You also need structure. SMART KPIs examples keep your goals clear, measurable, and realistic. They help your team stay aligned and on target.
Conclusively, good data leads to wise decisions. The right KPIs guide strategy, boost ROI, and improve results. Track them consistently, and your lead generation will become more predictable and profitable.
And don’t forget to install ChartExpo. Why? Chart Expo will help you visualize and analyze these KPIs effectively.
How much did you enjoy this article?


Calculate accounts receivable turnover ratio to measure credit collection speed, improve cash flow, and strengthen your financial strategy. Read on!

Change Management KPIs are the key to tracking adoption, performance, and ROI during transitions. Find out which metrics matter. Read on!

Data collection methods and techniques determine the quality of every insight you act on. Explore key approaches for gathering reliable data. Read on!


